
This is the Question on Everyone’s mind .
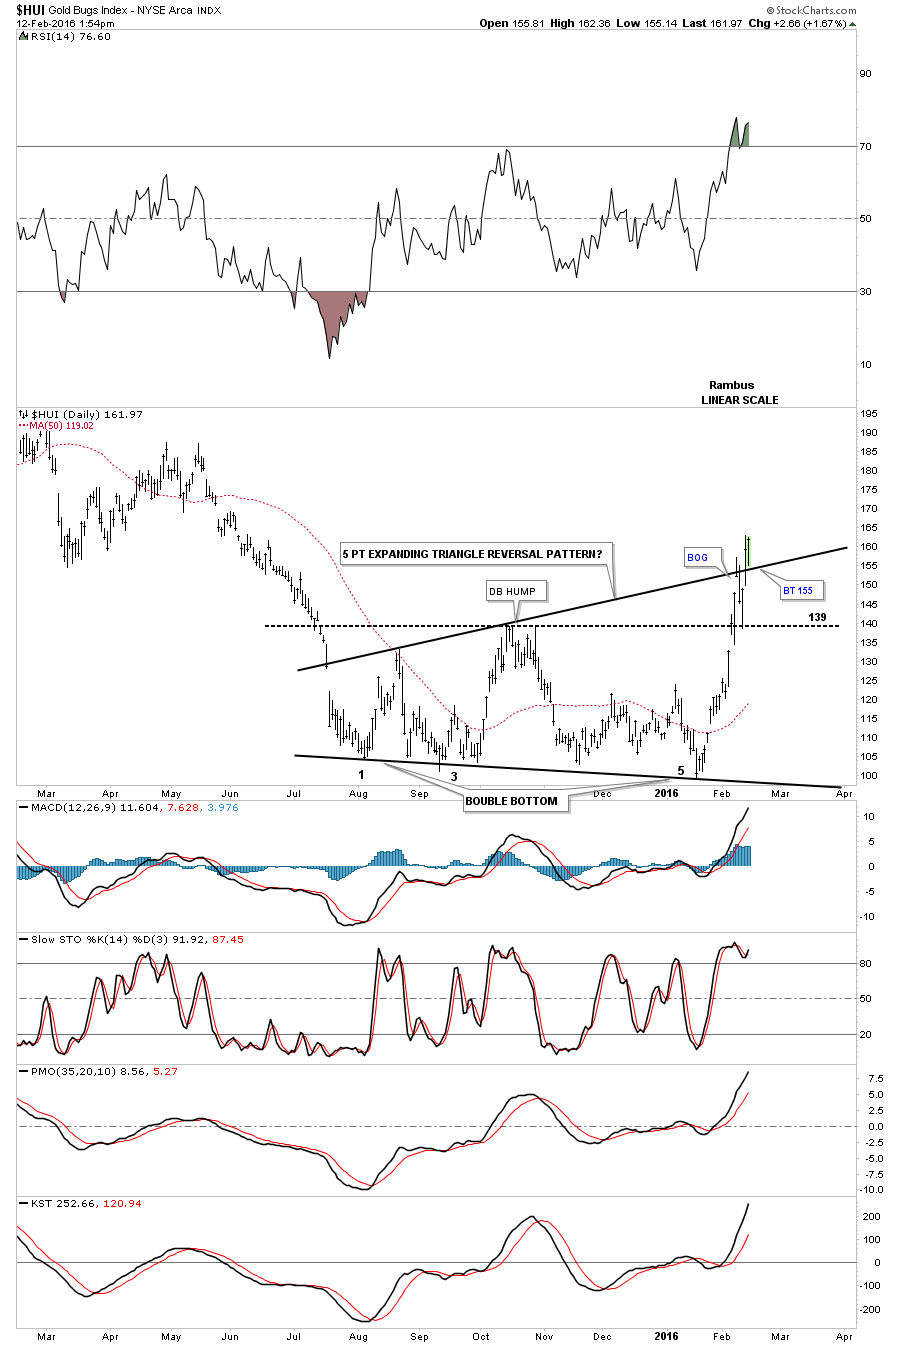
Earlier this week we looked at the expanding triangle as a possible reversal pattern as it was testing the top rail with a beakout gap. The next two days saw the HUI decline back down to the top of the double bottom hump at 139 where it found support. Yesterdays price action took out the top rail of the expanding triangle again. Today the HUI backtested the top rail around the 155 area and is bouncing. There is no doubt the PM complex is overbought but we now have two possible reversal patterns in play. The double bottom which was the first pattern that showed itself and now the expanding triangle which has an odd number of reversal points, five, which makes it a reversal pattern instead of a consolidation pattern.
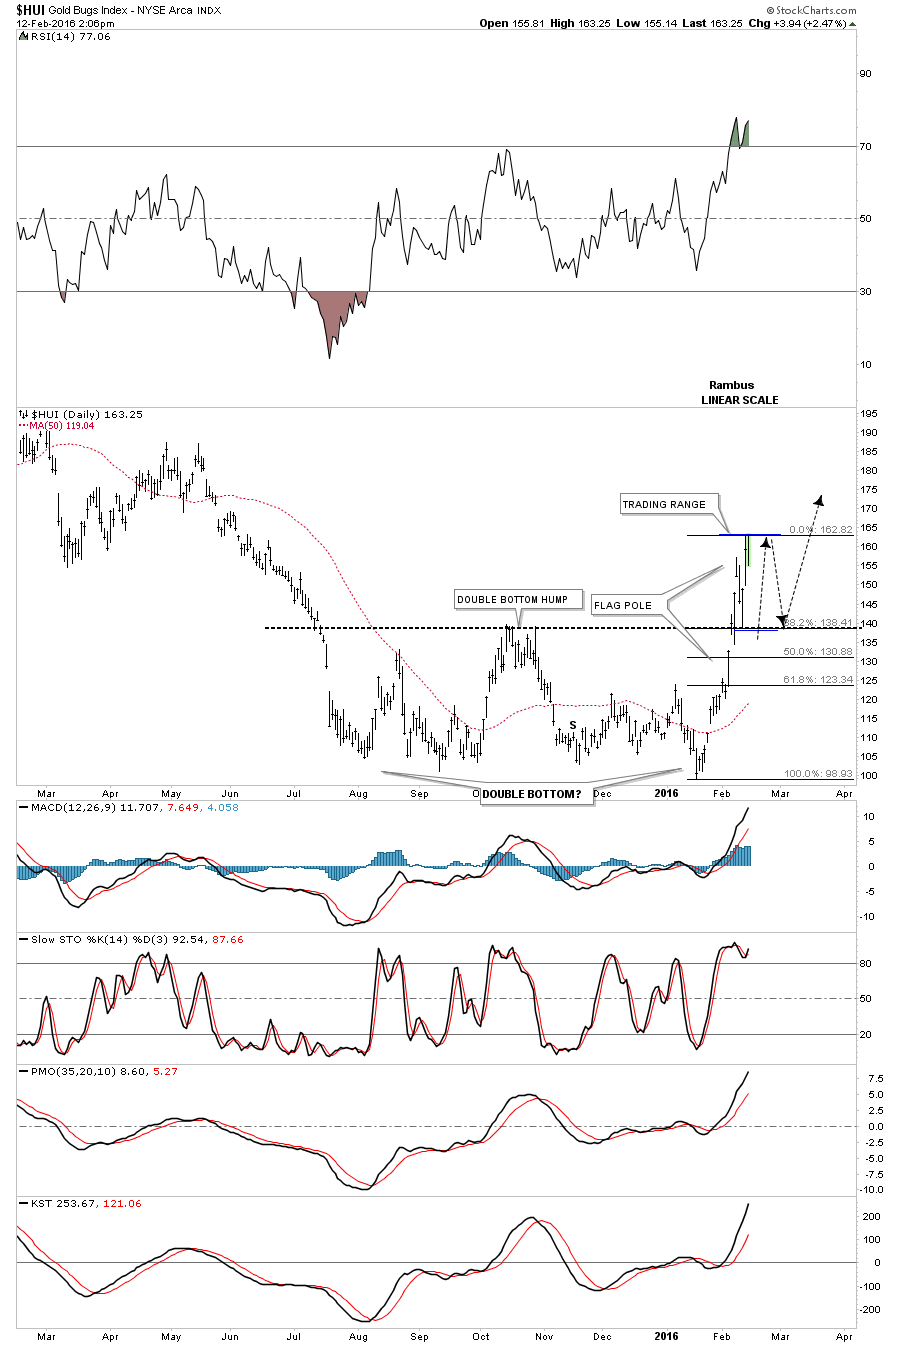
This next daily chart for the HUI shows the double bottom with the flag pole and backtest to the double bottom hump at 139. In a perfect Chartology world what would make the most sense would be for the HUI to form a small consolidation pattern in the area I’ve marked, trading range, which is the area between our current high and the top of the double bottom hump at 139 which is also the 38% retrace of this impulse move. Again this would be the perfect setup but the markets have a way of faking you out sometimes which it maybe doing right now. Even tho the HUI is overbought there is no law that says it can’t get more overbought before the inevitable correction takes place.
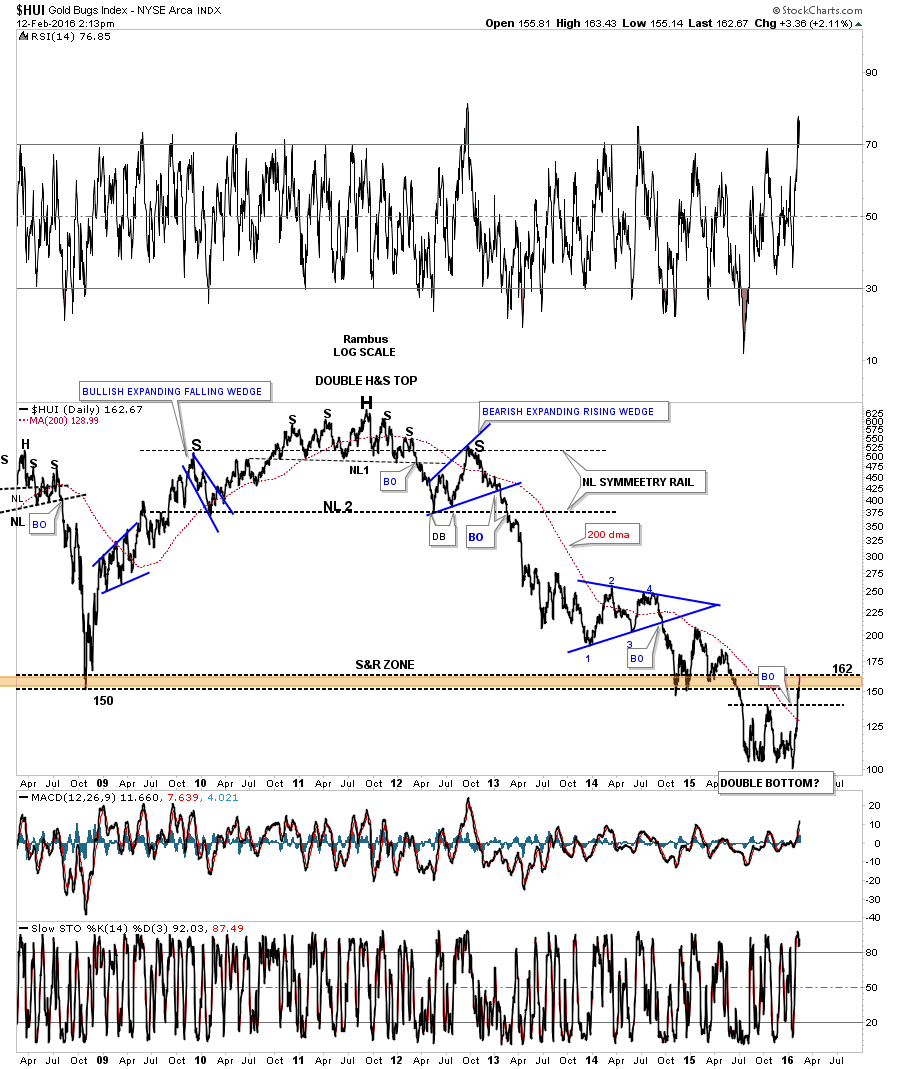
Below is a long term daily line chart which shows the HUI is trading right into the brown shaded support and resistance zone right now.
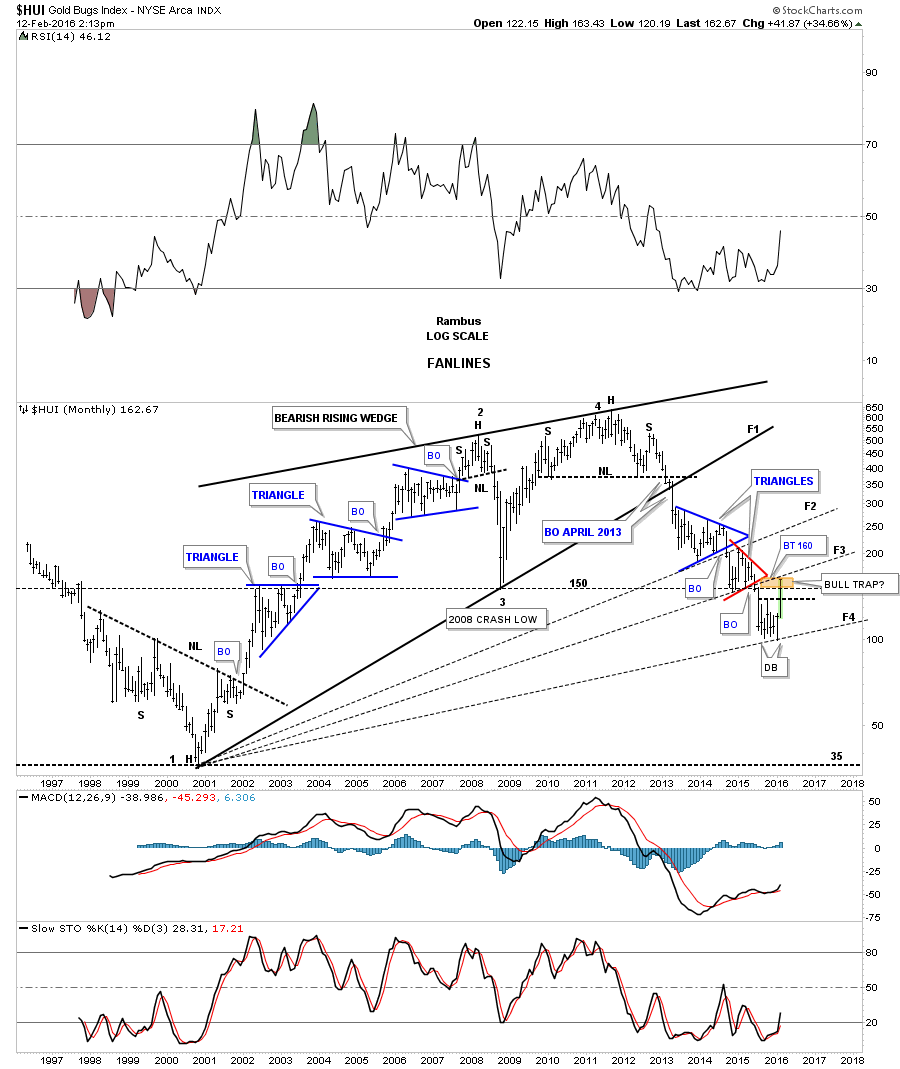
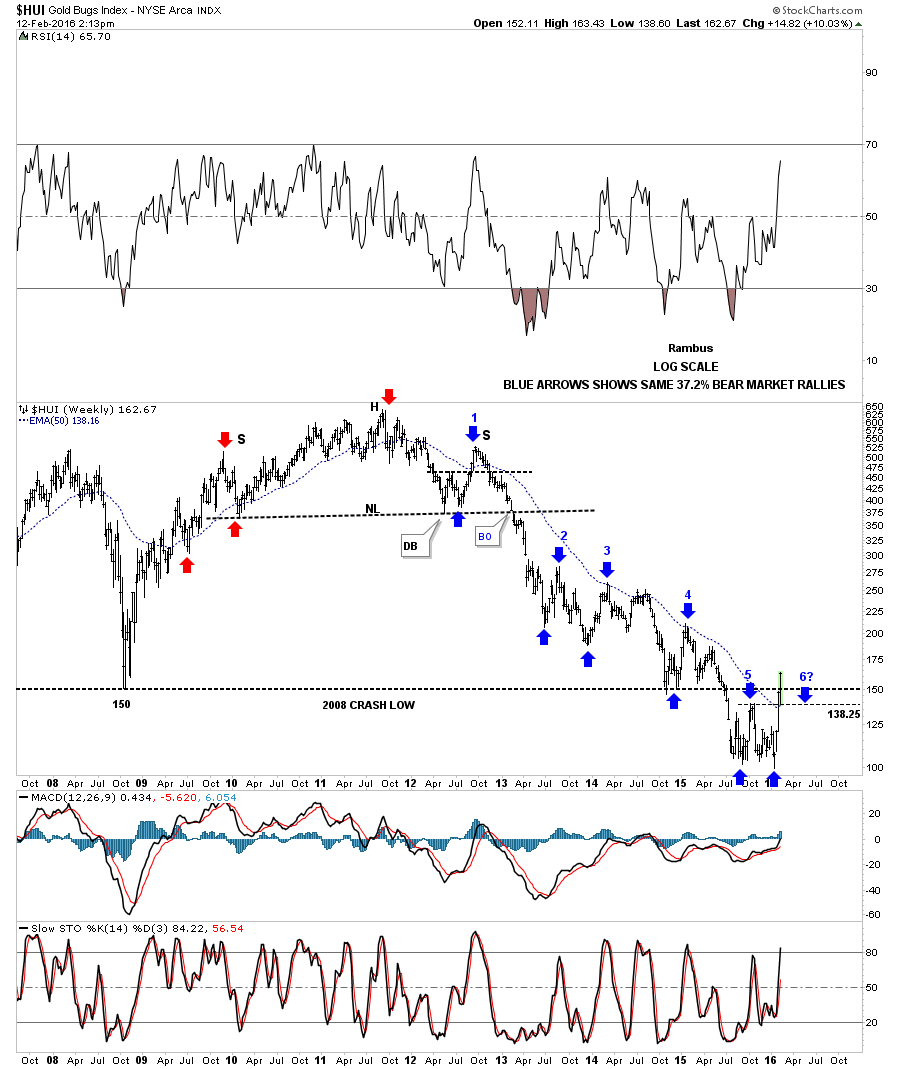
We’ve been following this long term monthly chart for the HUI which shows the fanlines that have developed during the bear market. Normally when a fanline is broken to the downside many times you’ll get a rally that will backtest the previous fanline from below. Right now the HUI is testing fanline #3 from below. The Chart in the ointment .
The weekly chart shows the HUI breaking above the top rail of its bear market downtrend channel.
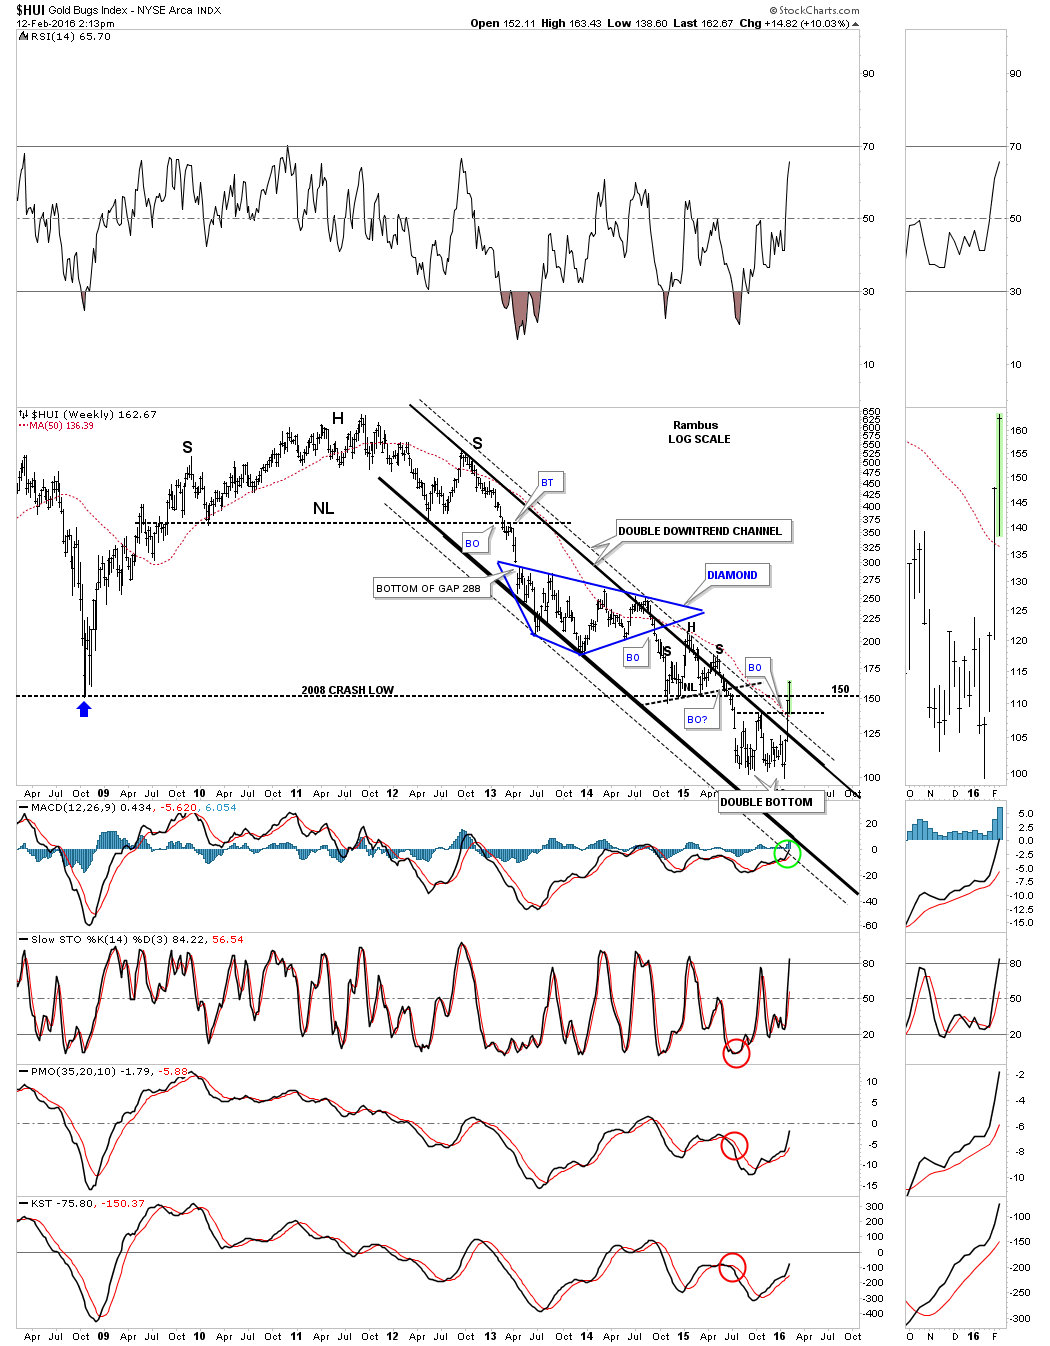
This last chart for the HUI shows its double bottom which has formed after an almost five year decline. I mentioned in the past the two patterns that generally show up at the end of a trend is a H&S or a double bottom or top depending on which way the trend has been going, so the double bottom fits in perfectly for a reversal pattern. The HUI is doing all the right thing in here to reverse its major bear market. There is still some overhead resistance to contend with but if the new bull market is beginning the HUI will find a way to takeout that overhead resistance and start making higher highs and higher lows.

Next Week will be very interesting . Stay Tuned
All the best
Rambus