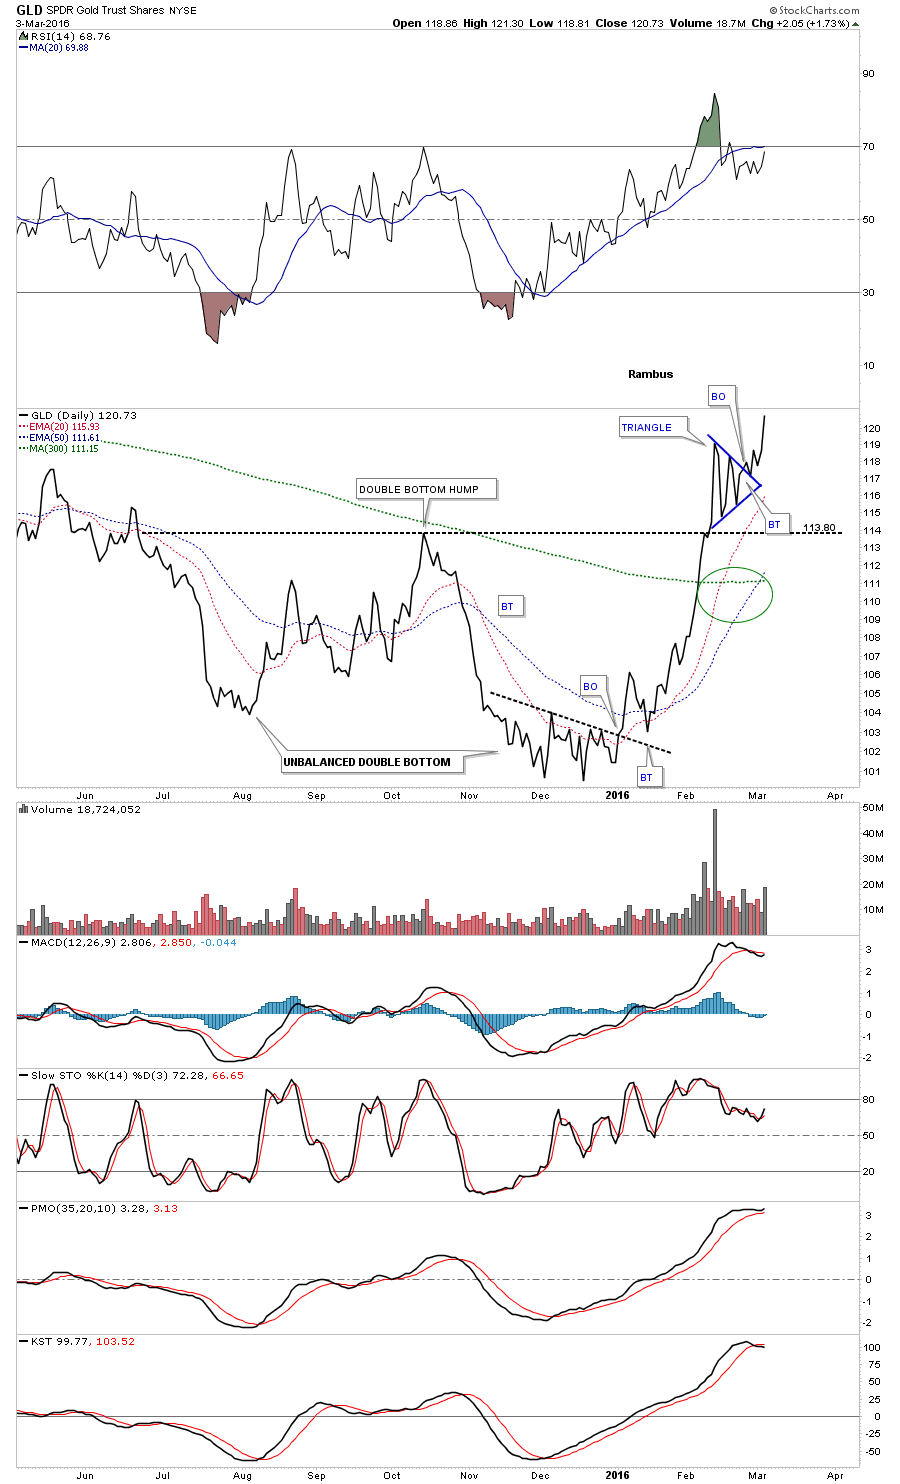
Last week I showed you a daily line chart for GLD which I called a coiling triangle as the price action was getting more compressed as it traded toward the apex. This daily line chart shows the breakout and backtest. Most technicians are aware of the triangle consolidation pattern but its implications may not be understood by most.
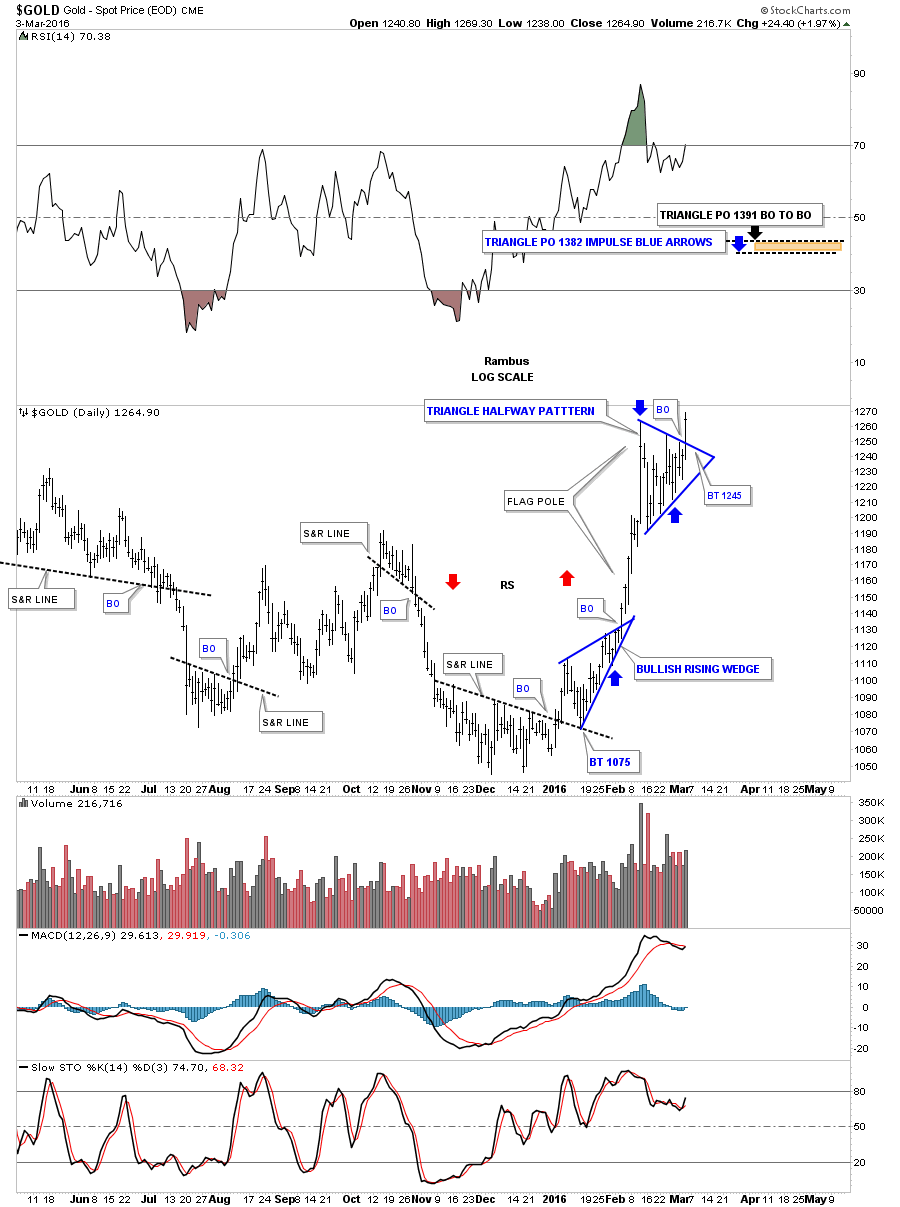
Now I would like to show you a daily bar chart for gold which shows you the power of this particular triangle. If you recall last week I showed many bullish rising wedges in many of the precious metals stocks that looked very bullish. They have morphed a bit but the essence of the bullish rising wedges are still there. This brings us up to the triangle that has been forming in gold. Just like all the bullish rising wedges we looked at on many of the PM stocks, gold has formed it own halfway pattern which is the triangle that everyone now sees. What makes this triangle halfway pattern so important is the way it formed. Whenever you get a vertical move in a short period of time that is called a flag pole. The price action then consolidates that vertical move with a small, usually less than three weeks, flag, wedge or triangle. In gold’s case it formed a triangle.
There are several ways we can measure out for a price objective. The first method on this daily log scale chart is what I call the BO to BO, breakout to breakout method. The measurement starts at the breakout of the lower consolidation pattern which in this case is the bullish rising wedge, up to the first reversal point in the blue triangle halfway pattern. You then take that measurement and add it to the breakout point of the blue triangle halfway pattern to get your price objective which is up to 1391 black arrow.
The other measurement technique I use is the impulse method which measures the impulse move from the lower consolidation pattern, again the blue blue bullish rising wedge, which starts at the last reversal point before the breakout. Take that measurement and add it to the last reversal point in the blue triangle halfway pattern to get a price objective up to 1382 as shown by the blue arrows.
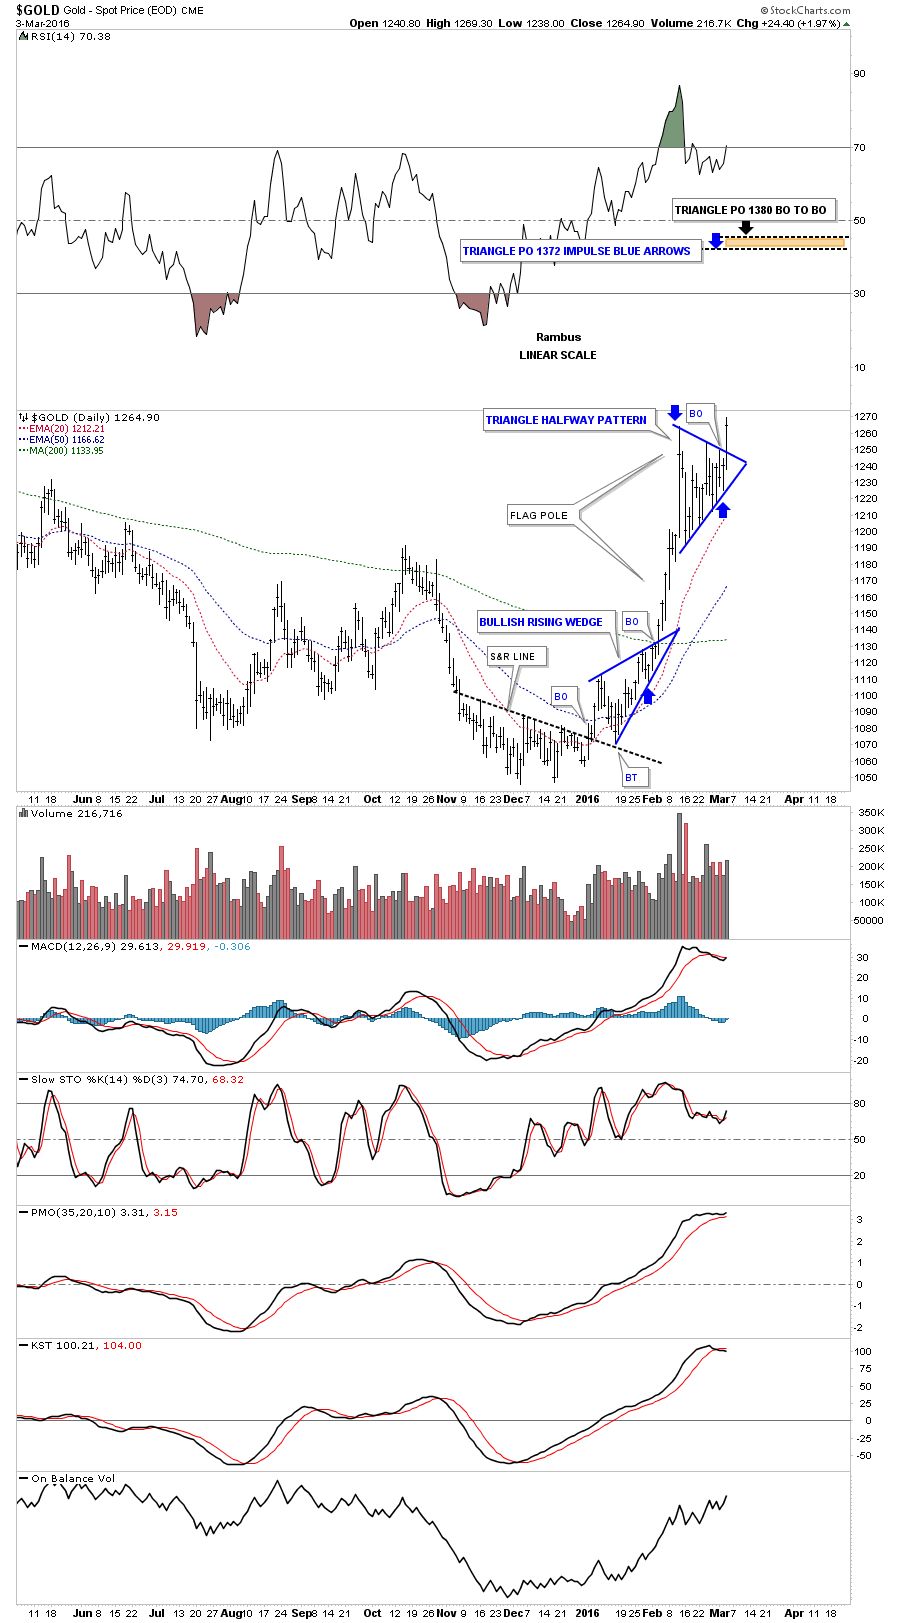
Below is the same chart but this one is in linear scale. The linear scale measures out about ten points lower but it still measures up to the 1400 area which is a nice big round number that should offer some resistance on the initial hit. If you look at the move leading into the triangle halfway pattern, which is nearly vertical, we should see something similar as the price action leaves the blue triangle in time and price.
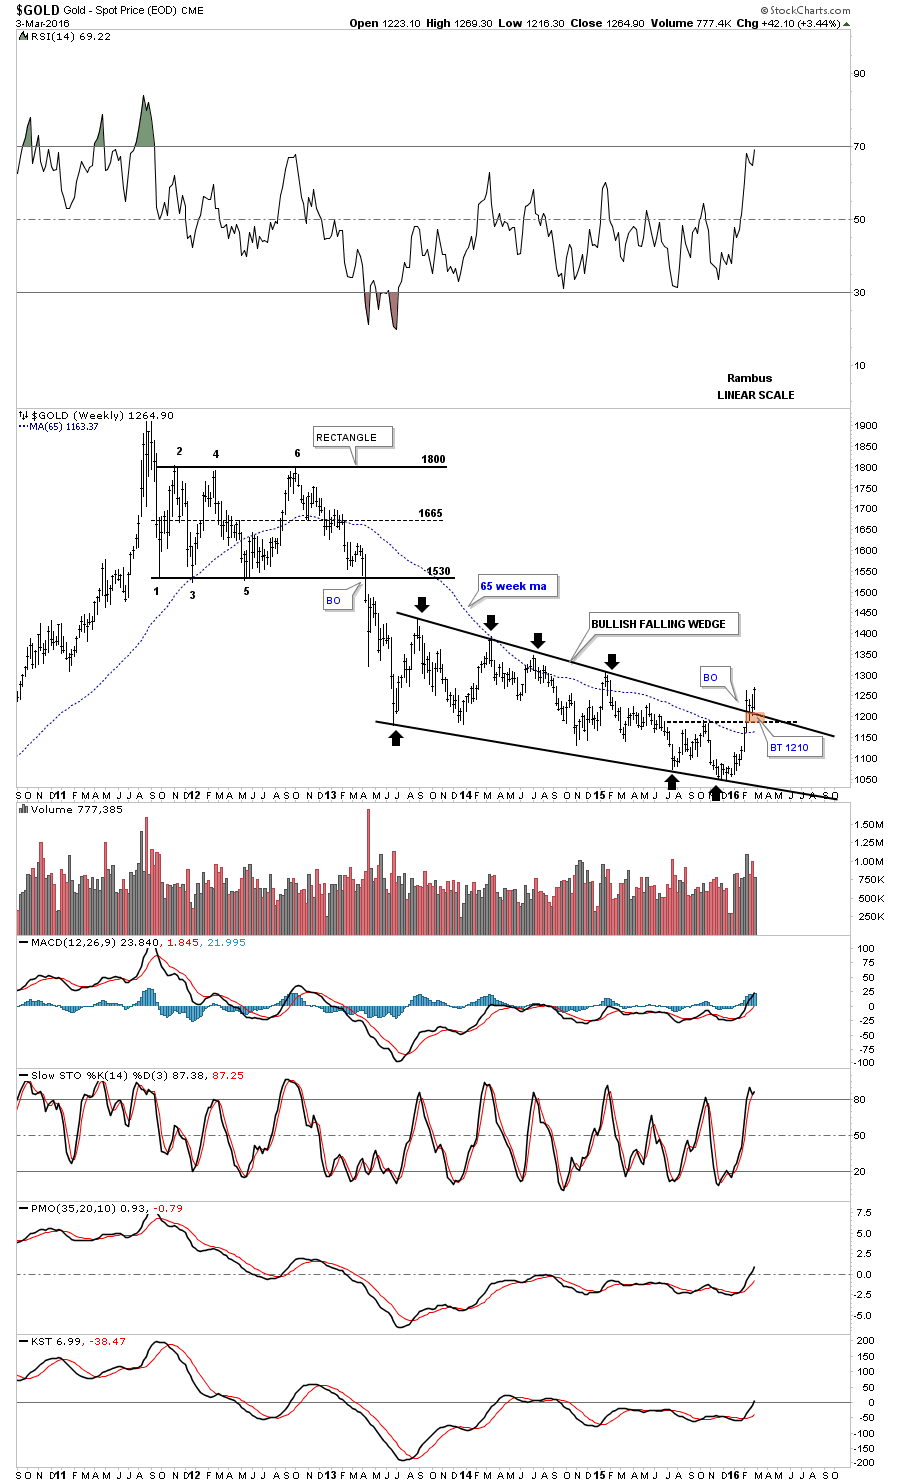
Lets look at one more piece of the puzzle using the blue triangle as a consolidation pattern. Below is a six year bar chart for gold I’ve shown you many times which shows the breakout above the top rail and the backtest that has been taking place. That backtest area, just above the top rail of the bullish falling wedge, is the blue triangle consolation pattern we just looked at on the daily charts above. From a Chartology perspective all the clues are now in place for another impulse move higher. Gold is just now breaking out from the massive four and a half year consolidation pattern.
When you look at this long term weekly chart you can see where the first real area of resistance comes in which is the bottom rail of the blue rectangle that formed the first consolidation pattern with the bottom rail coming in around the 1530 area. So what the price objectives are suggesting and the first real area of resistance at the 1530 area shows it will be interesting to see just how high this impulse move goes. Gold may very well form another consolidation pattern just under the 1400 area that will lead to a move up to the underside of the blue rectangle at the 1530 area. One step at a time.
Some folks are worried that the indicators are all getting overbought but in moves like this they can give you a false sense of security as they can get embedded and just go sideways until the move finally runs its course. The bottom line is that we’re experiencing something very special here. It’s like we’re in the top of the first inning of a new baseball game and the bulls are up to bat. Once the bulls side is retired it will be time for the bears to play their bottom half of the first inning. The game is just getting started folks. All the best…Rambus