
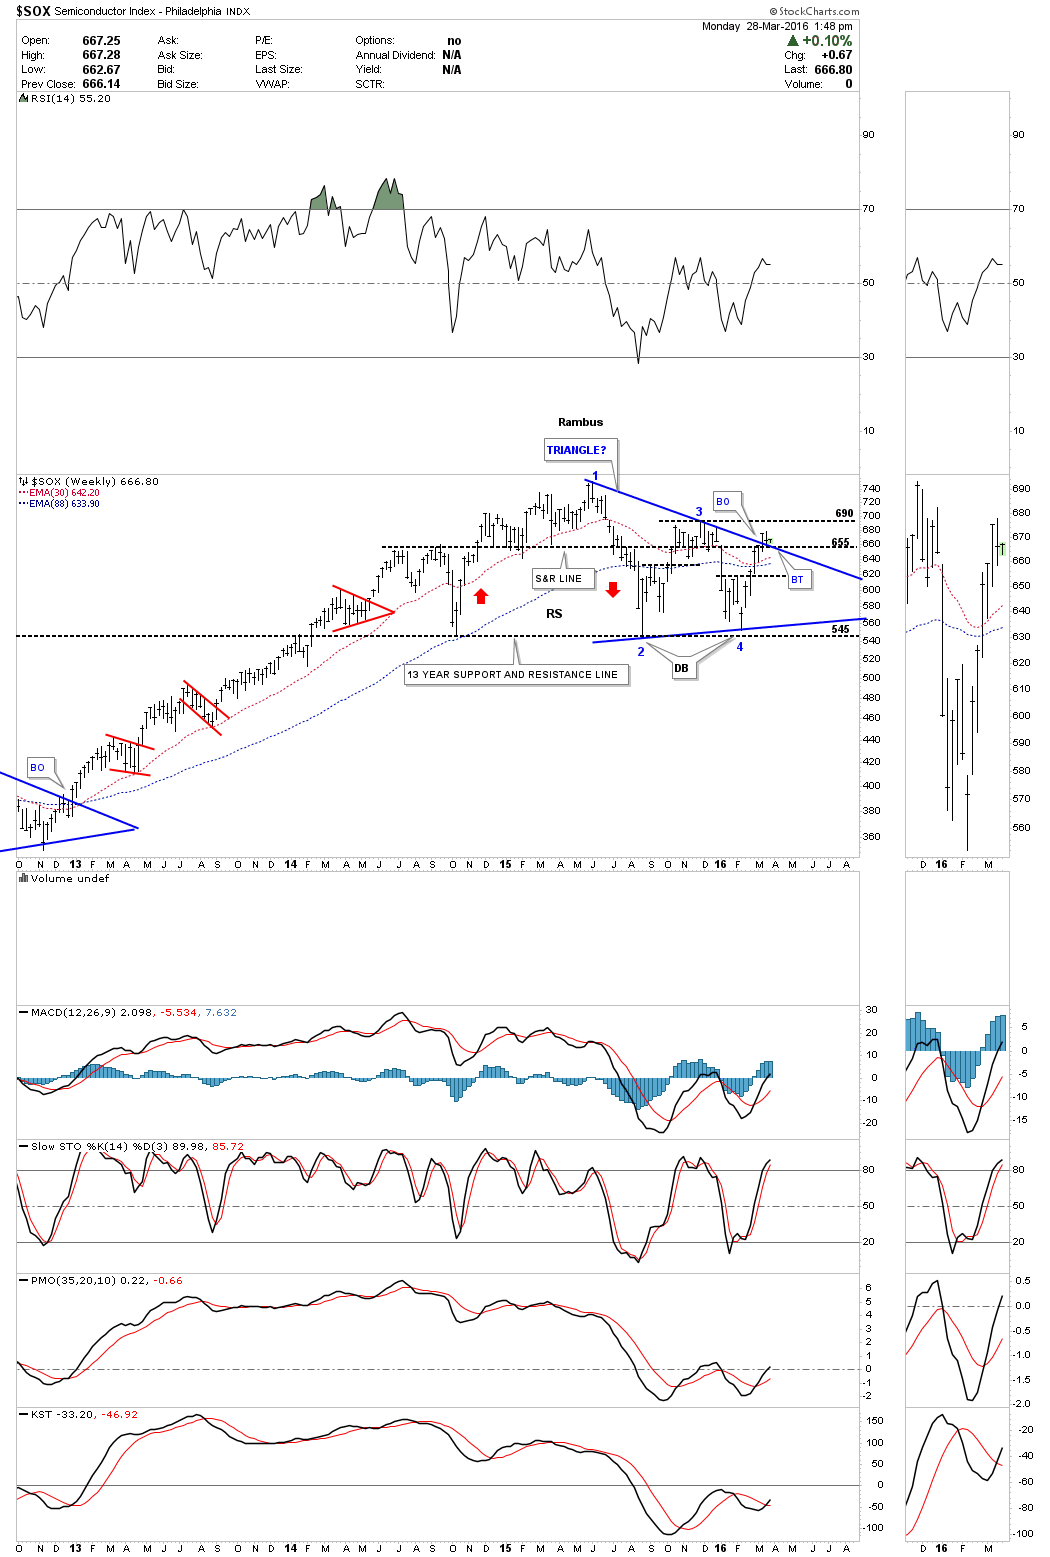
Below is a weekly chart for the $SOX which is under going an important breakout and backtest of the one year blue triangle consolidation pattern. Reversal points #2 and #4 were both double bottoms for the blue triangle which formed on the 13 year S&R line at 545. The next area of overhead resistance will come in at the previous high at 690 or so.
The monthly chart shows why the 545 support and resistance line is so important to the big picture. It extends back in time 13 years or so when the blue 5 point flat top triangle reversal pattern formed and broke to the downside. The support and resistance line then reversed its role to support once the SOX broke back above it in 2014. There is also some nice Chartology on this long term monthly chart as shown by the 10 year bullish falling wedge. Note the little red bull flag that formed just below the top rail right before the breakout and then the blue triangle that built out as the backtest. This sector has lagged some of the other areas within the technology sector but it may play catch up going forward as long as the S&R line at 545 continues to hold support.
