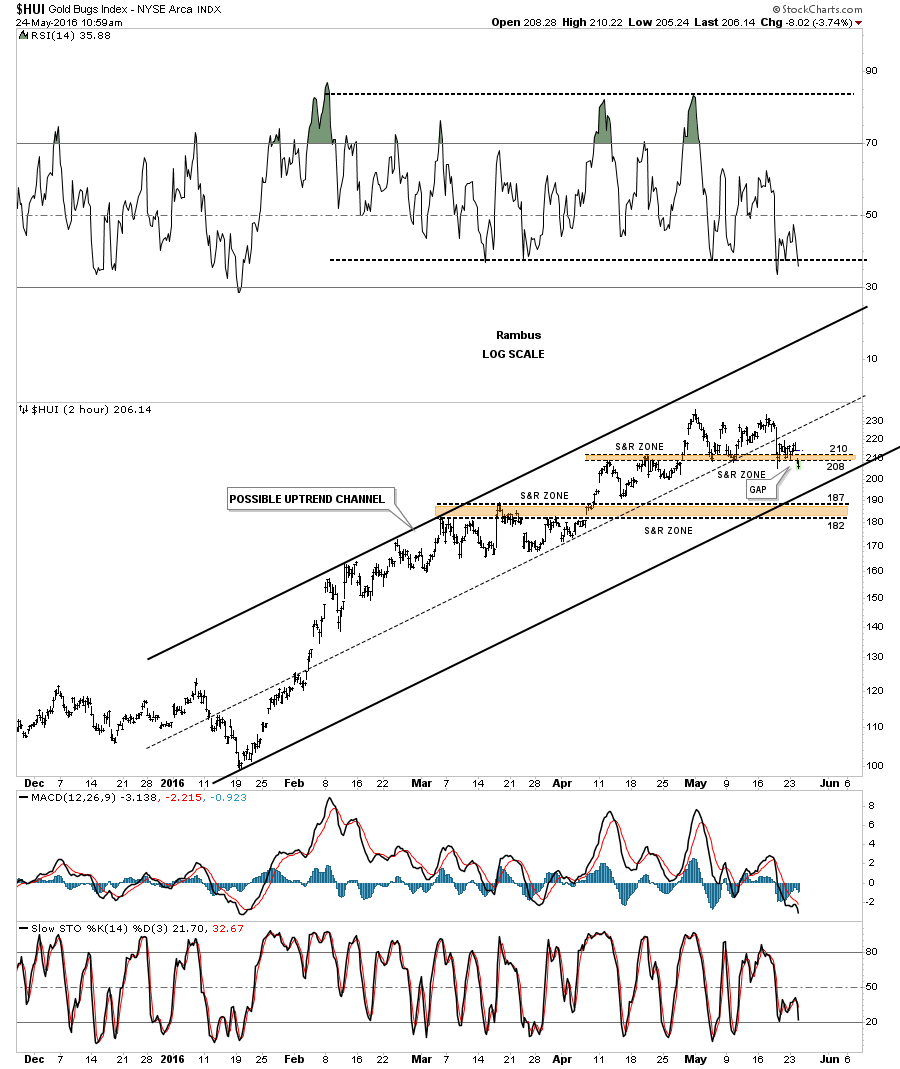
Below is the two hour chart for the HUI which shows the horizontal S&R zone around the 210 area which is being strongly tested this morning. If you look real close you can see a gap below the S&R zone this morning which I didn’t want to see. This is the first time since the bull market began in mid January that the price action is close to trading below a previous low. The next area of critical support is the 182 to the 187 area.
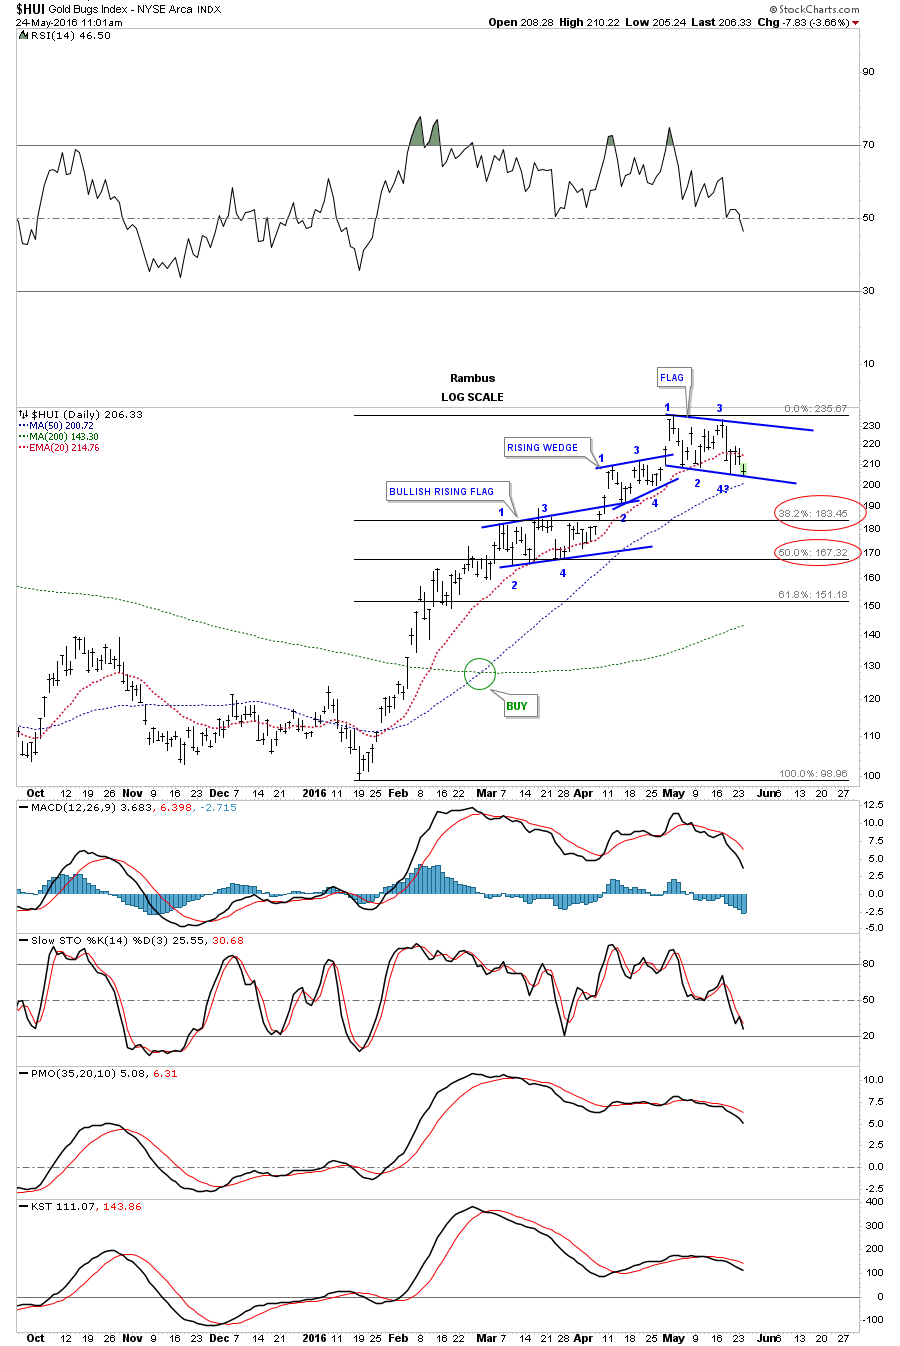
This next chart is a daily look at the HUI which shows two completed consolidation patterns with the third one testing the critical bottom rail of the flag formation. Today’s price action is trading below the 20 day ema with the 50 day simple moving average coming in at the 200 area. I’ve also added the fib retracements which shows the 38% retrace at 183 or so which is the second area of support on the 2 hour chart above.
So far, since this bull market began in mid January of this year, we have yet to see a real consolidation pattern develop of importance form.. This daily chart below shows you where I would expect a consolidation pattern to form based on the current information we have. In the bigger picture this would be a healthy development and not hurt the bull market in anyway.
In bigger consolidation patterns you will normally see some type of reversal pattern form at the reversal points. Sometimes they are hard to spot in real time but in hindsight they will usually show up pretty clearly. On the daily chart below I’ve added the possible new trading range or consolidation area with what now looks like a small double top with a breakout and backtest completed. The double top measures out to the 190 area which would be an area to look for the second reversal point to show up. Based on the lower brown shaded S&R zone, on the two hour chart above, and the fib 38% retrace down to the 183 area, should offer some solid support. For the time being I’m going to call the top in the possible new trading range or consolidation area at 235 and the bottom at 180 or so. What type of consolidation pattern that may build out is still not known yet as the HUI has just started to consolidate the first impulse move up. The consolidation pattern could be a triangle, rectangle, flag or wedge.
Bigger trading ranges like this can be traded if one doesn’t get too greedy. We should see some type of reversal pattern develop at the lower boundaries of the trading range between 180 and 190 or so.
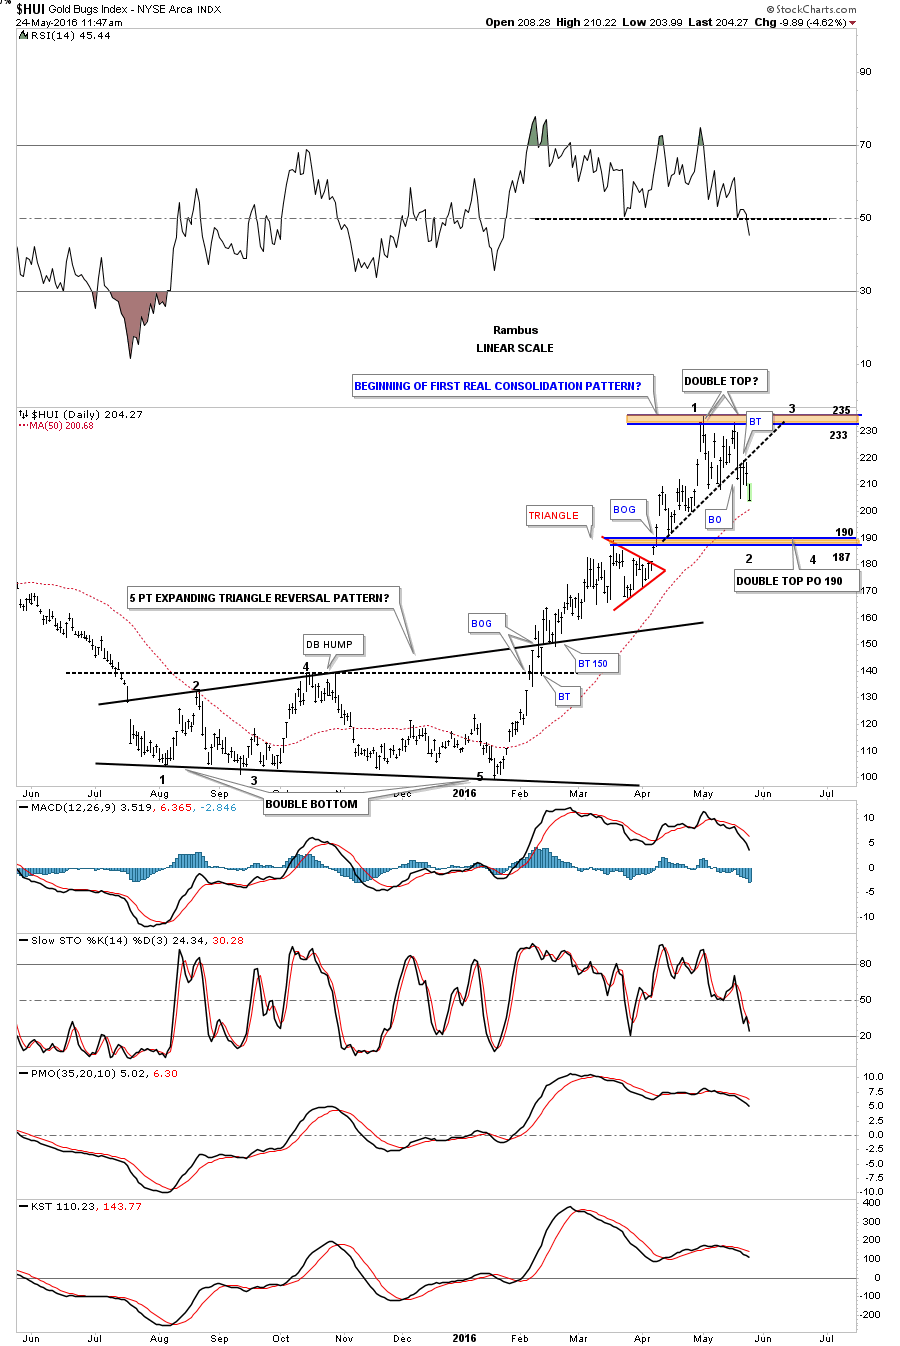
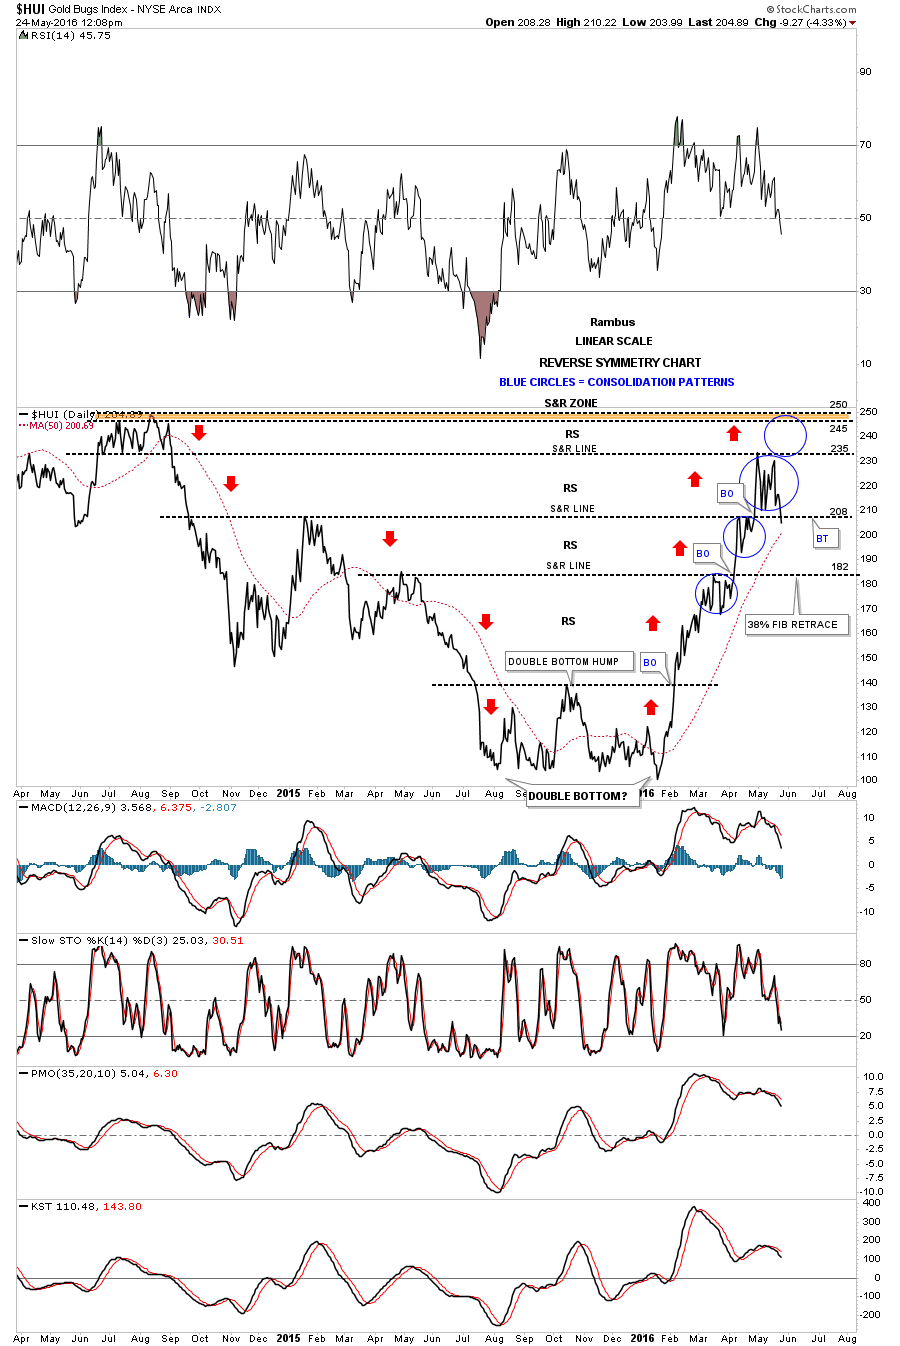
Below is the daily line chart we’ve been following which shows the current S&R line being strongly tested today at the 205 area. If this area gives way then the lower S&R line at the 182 area comes into play which is also the 38% fib retrace of the bull market.
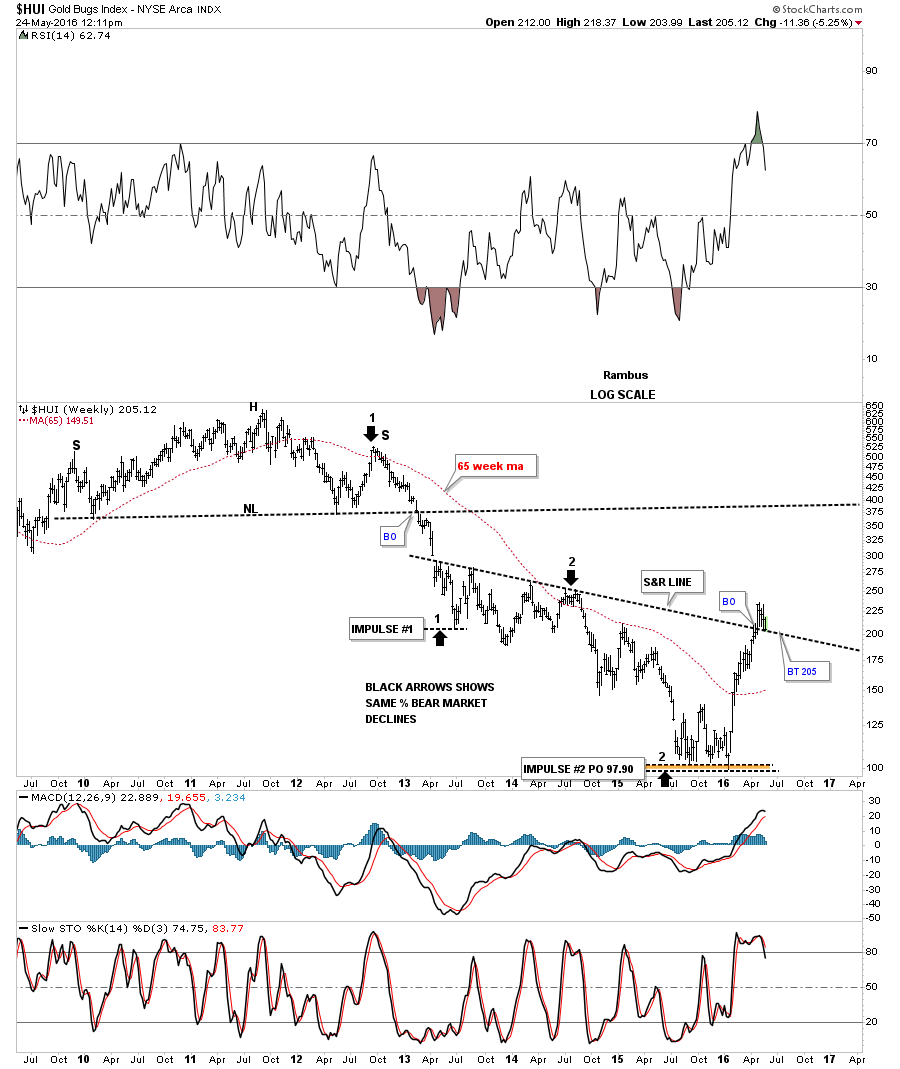
The weekly chart below shows the three year S&R line going back to April of 2013 which comes into play at the 205 area.
For the time being I’m going to hang on and see what happens if this possible first consolidation pattern begins to build out between 180 and 235. It will be somewhat painful but that is the nature of a consolidation pattern, to inflict as much pain as possible before the next impulse leg up can begin. Some of you who have some decent profits may want to take a few chips off the table and see if you can reenter at a lower price. Normally though it seems like one always pays a higher price up to get back in again.
If this is really the beginning of a bigger consolidation pattern the volatility will be very strong in both directions until the pattern is complete. Also keep in mind in a trading range we’ll have to see a minimum of four reversal points so even if we see a reversal down at the 180 area we’ll have to see another rally followed by one more decline to complete the minimum requirements of a consolidation or continuation pattern.