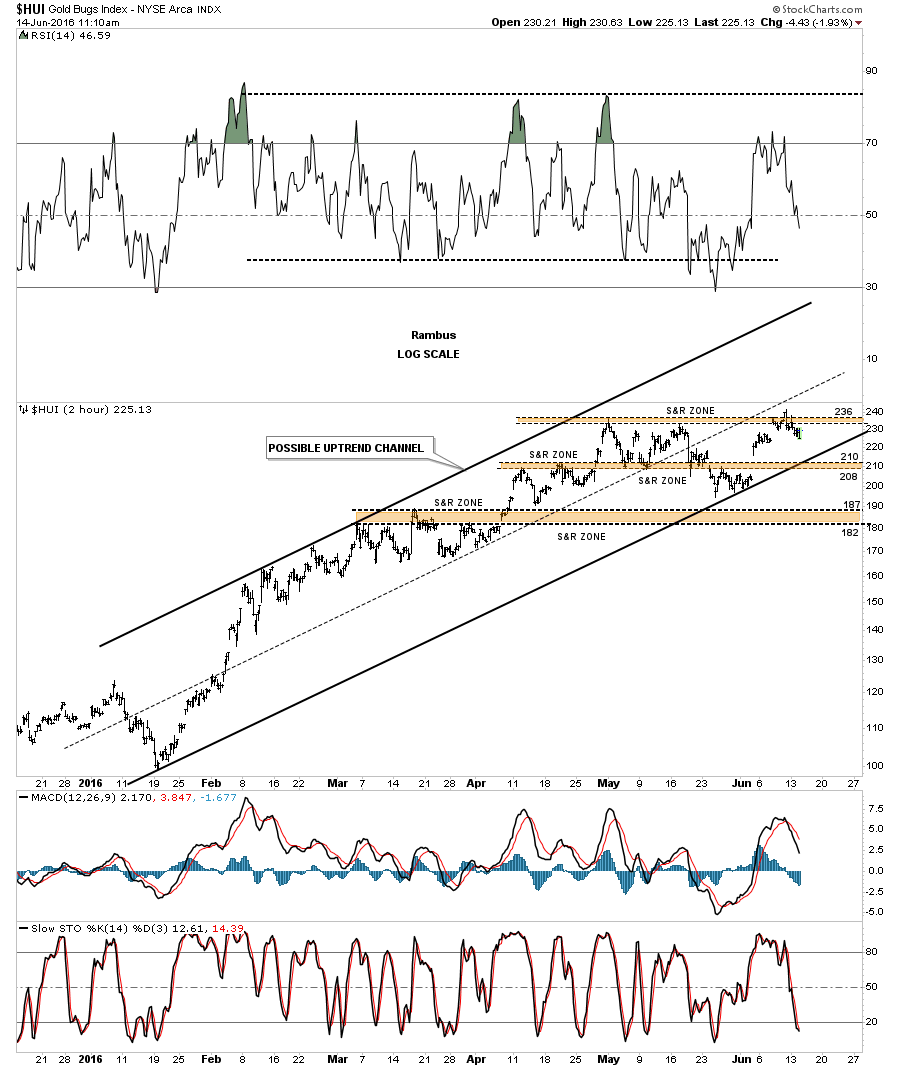
Lets review some charts for the HUI and see where we’re at in the short to longer term horizons. Below is the 2 hour chart we’ve been following which shows the three brown shaded horizontal support and resistance zones. The HUI made an attempt to breakout above the top S&R zone but failed to follow through. The next area of possible support should come in at the previous S&R zone between 208 – 210 which is also the bottom rail of the possible uptrend channel. The lowest S&R zone between 182 – 187 is the most important area for long term support.
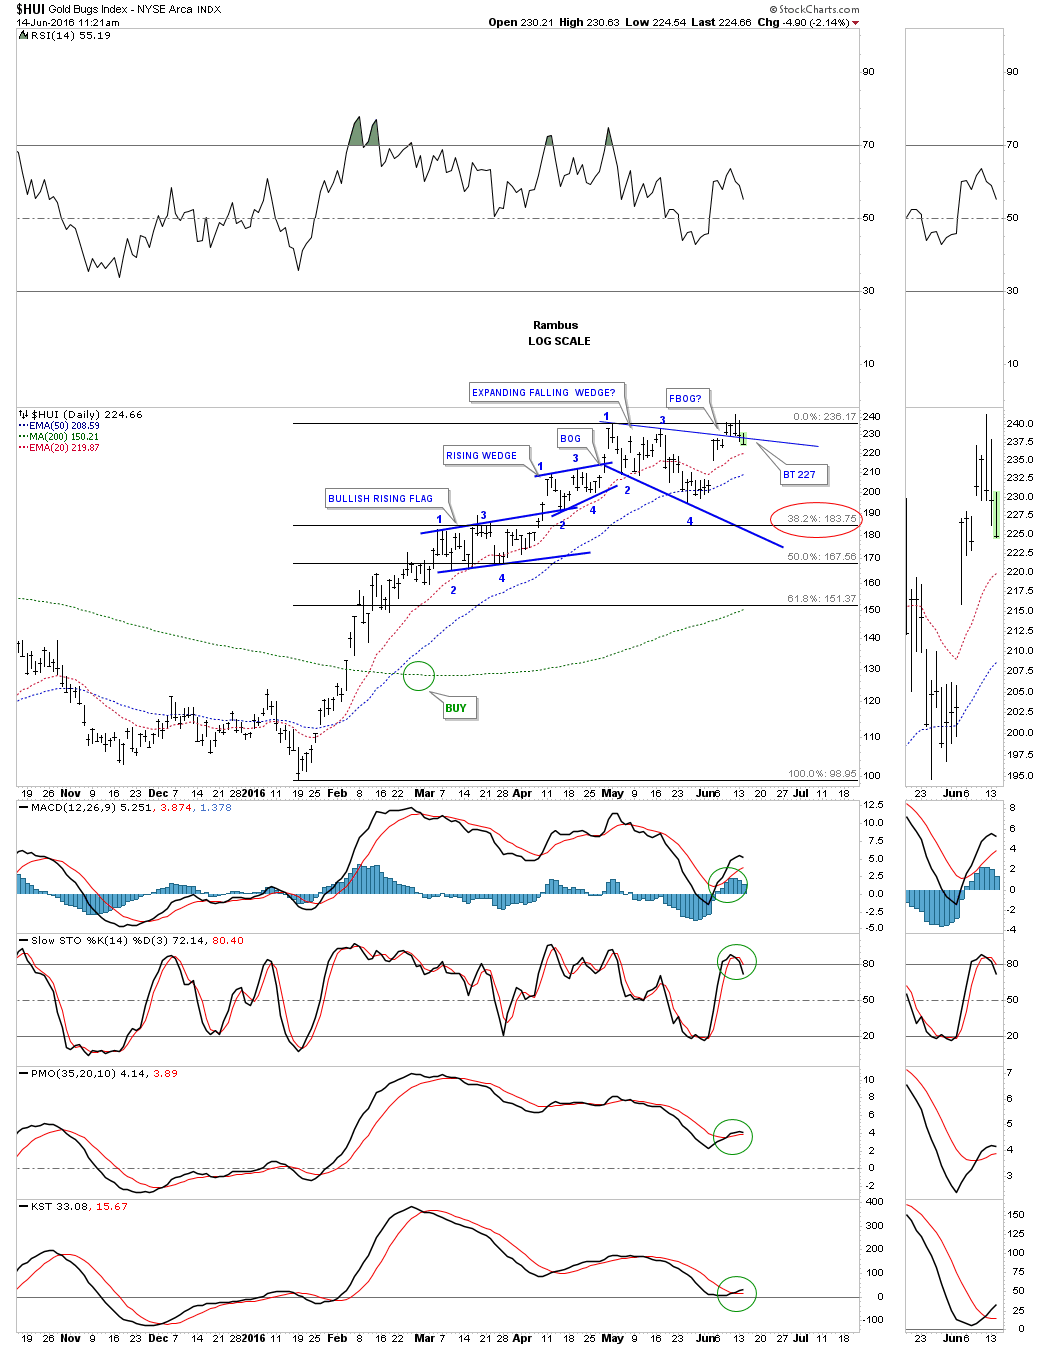
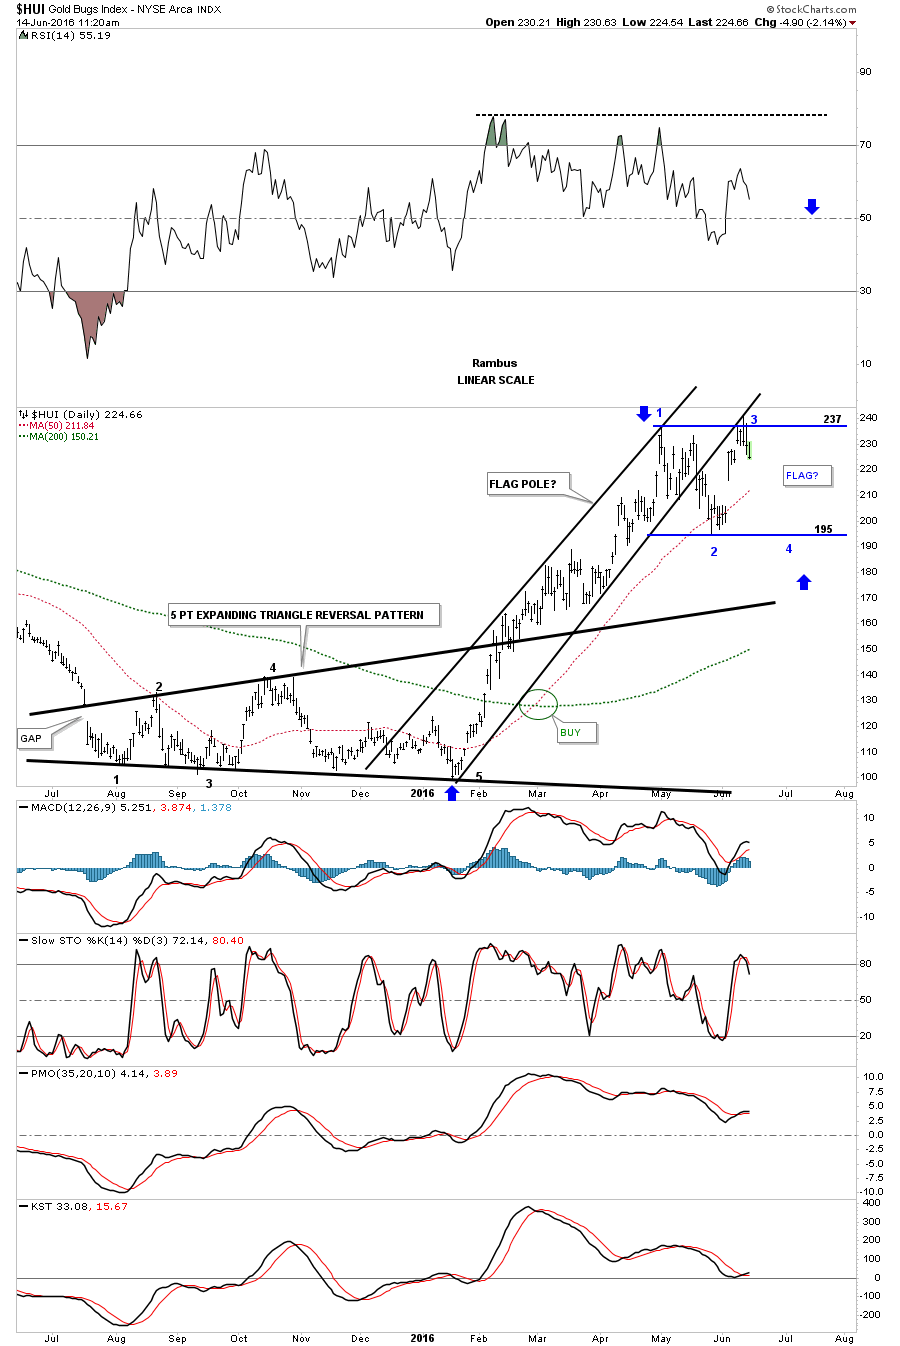
This next chart is a daily look which shows the top rail of the small expanding falling wedge giving way today which is not what I wanted to see on the very short term chart. This failure opens up the door for another reversal point to the downside to begin. Below the current price action are three possible areas of support, the 20 and 50 day ema’s with the 38% fib retrace at 183 or so.
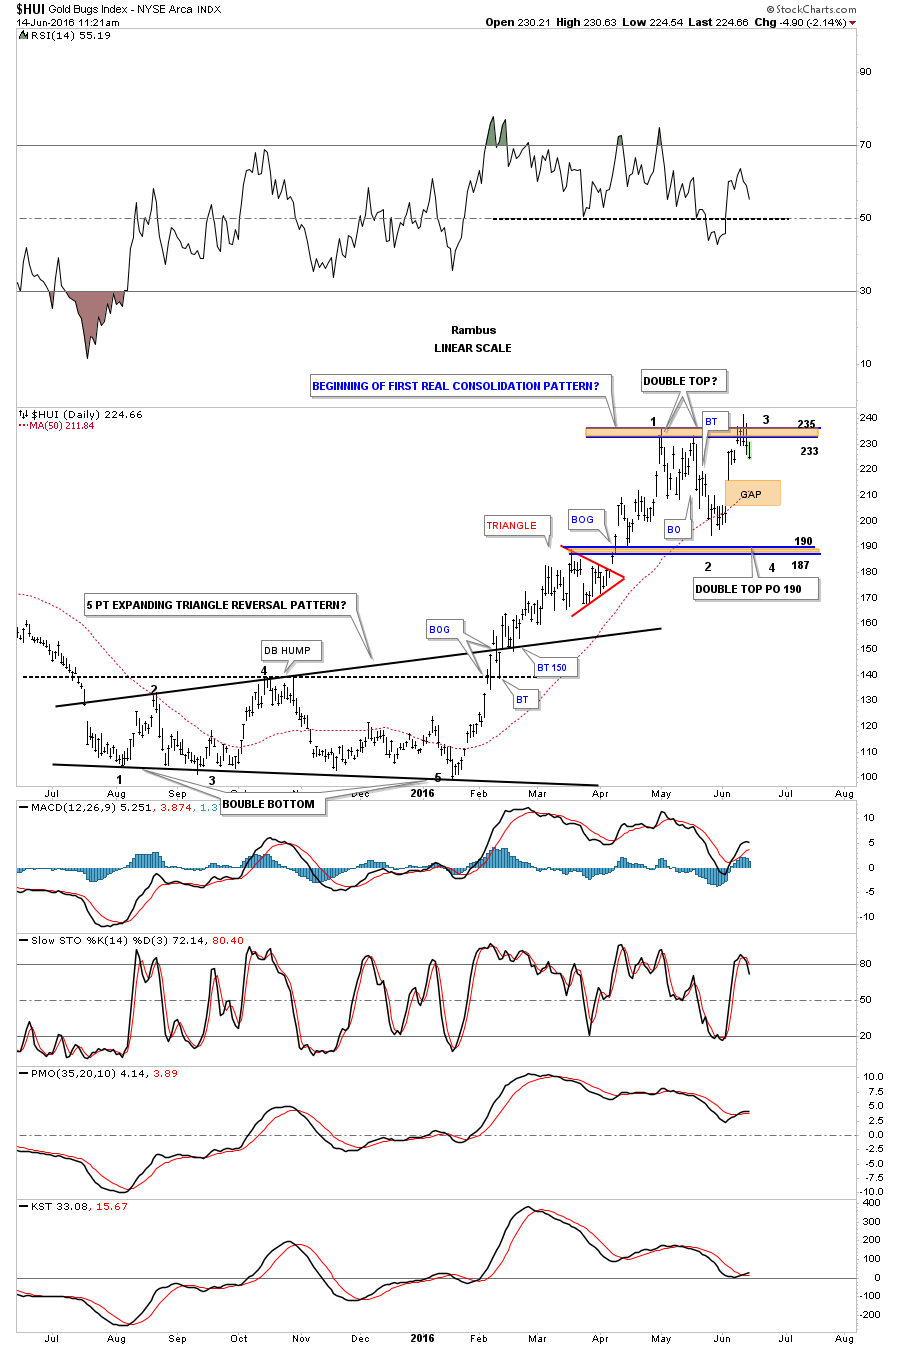
This second daily chart for the HUI shows where I laid out a possible bigger trading range with the top at 235 and the low around the 190 area. This last rally up to the 235 area completed the second reversal point with the possible 3rd one to the downside beginning. When I laid out this possible scenario I said we had to see one more decline to complete a consolidation pattern of some kind. The fourth reversal point is always the hardest to spot in real time because it doesn’t show its self until after the fact.
Below is another daily chart we looked at recently which shows the potential bullish set up with the rally off the January low being the flag pole and the flag which is currently in the developing phase right now.
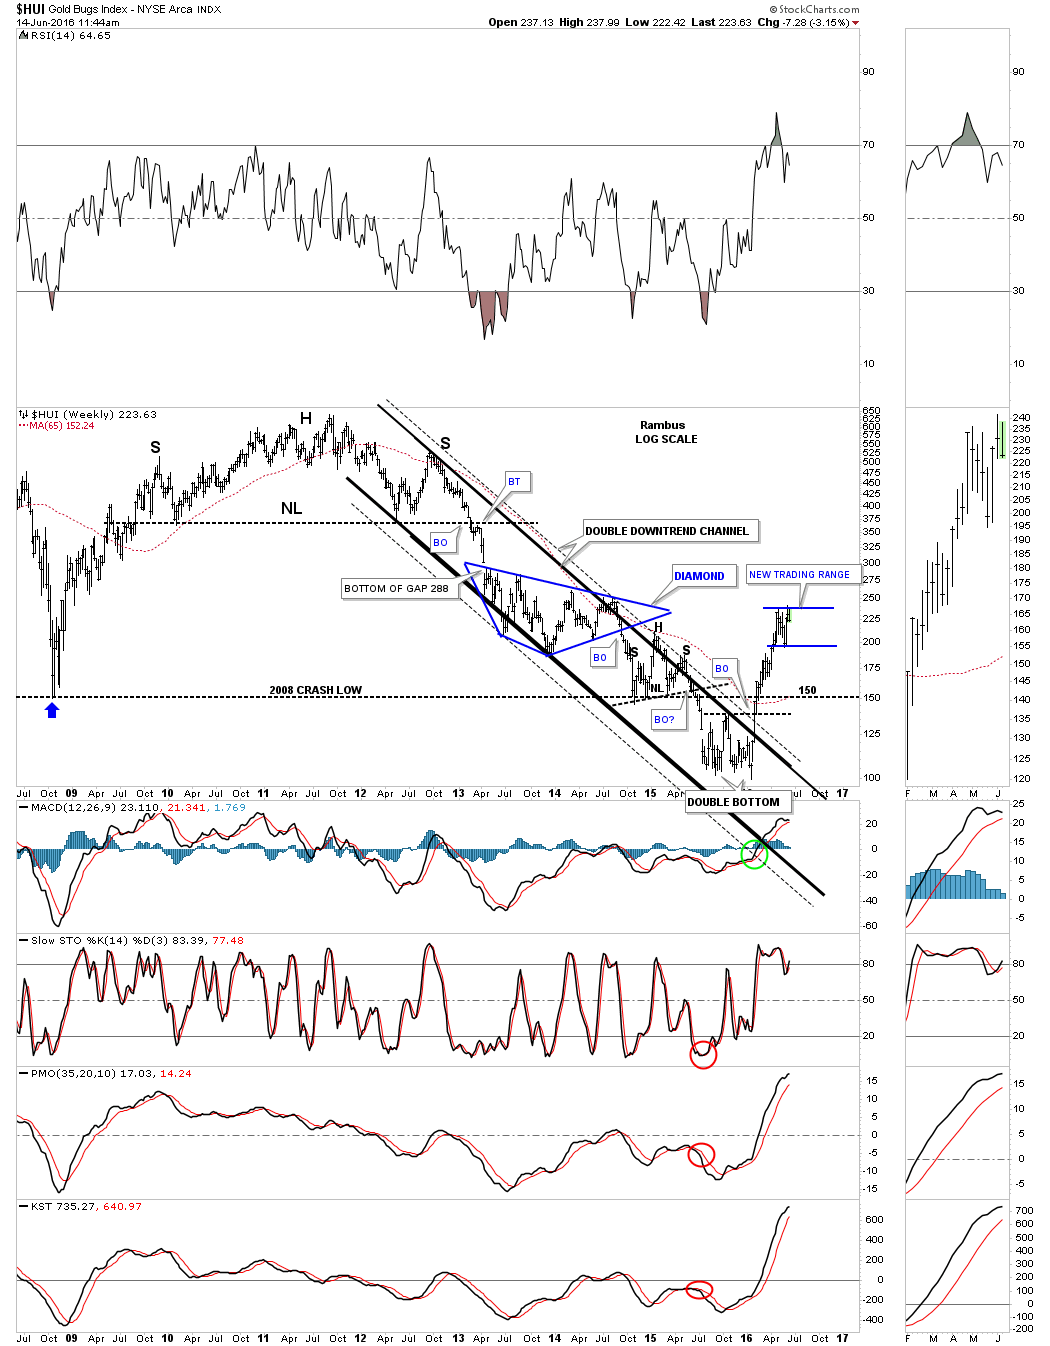
Lets look a few longer term charts to put everything in perspective. This first weekly chart shows the rally out of the January low this year and the blue trading range that is developing between 190 and 235. From a long term view this looks like a good place for the HUI to catch its breath and consolidate the massive first impulse leg up.
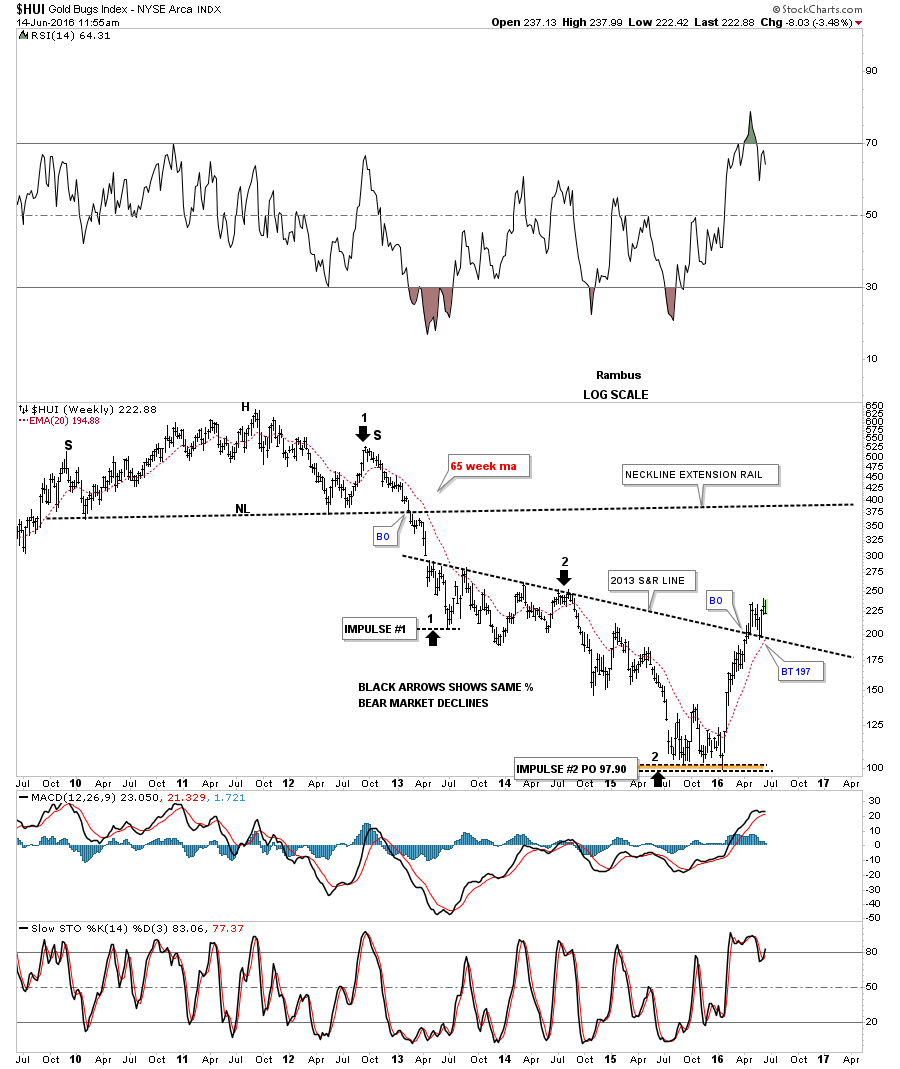
This next weekly chart for the HUI shows that important S&R line which I labeled the 2013 S&R line, as it held on the last backtest from above so we know it’s hot. The 20 week ema is also moving up to the 2013 S&R line and should help with support.
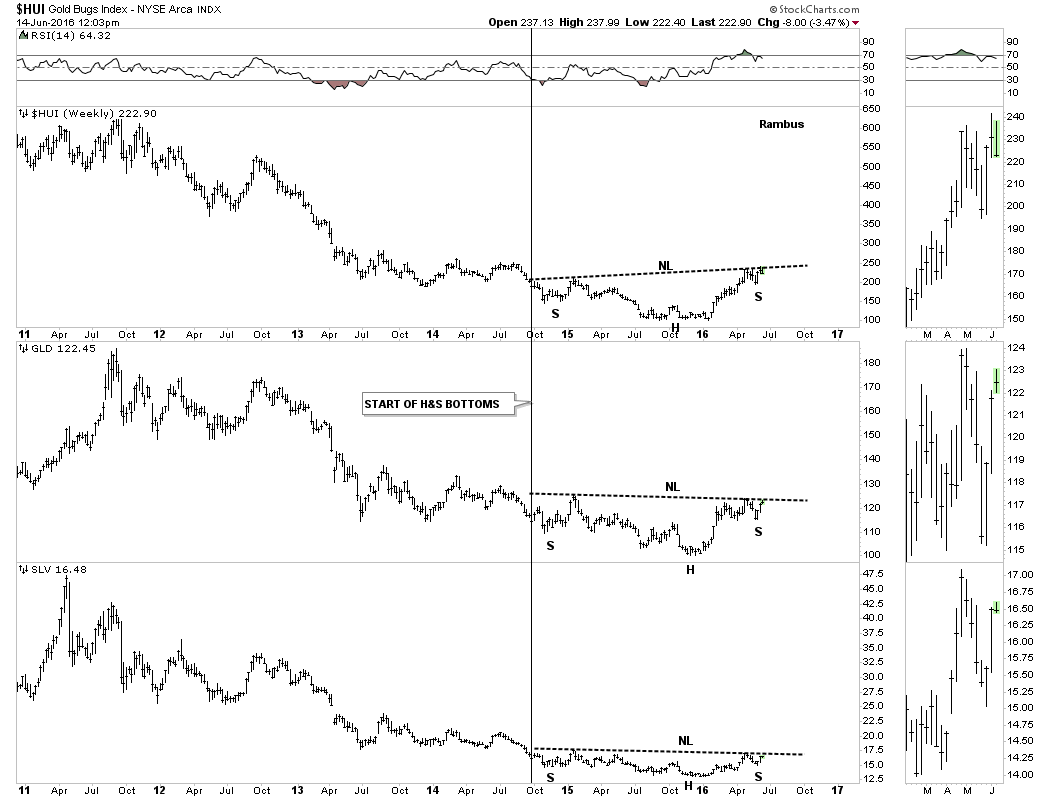
Next I would like to show you a couple of combo charts which has the HUI on top, Gld in the middle and SLV on the bottom. This first combo chart we’ve been following for a very long time which shows the big three year falling trading ranges finally breaking out to the topside this year. This chart gives you a sense of how close all three are trading to the top of their recent move up.
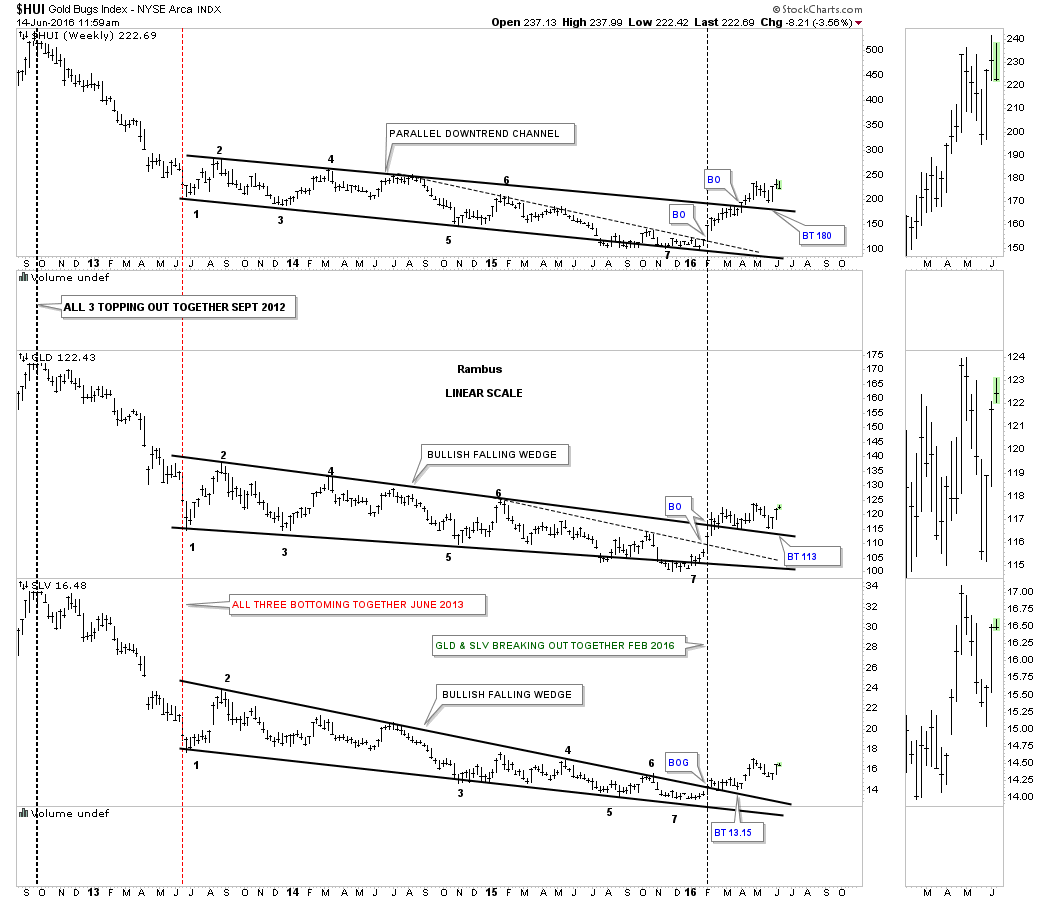
This next combo chart shows how all three may very well be forming a very large inverse H&S bottom. All three have been testing their respective necklines from below for several months now. The black vertical line shows where they all began to build out their possible H&S bottoms.
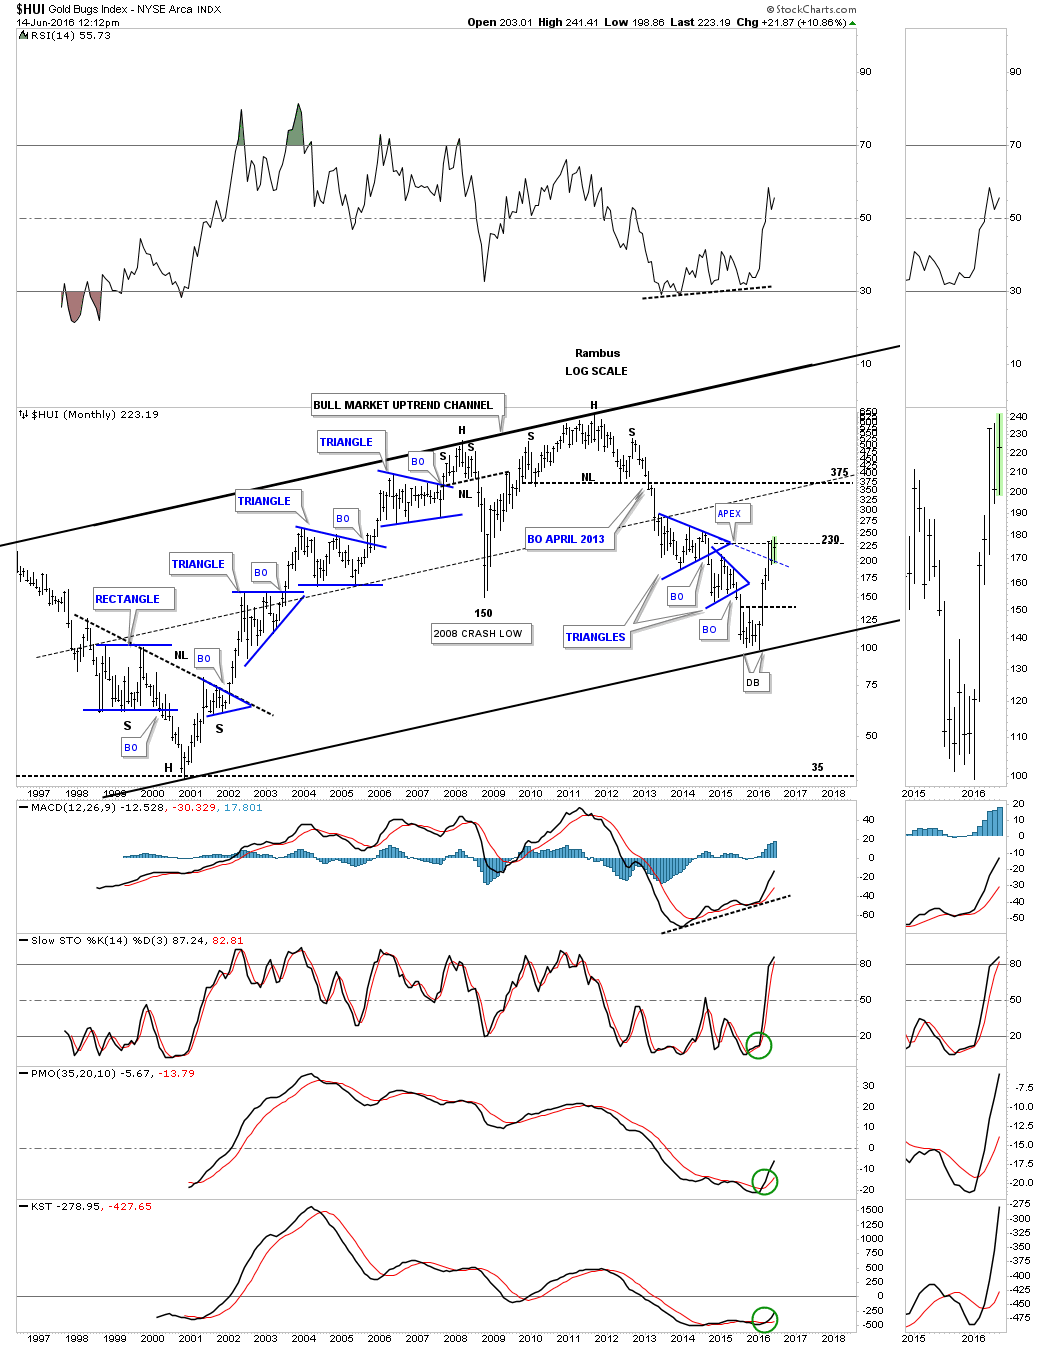
Below is the long term monthly chart for the HUI for perspective. It looks very possible that the HUI may be building out a consolidation pattern between roughly 190 and 235 or so. For those that want to try and trade this consolidation area have some decent lines in the sand in which to place your sell/stop. If you short up here you can use the top of the range at 235 or so to place your sell/stop. You can then take profits at the bottom of the trading range and reverse to the long side just under the 200 area. The main thing is not to get greedy at the bottom. There are no grantees it will play out exactly like this but the trading range looks like it’s still developing which is a good thing in the bigger picture.
This is also a good place to decide if you want to take a few chips off the table up here, as the HUI is only about 12 points or so from its first impulse move high. This has to be a personal choice on how you want to play this new bull market. Probably for most folks it would be wise to hold on for dear life but for some of you, trading these trading ranges may be the way to go. For the time being I’m going hold on to my positions and let the trading range develop further as I know there will be some pain to come. This is my personal choice.