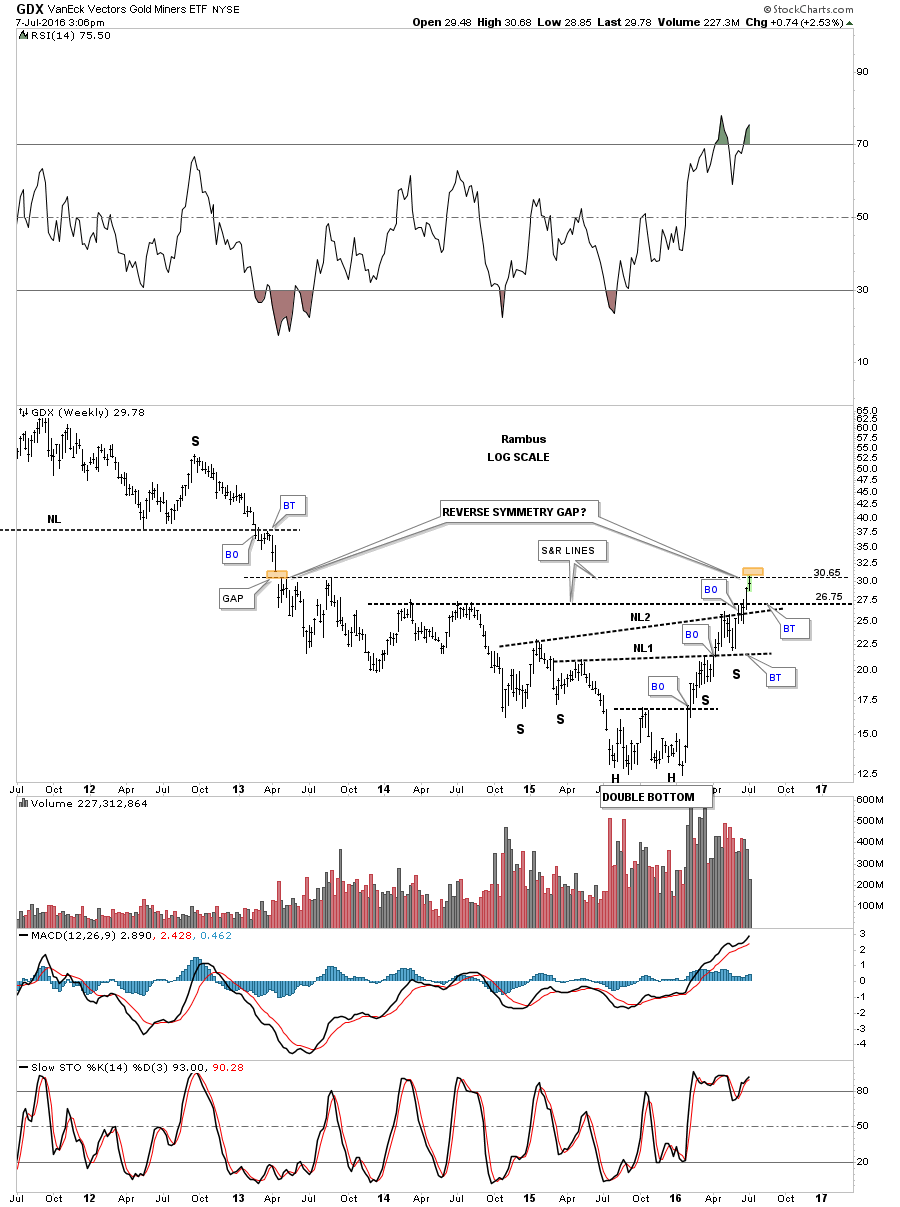
Last week we looked at a weekly chart for the GDX which showed a gap made during the 2013 impulse move down. This week the GDX has finally arrived at the gap area as shown by the two brown shaded rectangles. This is the point where we’ll want to watch how the price action interacts with the gap area. First, the bottom of the gap my hold resistance for awhile and we may see a ping pong move between the bottom of the gap at 30.65 and the horizontal S&R line at the 26.75 area. The other possibility is we may see a reverse symmetry gap over the 2013 gap. Interesting times to say the least.