Several weeks ago we were looking at a couple of consolidation patterns that were forming on some of the PM stock indexes. One was the bullish rising wedge and the other was a H&S consolidation pattern. Below is a daily chart for the HUI which shows the black five point expanding triangle as the bear market reversal pattern. From that reversal pattern the HUI built out its first real consolidation pattern which is the bullish rising wedge. I commented just before the breakout gap of how the battle was shaping up between the bull and the bears at the top rail which had been holding resistance. I mentioned that we would see how strong the bears were by how well they could defend the top rail. We got our answer a day or two later when the price action gapped above the top rail of the bullish rising wedge. Keep in mind these patterns show up in strong trending markets, so it’s something I always look for when I know the move is strong.

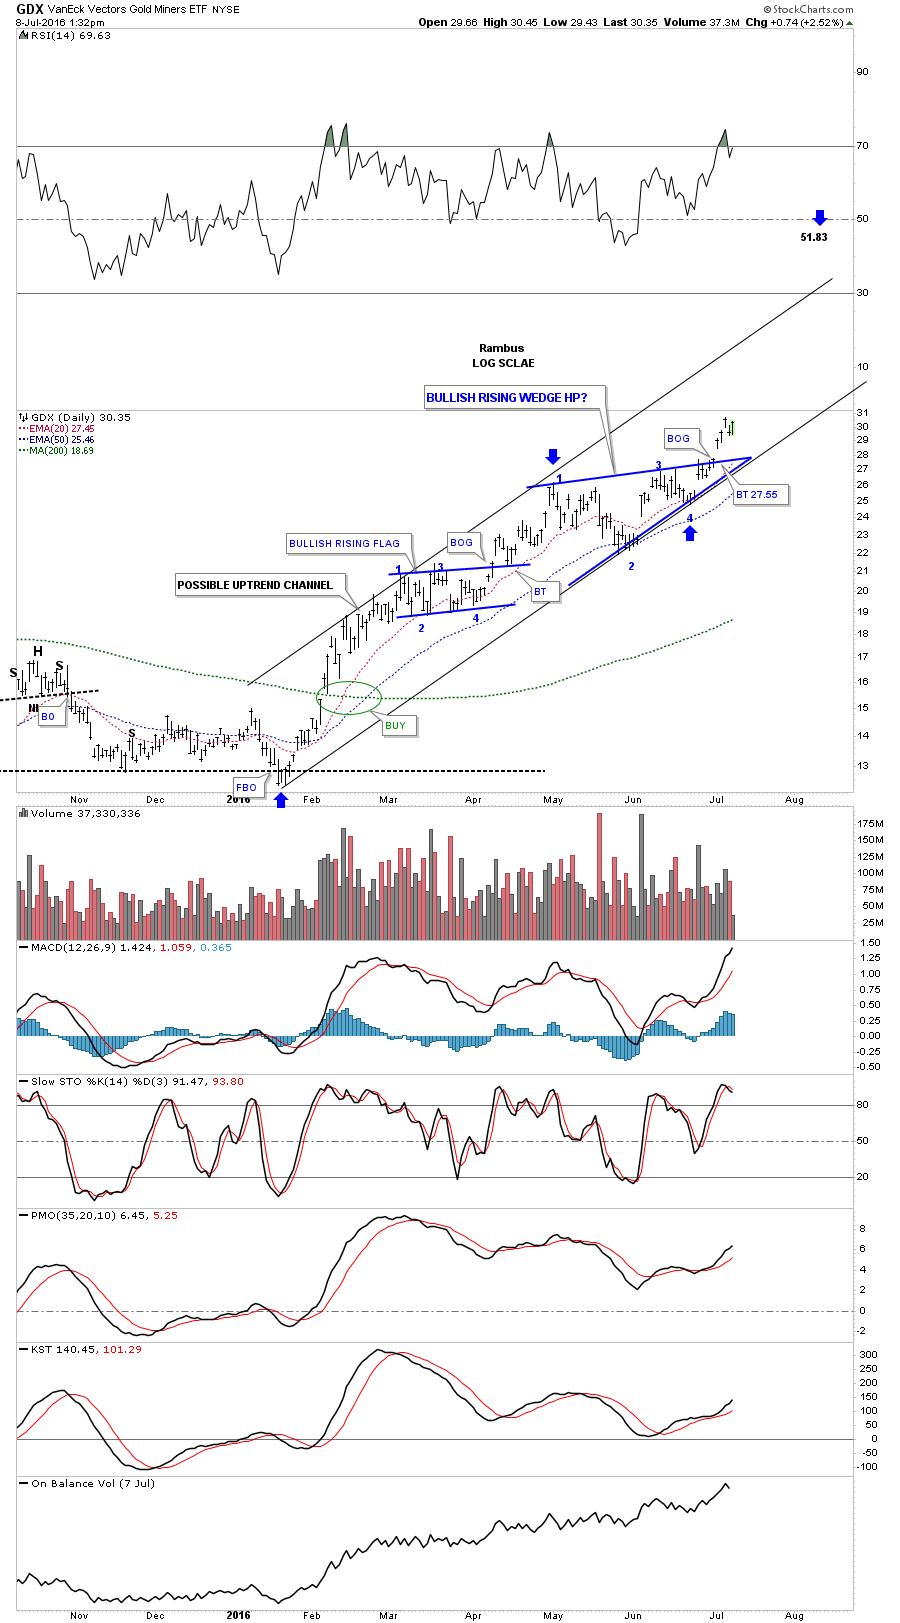
The GDX bullish rising wedge.
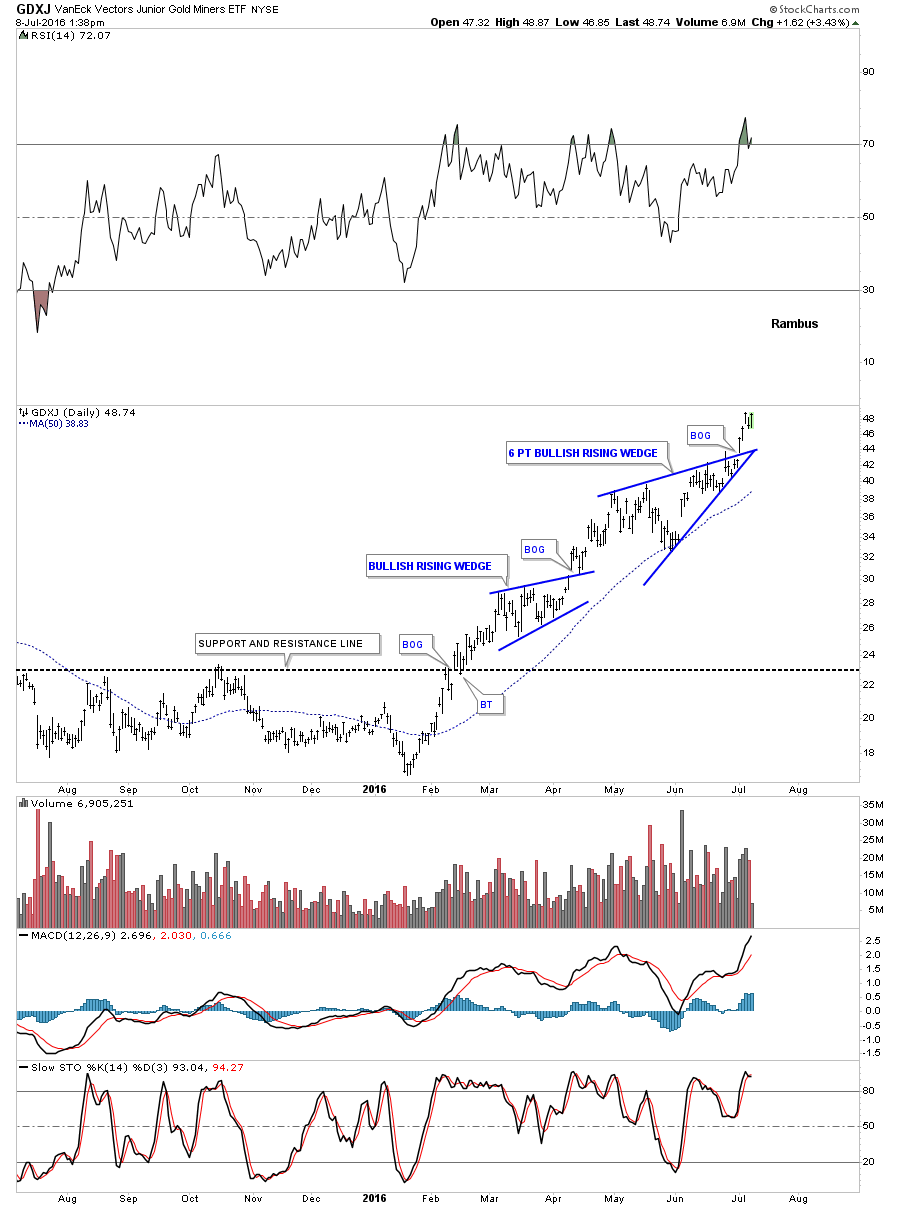
Below is a daily chart for the GDXJ we looked at earlier this week when it gapped above the top rail of its own bullish rising wedge. It has six reversal points instead of four for the other PM stock indexes.
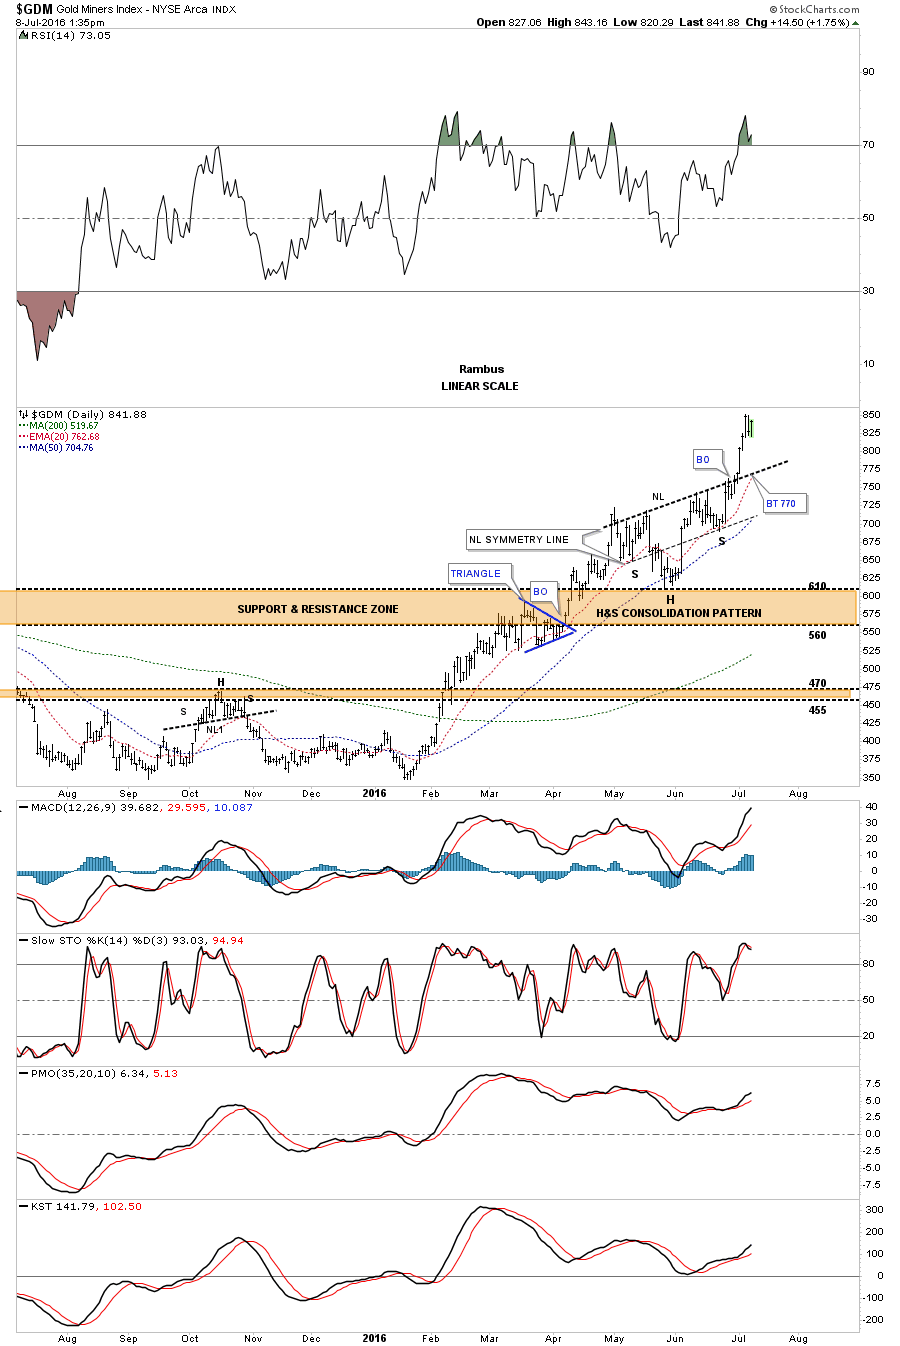
The other consolidation pattern we were looking at was a strongly slanted H&S consolidation pattern as shown on the daily chart for the $GDM. I said it was very symmetrical as the neckline symmetry line was showing the low for both the left and right shoulders. The H&S consolidation pattern also formed on top of the big brown shaded S&R zone which was a very good place to look for support.
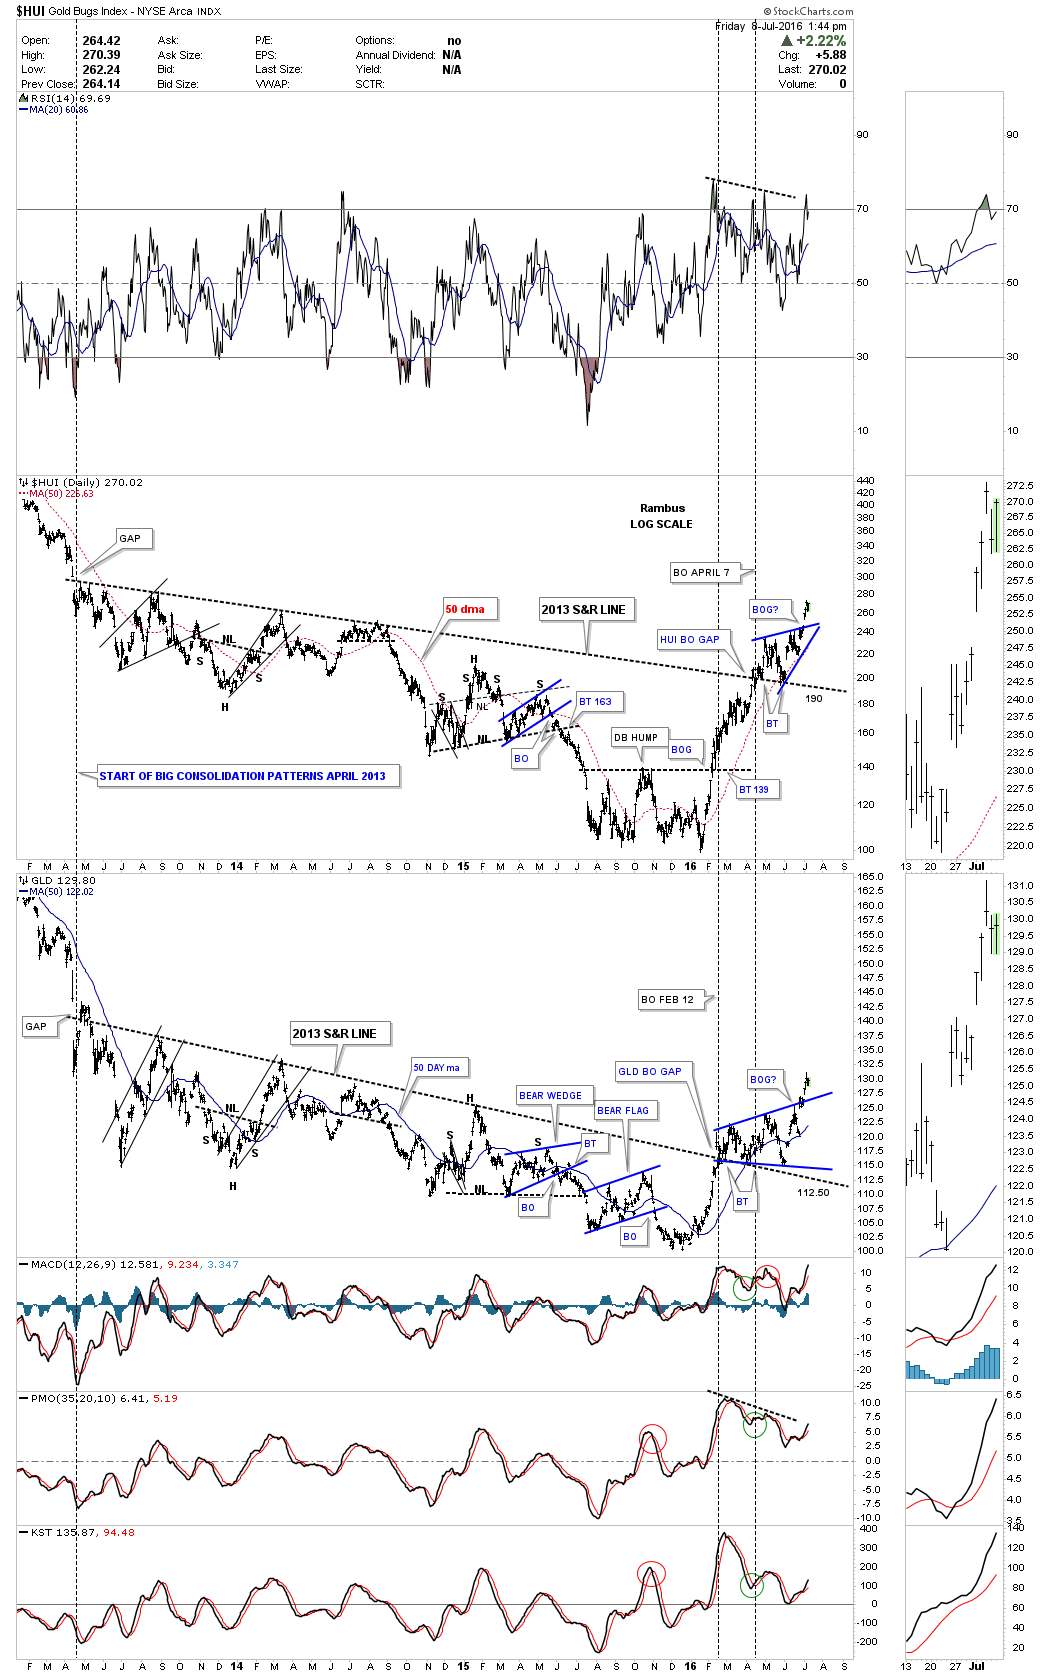
Below is a long term daily combo chart which has the HUI on top and GLD on the bottom. The most important point on this chart is the 2013 S&R line on each chart. You can call the price action below the 2013 S&R line anything you want. What is most important is the breakout gap above that three year S&R line. As you can see the HUI has formed its first consolidation pattern of its new bull market which was the bullish rising wedge. GLD also formed the first consolidation pattern of its new bull market which is a bullish expanding triangle. Note each consolidation pattern shows a breakout gap above the top rail. Maybe we’ll get a backtest to the top blue rails before these two go higher but I wouldn’t count on it as these guys are mean reverting back to some kind of normalcy.