Below is the reverse symmetry chart with the support and resistance lines we’ve been following since the new bull market began. So far the price action has interacted perfectly with each S&R line. The last rally phase took the price action above the highest S&R zone and now is backtesting it from above between 245 and 260. The 50 day moving average has been rising strongly and now comes in at the 234.06 area.

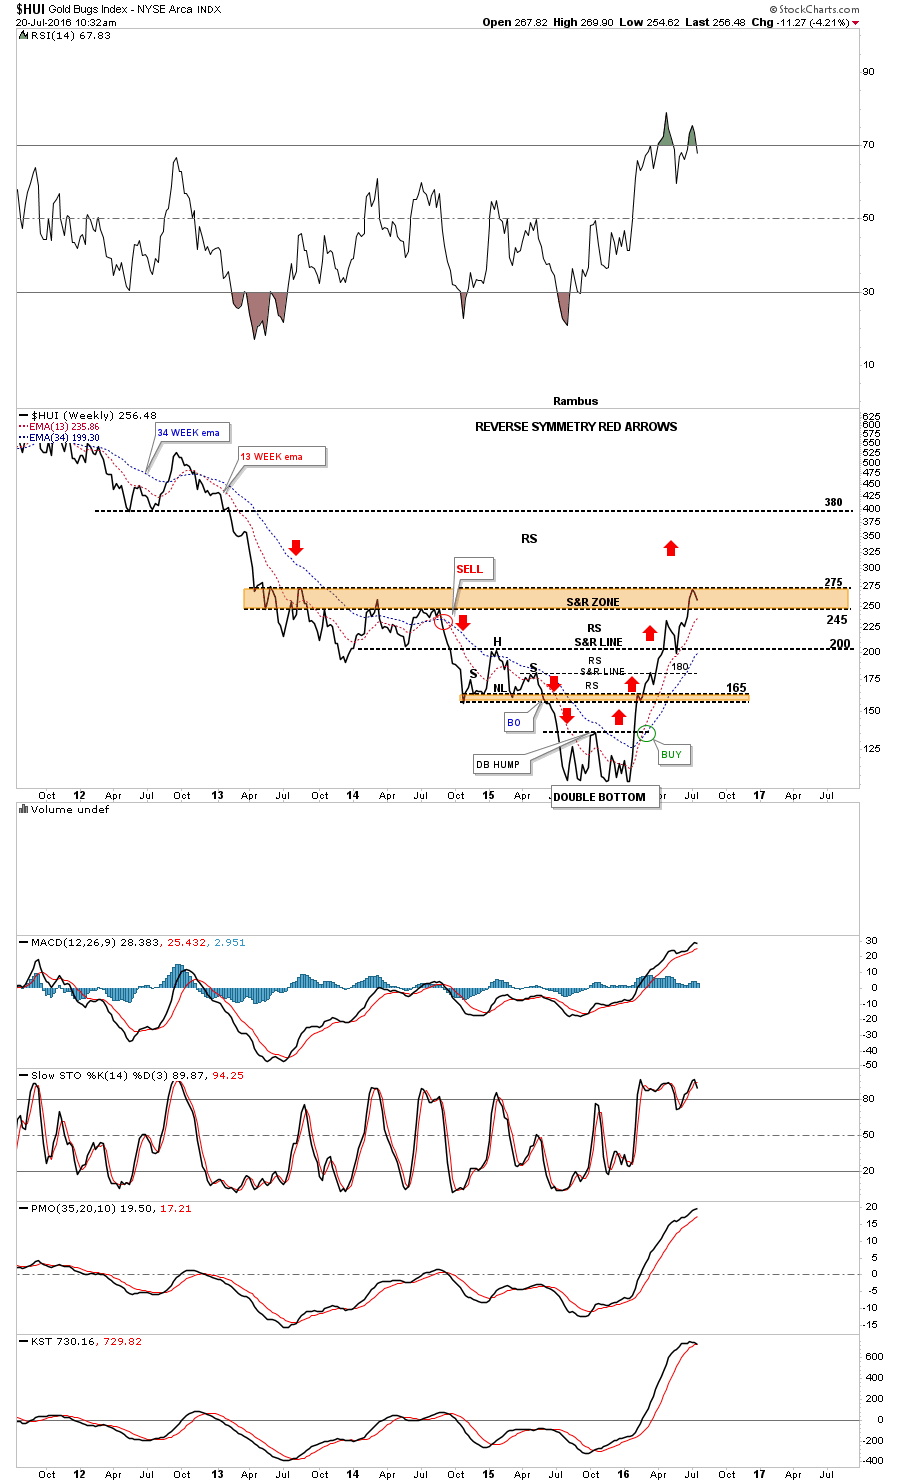
The weekly line chart shows the reverse symmetry and S&R zones. As you can see the HUI made it all the way up to the top of the S&R zone at 275 where we should see it act as initial resistance which it has. The bottom of the brown shaded S&R zone comes in around the 245 area. The bottom of the S&R zone is taken from the highs made back in 2013 and 2014. Once this counter move down is complete and the next move higher begins, the area above the top of the brown shaded S&R zone is called the thin zone in which the price action can move easily threw until it reaches overhead resistance at the old neckline around the 380 area.