
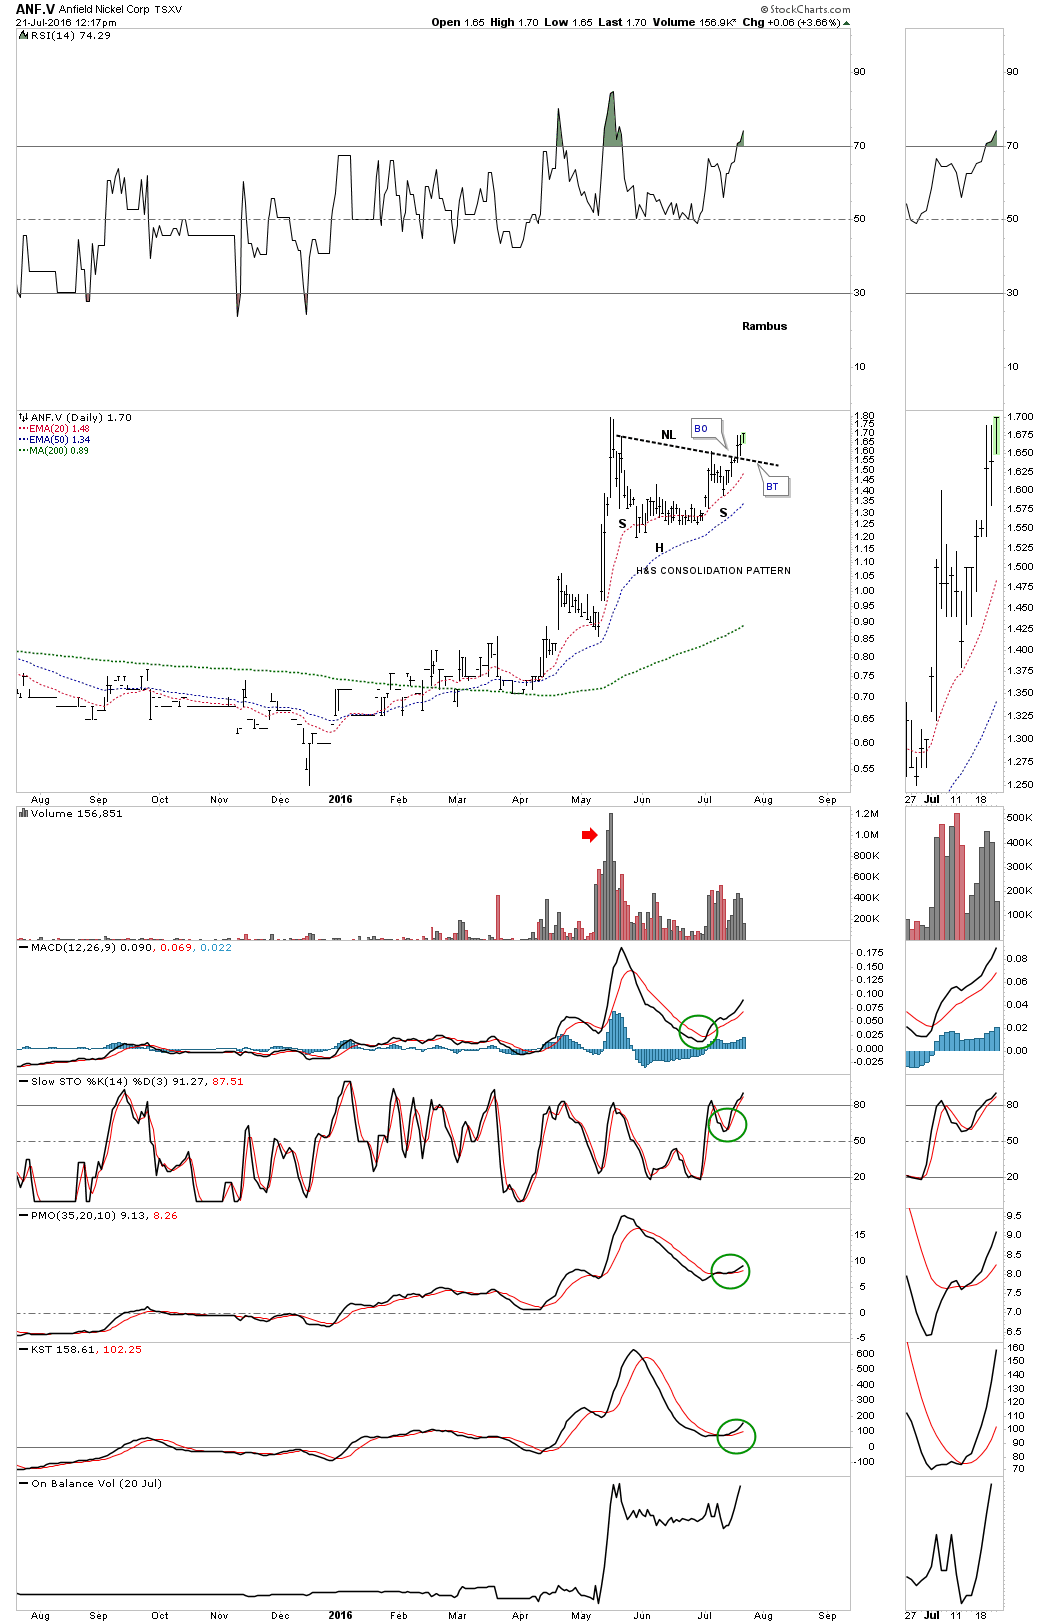
Tuesday of this week ANF.V broke out of H&S consolidation pattern where I took an initial position and bought 3000 shares. The daily chart shows the breakout and backtest holding.
The monthly chart really puts everything in perspective for this stock. The H&S consolidation pattern on the daily chart above is just part of a much bigger inverse H&S bottom on the monthly chart below. You can see the beautiful H&S top which ended the bull market. Big patterns lead to big moves. The H&S bottom is 2 1/2 years in the making with the price action testing the neckline presently. That big H&S bottom is actually bigger than the H&S top and has a price objective up to the old high around the 6.40 area. I’m going to put an order in to buy another 3000 shares at 1.83 which is just above the neckline, on the breakout.
