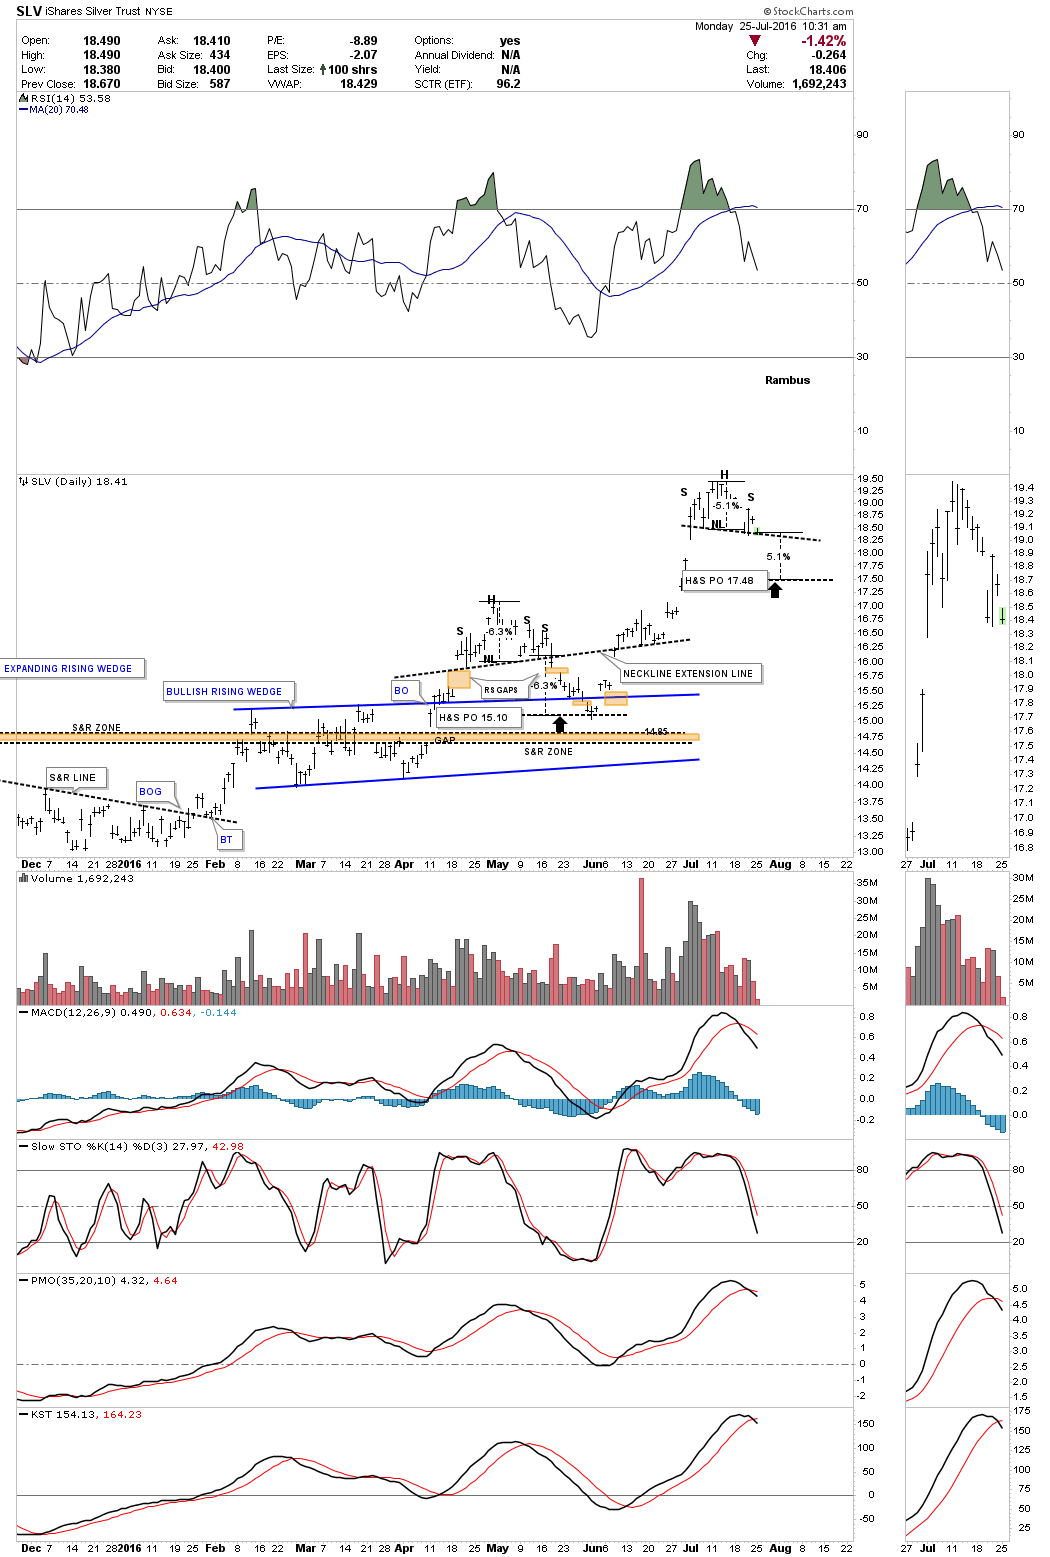
It looks like SLV is forming a small H&S top similar to the one it formed back in May of this year. The minimum price objective for this H&S would be a measured move down to 17.48.
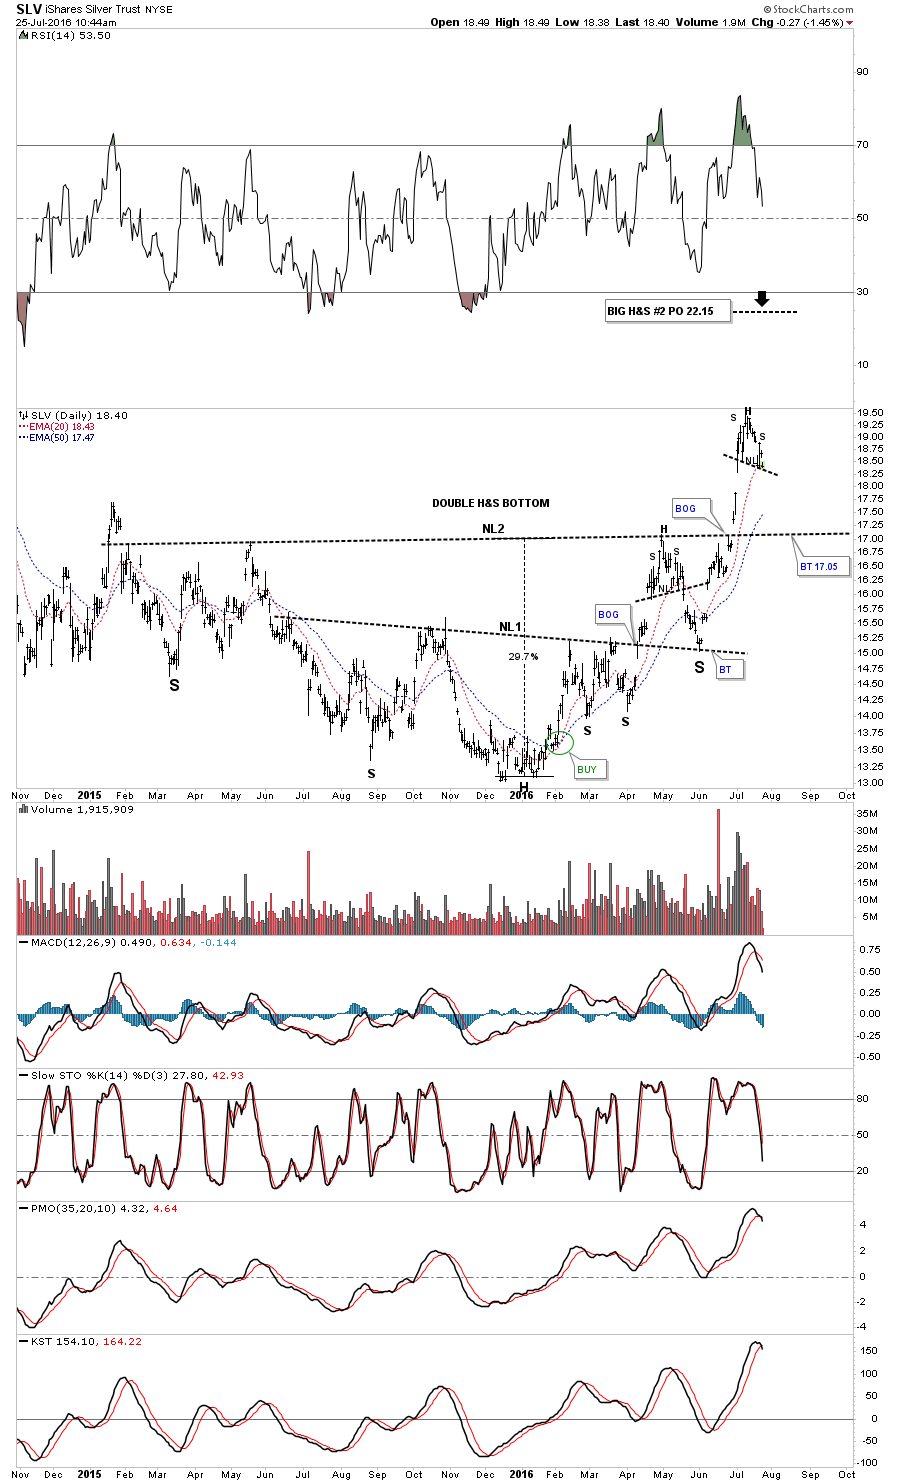
The long term daily chart for SLV shows the big double H&S bottom. Note the small H&S top that formed at the May high which led to the backtest to neckline #1. A backtest to neckline #2 would come in around the 17.05 area. This is where one needs to decide if they want to play the swings or hold on for the intermediate to longer term ride with a portion of your trading capital. SLV has a well defined breakout point and price objective if one chooses to try a short position. Just don’t get greedy.