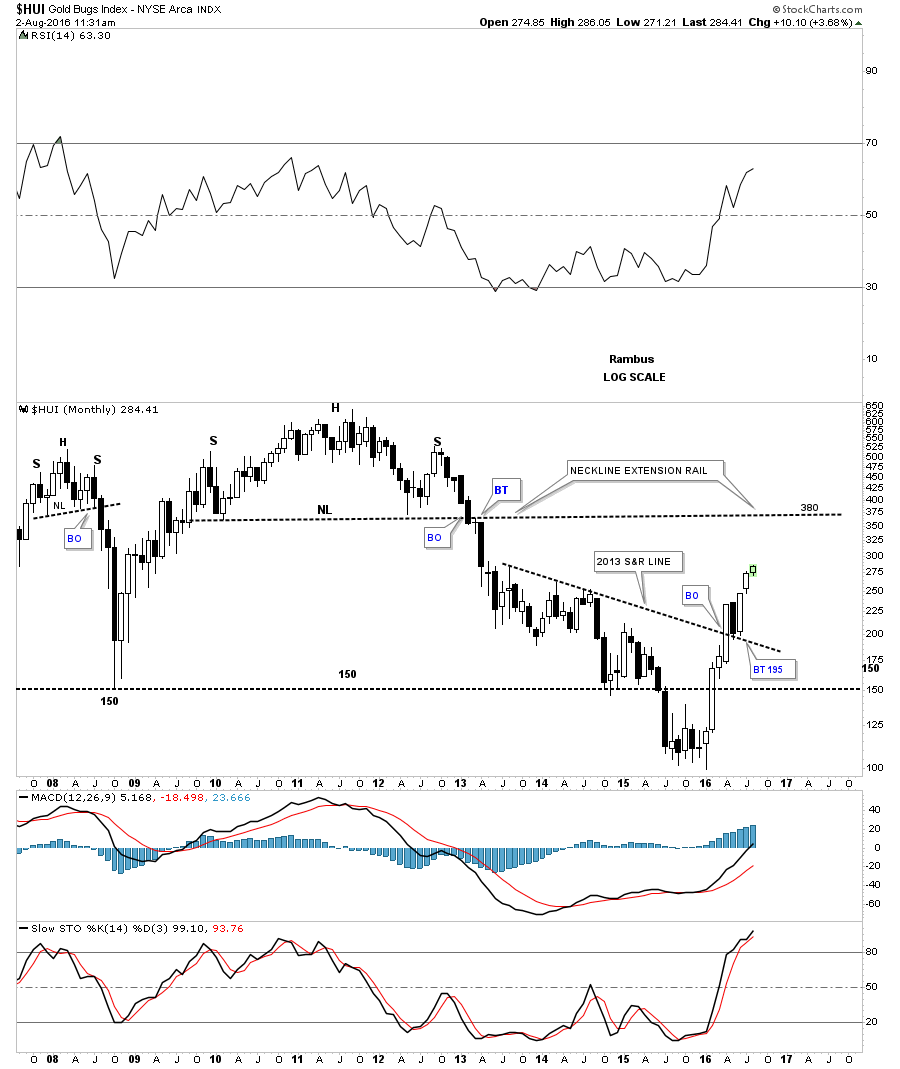
I forgot to add this monthly candlestick chart for the HUI to the post below which shows the 2013 S&R line and the string of white candlesticks that have formed since the bull market began in January of this year. The only candlestick that is black formed during the backtest to the 2013 S&R line. The neckline extension rail is where we may see some overhead resistance come into play. Note the big black candlestick that formed in 2013 when the HUI broke below the neckline of its massive H&S top. Reverse symmetry suggests the HUI may move up over that same area in a strong move to the neckline at 380 or so.