You may have noticed I haven’t posted many short term charts for the PM stock indexes. The reason being most folks tend to start freaking out if the market goes against them for a short period of time. Looking at the longer term charts is much more relaxing and keeps things in perspective.
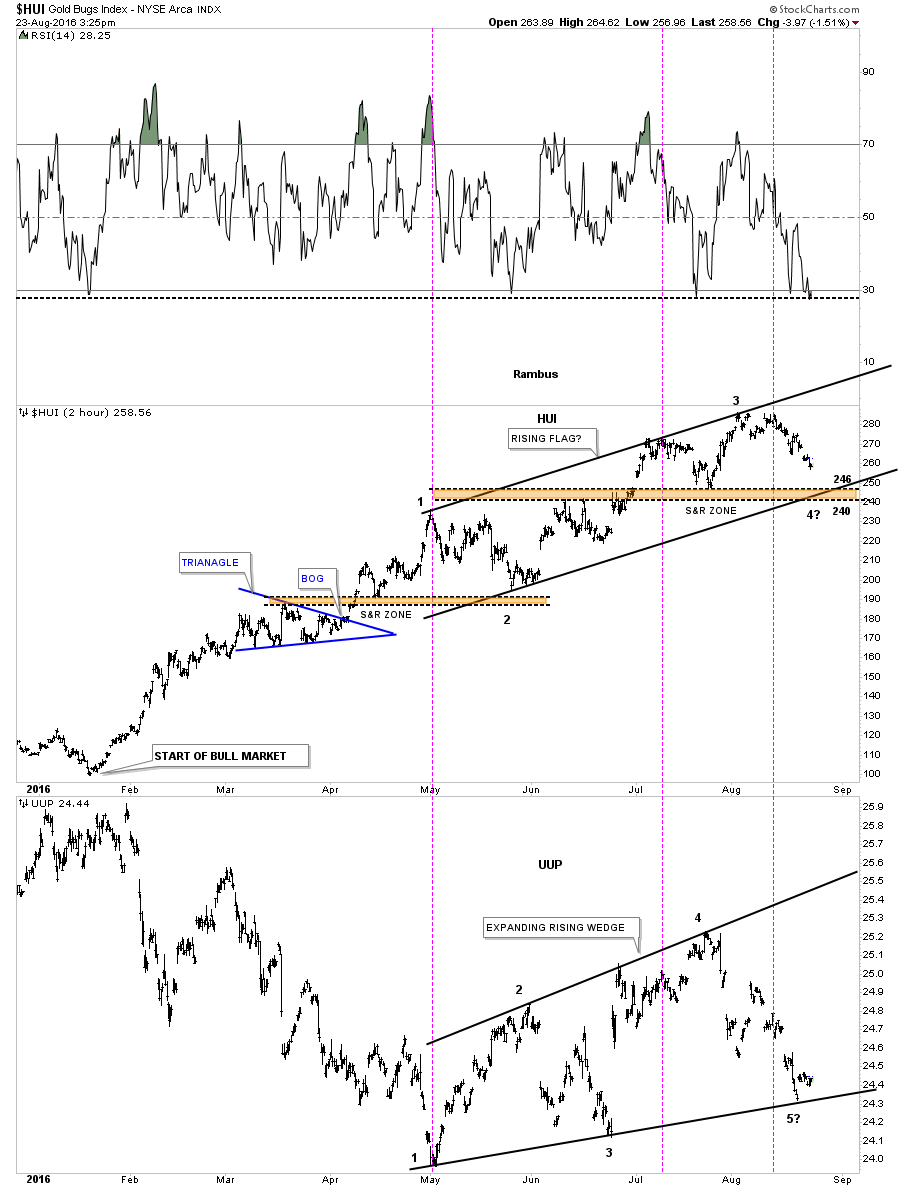
With that said below is a 2 hour chart for the HUI that begins at the start of the bull market at the end of January of this year. Horizontal support and resistance zones are much more important than angled trendlines. The lower brown shaded S&R zone is taken from the triangle high and the first low after the breakout. There was a quick initial backtest to the top of the S&R zone in April which suggested the S&R zone was important. The S&R zone was tested one more time in May when the next leg up began.
We have a similar setup right now on the upper S&R zone which runs between 240 and 246. It was backtested once in June. At this point nothing is broken in regards to the bull market which began in January. The first sign of weakness would be if we see the present S&R zone fail to hold support. That would suggest a deeper correction in the new bull market is probably at hand.