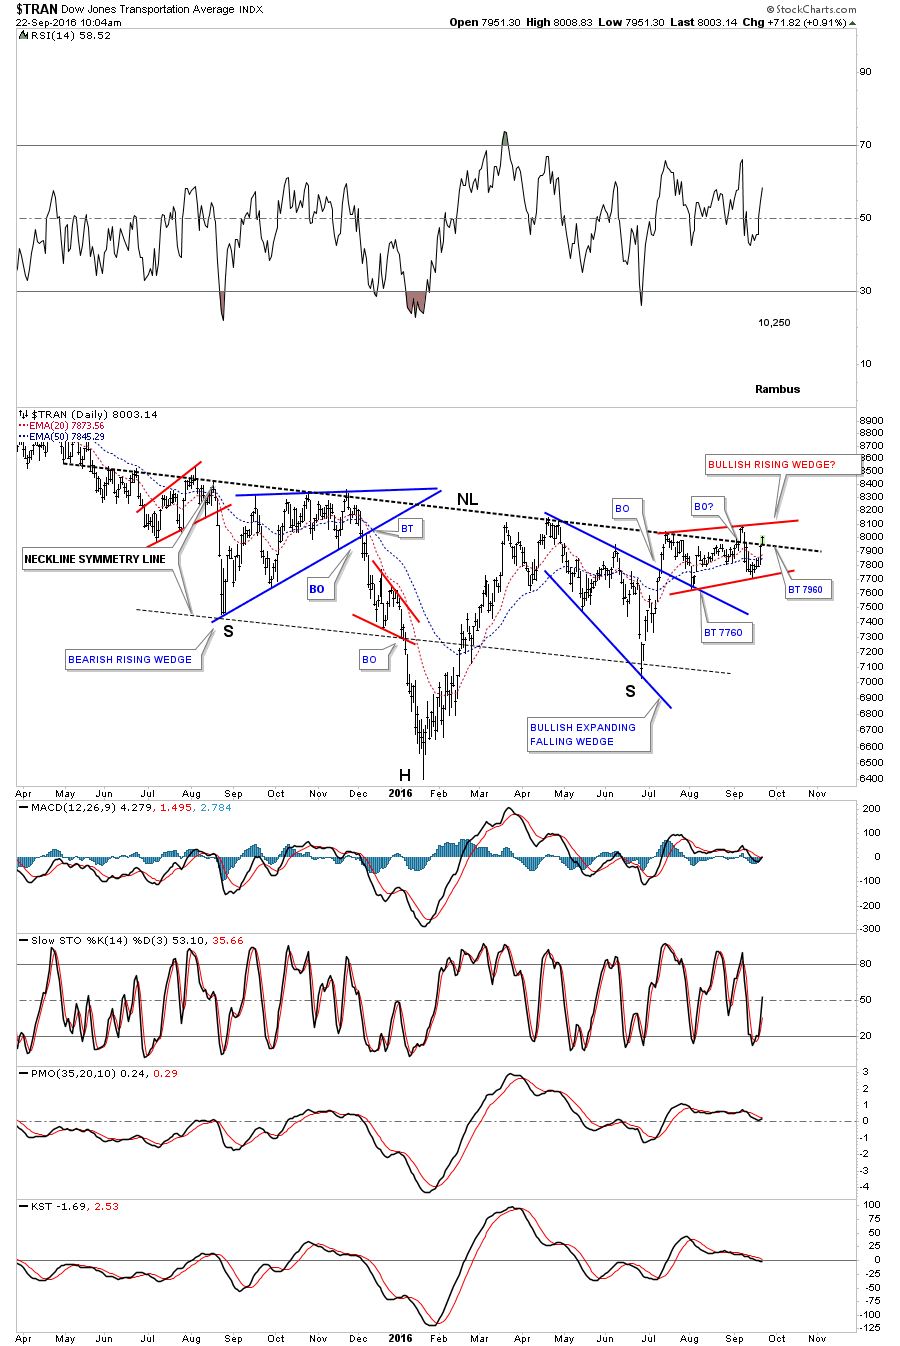
A couple of weeks ago the Transportation Average had a false breakout above the neckline. That false breakout above the neckline is creating another chart pattern which is the red bullish rising wedge. Many times this is a very bullish setup.
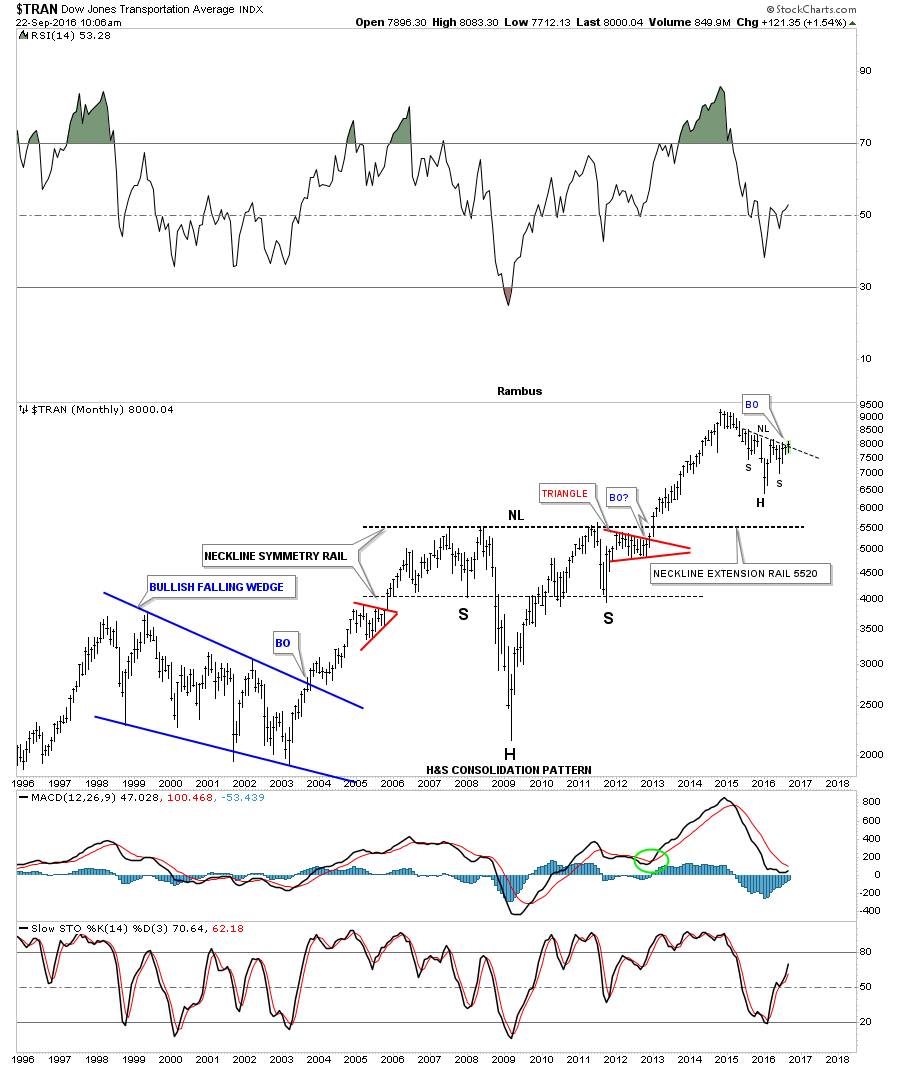
The Transportation Average has been lagging the rest of the stock markets but with this huge H&S bottom in place this was one of the last pieces of the puzzle I was looking for to help confirm the next important impulse move up in the stock markets. Note how beautiful the symmetry is.
The weekly chart showing the H&S bottom.

The monthly for perspective.
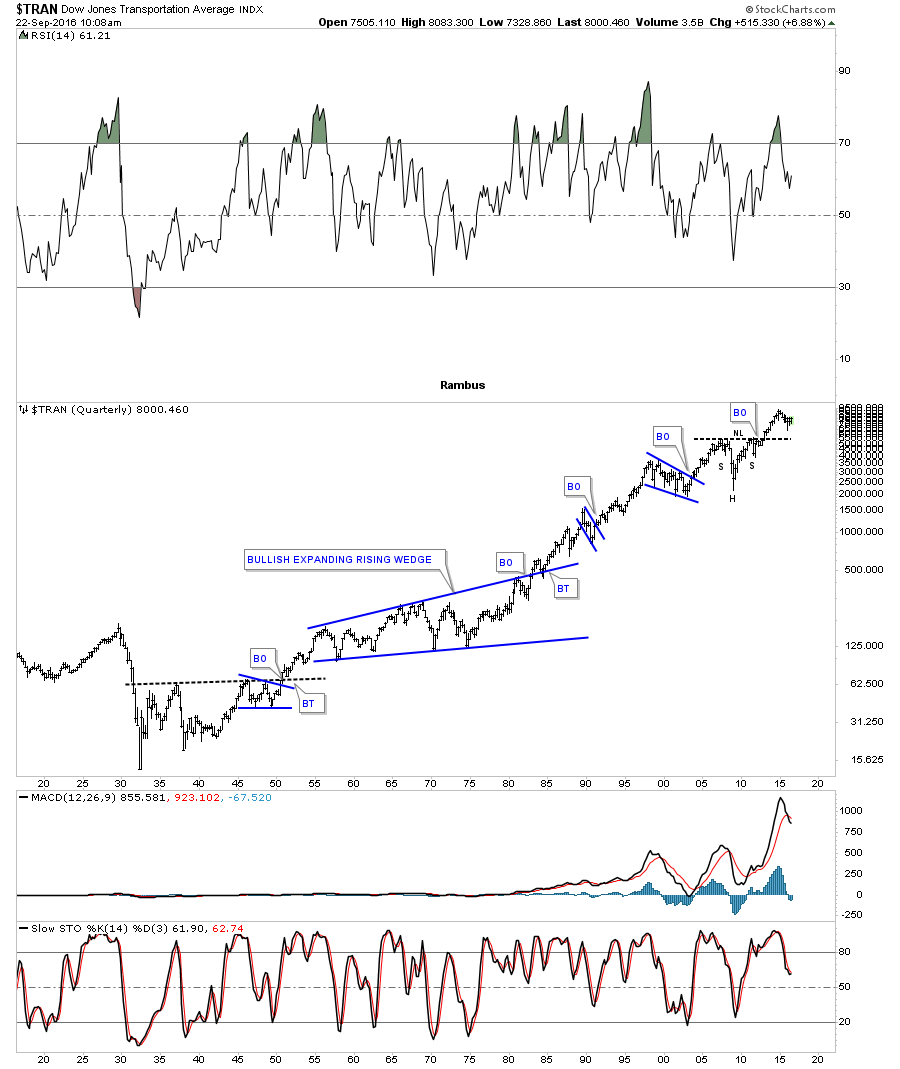
The 100 year quarterly: