The GLD has finally arrived to the big gap area made on the way down. This morning it officially closed the gap at 115. Now we see what happens.

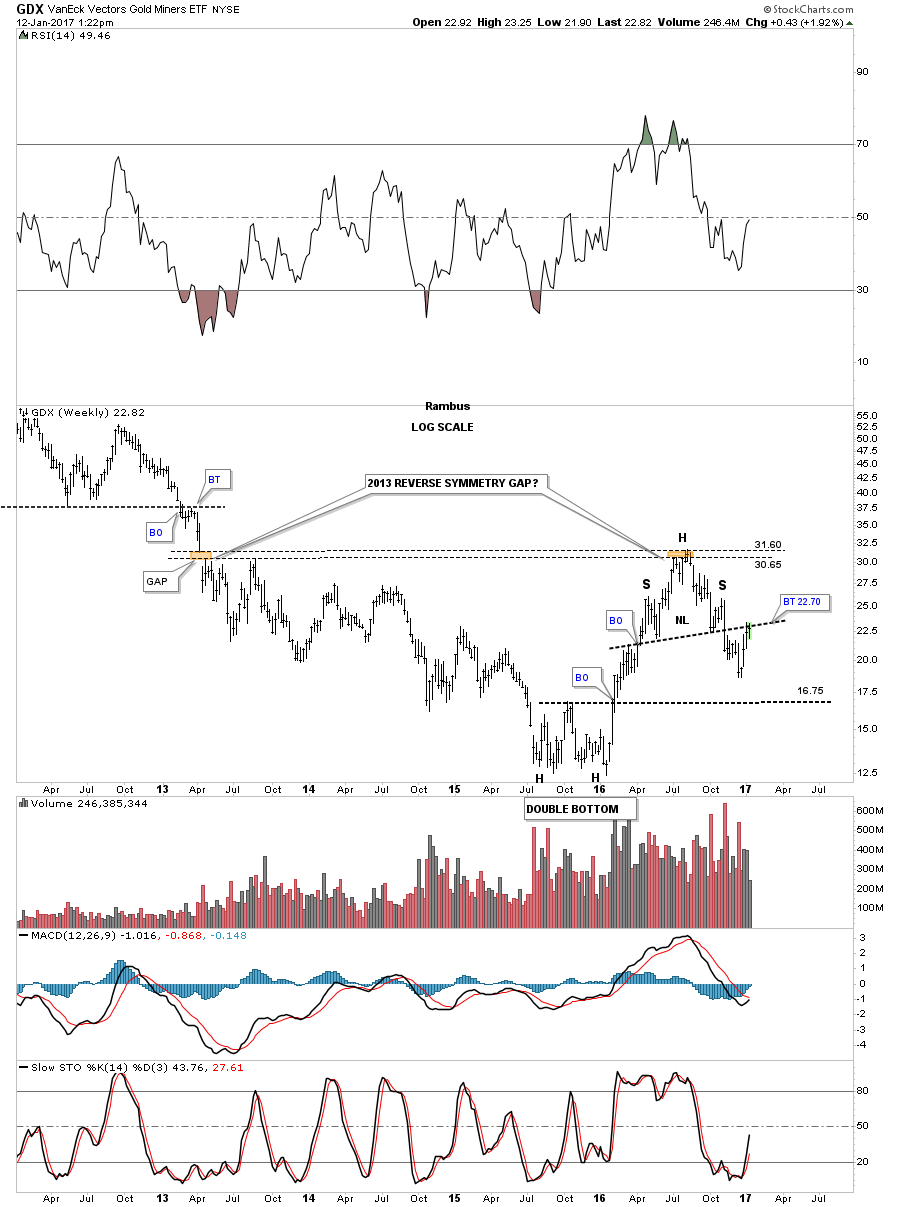
Below is a five year weekly chart for the GDX which shows the reverse symmetry gap made back in 2013. If you recall I was speculating at the time on what would we see when the GDX traded back up to the gap area last summer. Would the price action gap over it and just keep going up or would it hold resistance, or just bounce around for awhile and then take it out? The gap area held resistance for about six weeks before the bulls gave up and the GDX began the correction.