
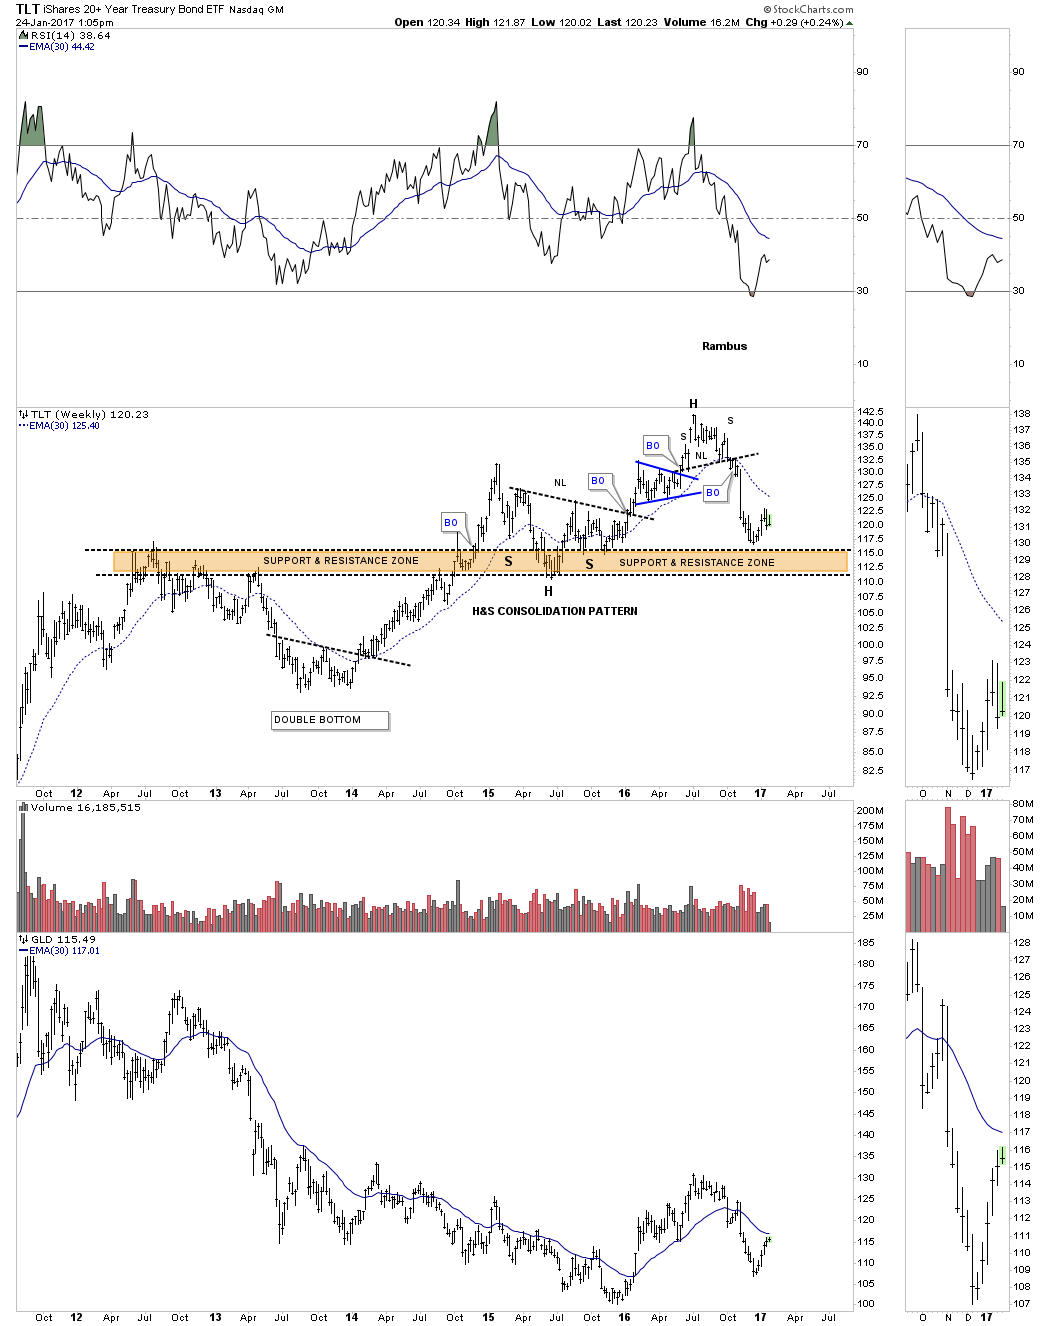
Lets start by looking at a weekly chart for TLT, 20 year bond etf, which shows it built out a H&S top last summer. That H&S top is a reversal pattern that showed up at the end of its bull market which has been ongoing for many years. There is a big brown shaded support and resistance zone that has been offering support.
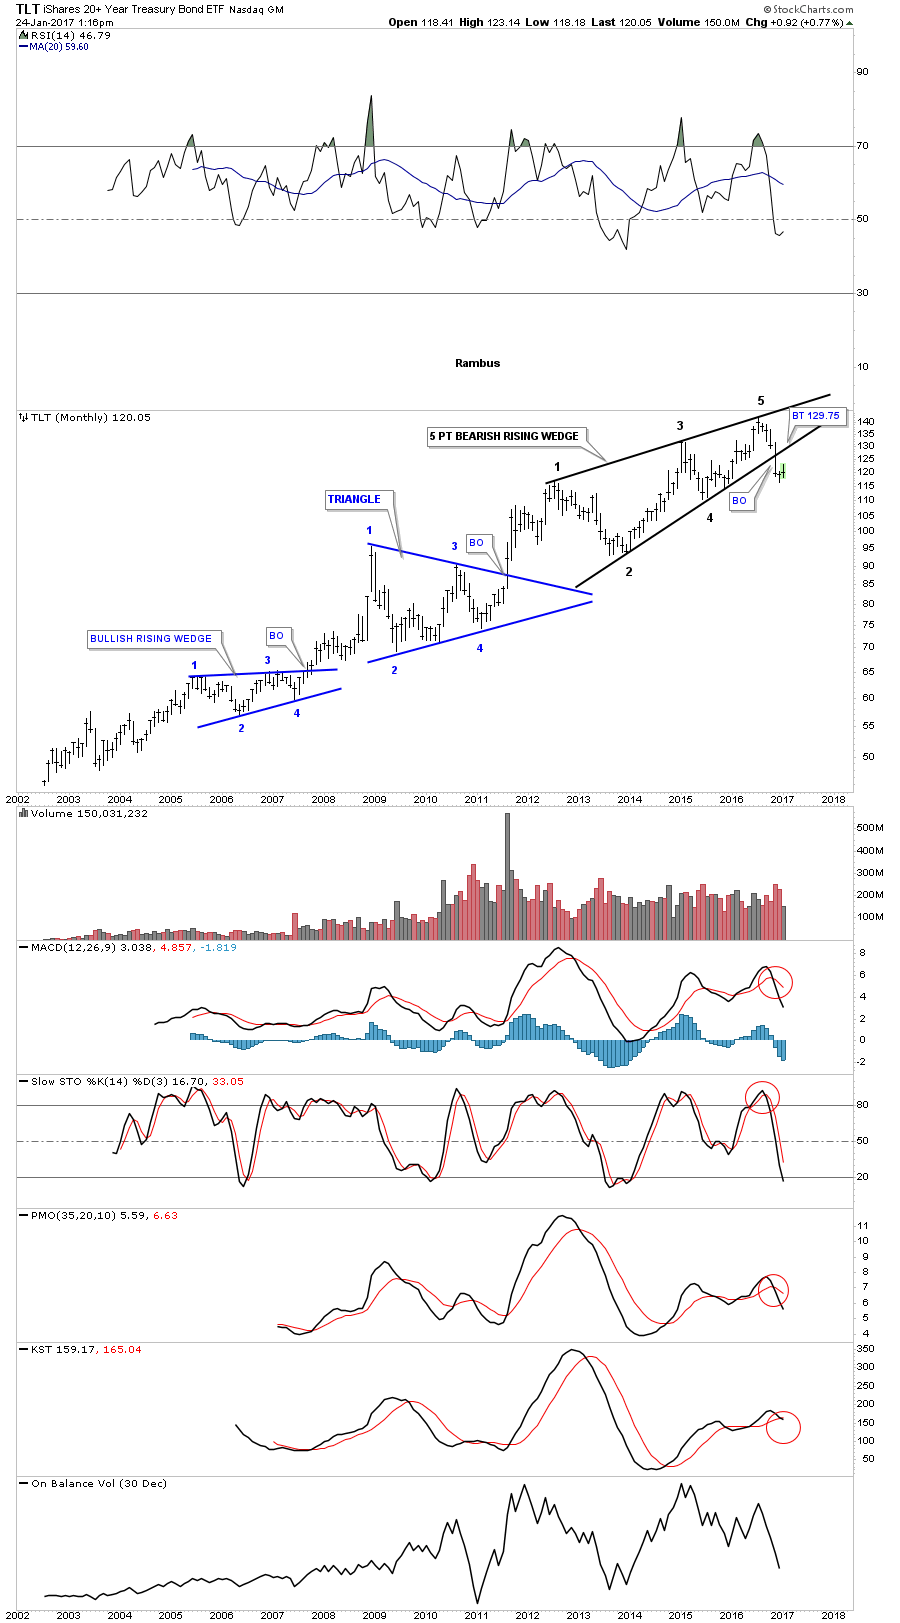
This next chart is a 15 year monthly look at the TLT which shows it has built out a four year 5 point bearish rising wedge which broke to the downside in November of last year. If there is a backtest it would come in around the 129.75 area.
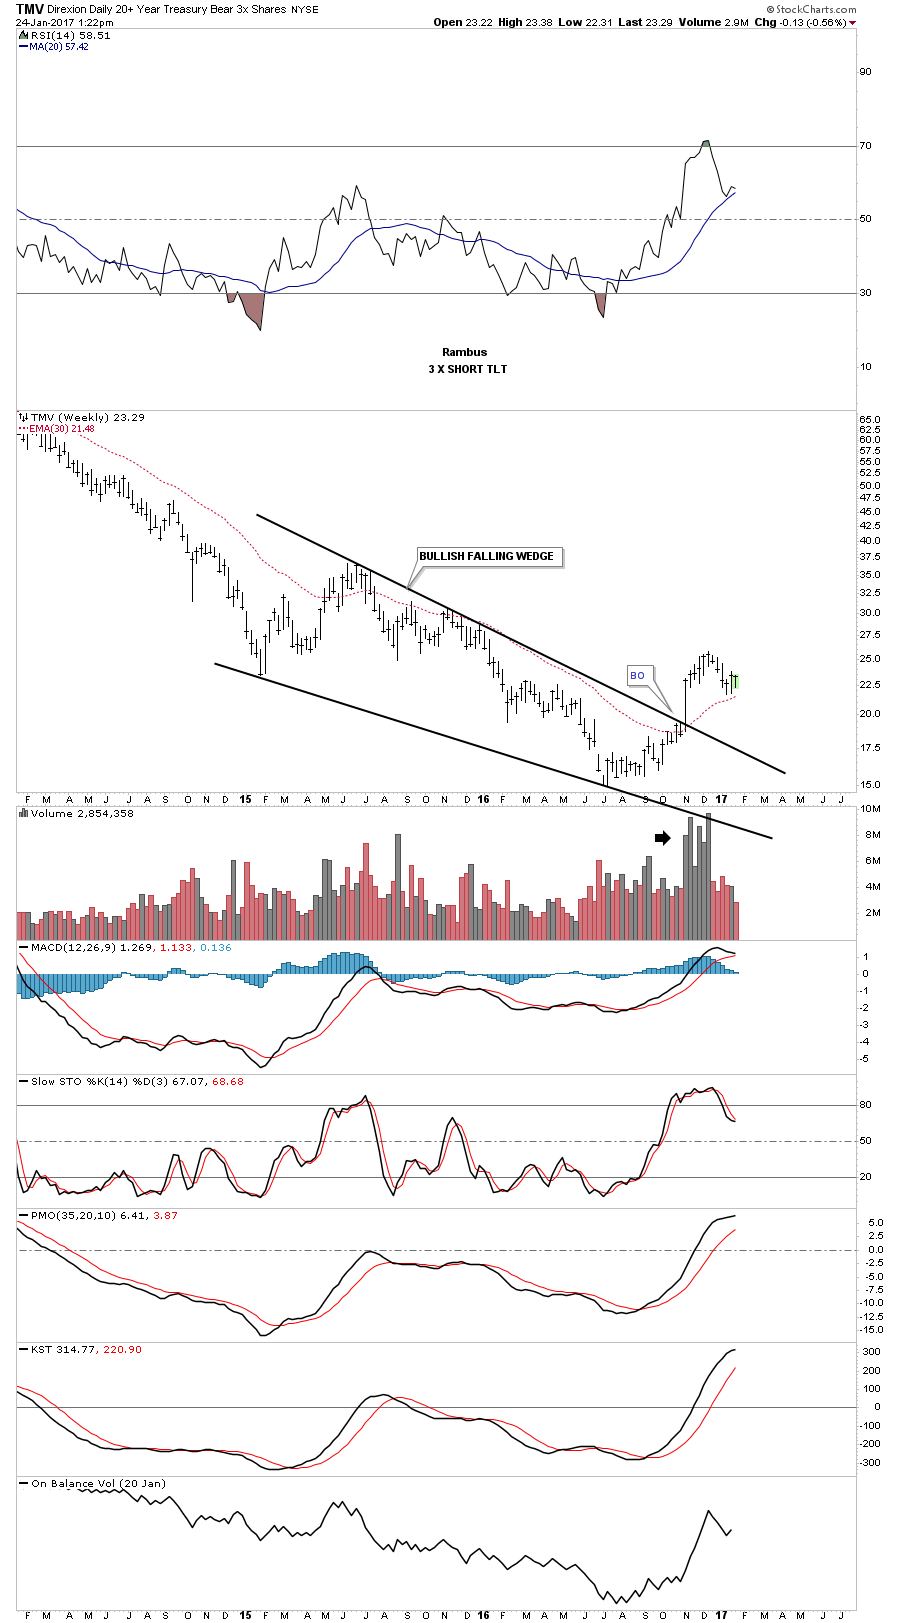
TMV is a 3 X short the TLT.
This last chart is a combo chart which has the TLT on top and GLD on the bottom. It’s not a perfect correlation by any means but these two have been moving together pretty consistently over the last year or so. GLD is currently backtesting its neckline and a support and resistance line going back a year and a half or so. If GLD can trade back above the neckline and the S&R line the bulls will be talking to us. To say this is a critical area for GLD is an understatement. Definitely an area to keep a close eye on.
