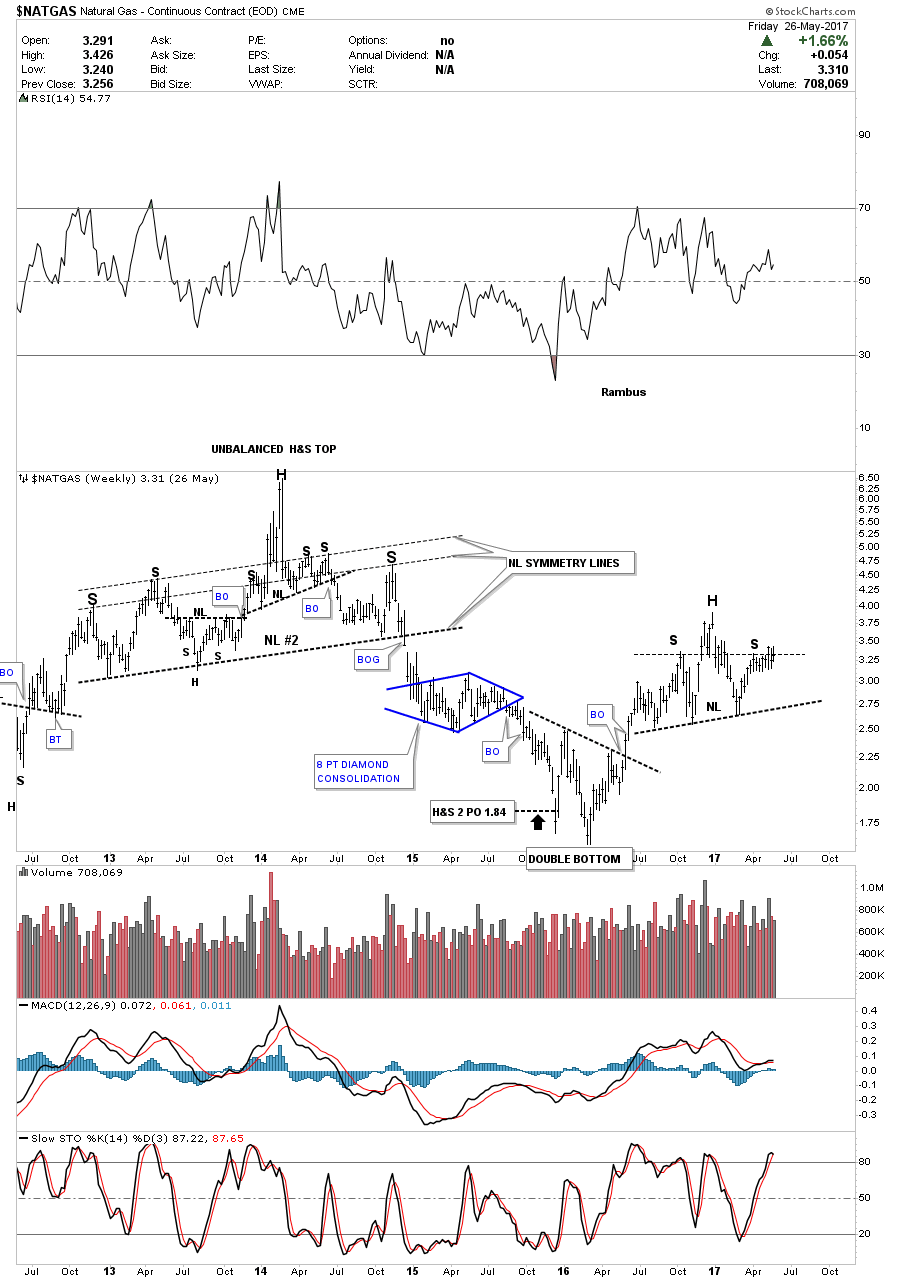
It looks like natural gas is finally showing its hand. Below is a weekly chart for $NATGAS which has built out a H&S top with the horizontal thin black dashed line showing the high for the right shoulder which is taken from the high of the left shoulder. As this is an end of day chart today’s price action isn’t on this chart yet which is about 4% below last Thursday’s high.
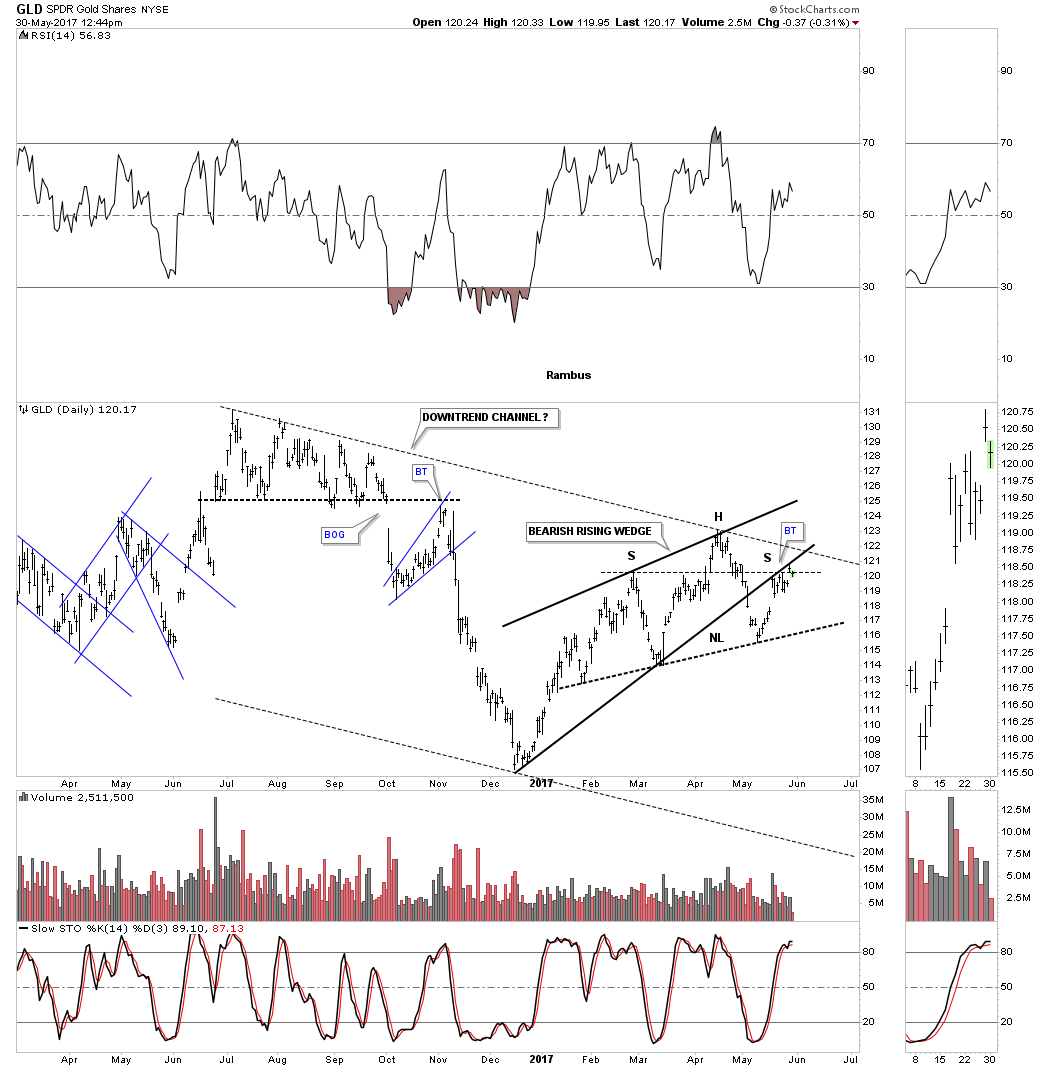
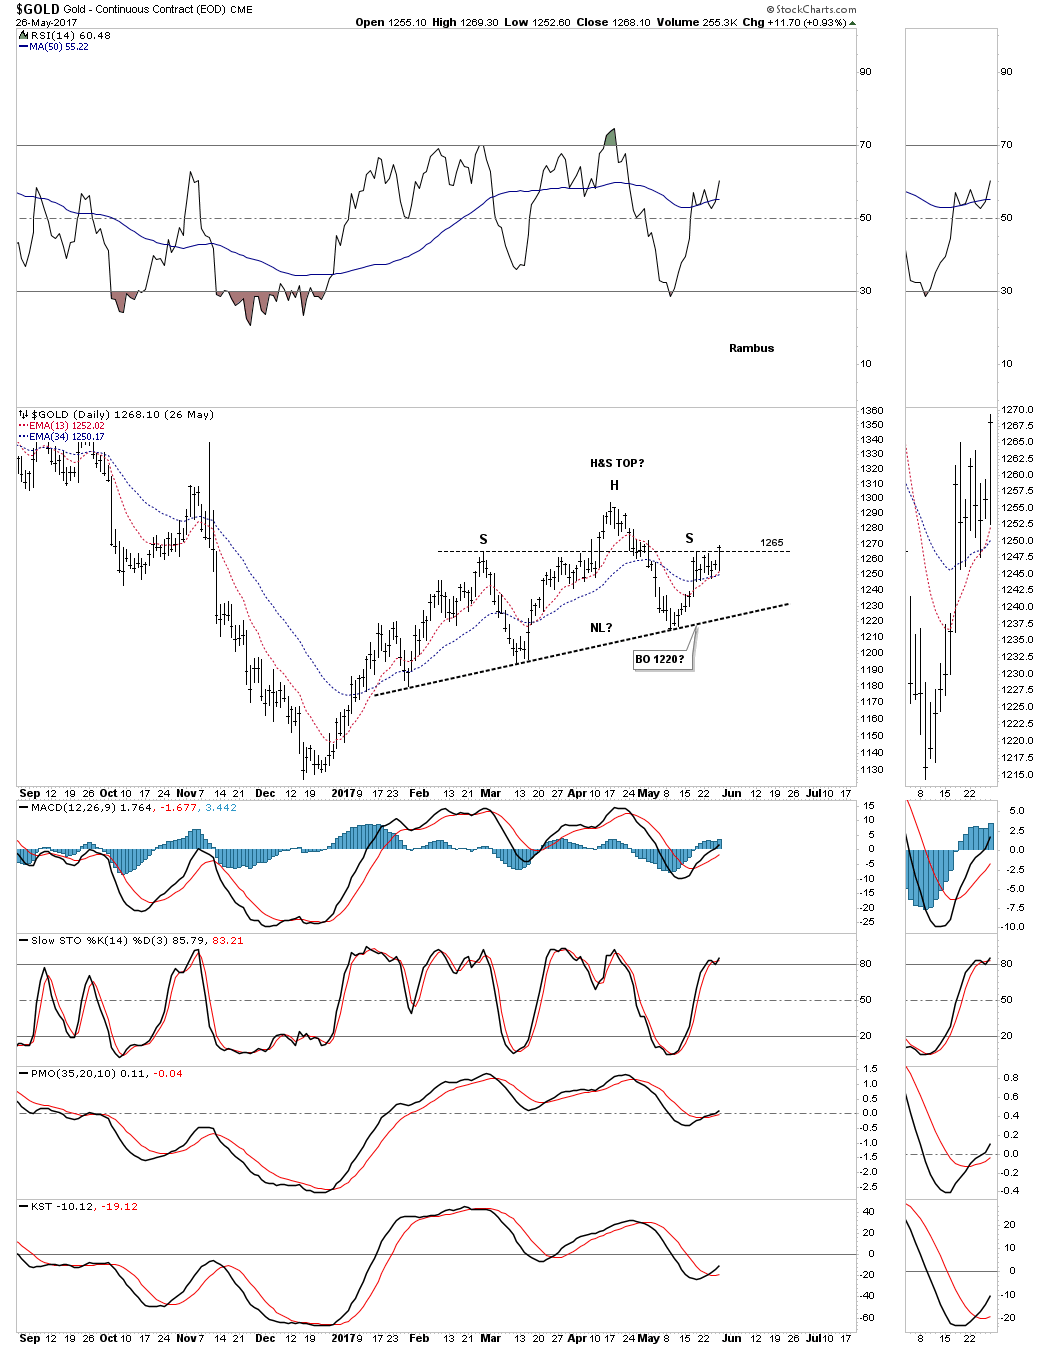
Last week I showed you this potential H&S top forming on gold which was showing the horizontal thin dashed black line showing the high for the right shoulder around the 1265 area which is the same setup on the natural gas chart above.
Below is a daily chart for GLD which shows the left shoulder and head forming inside the rising wedge with the possible right shoulder forming on the backtest to the underside of the bottom rail of the rising wedge. The horizontal line taken from the top of the left shoulder is also in play in this area. To say this is a critically area for GLD is an understatement.