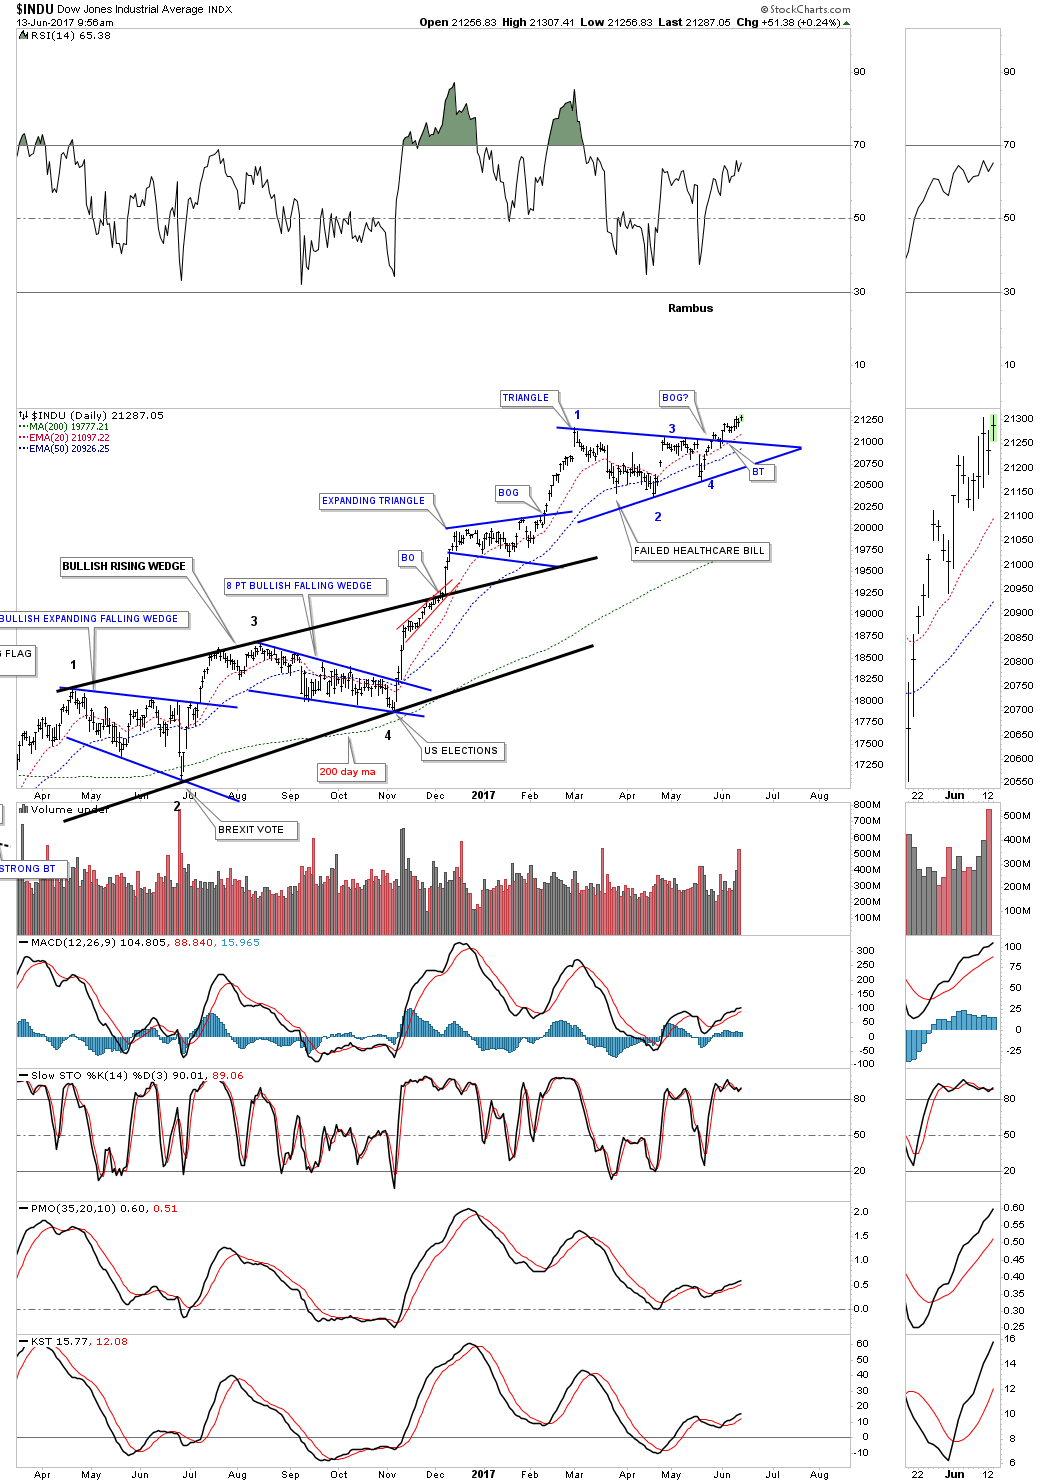
This first chart is a 2 hour look at the INDU which broke out of a blue triangle consolidation pattern in late May with a breakout gap and backtest. Today the INDU is testing its all time highs.
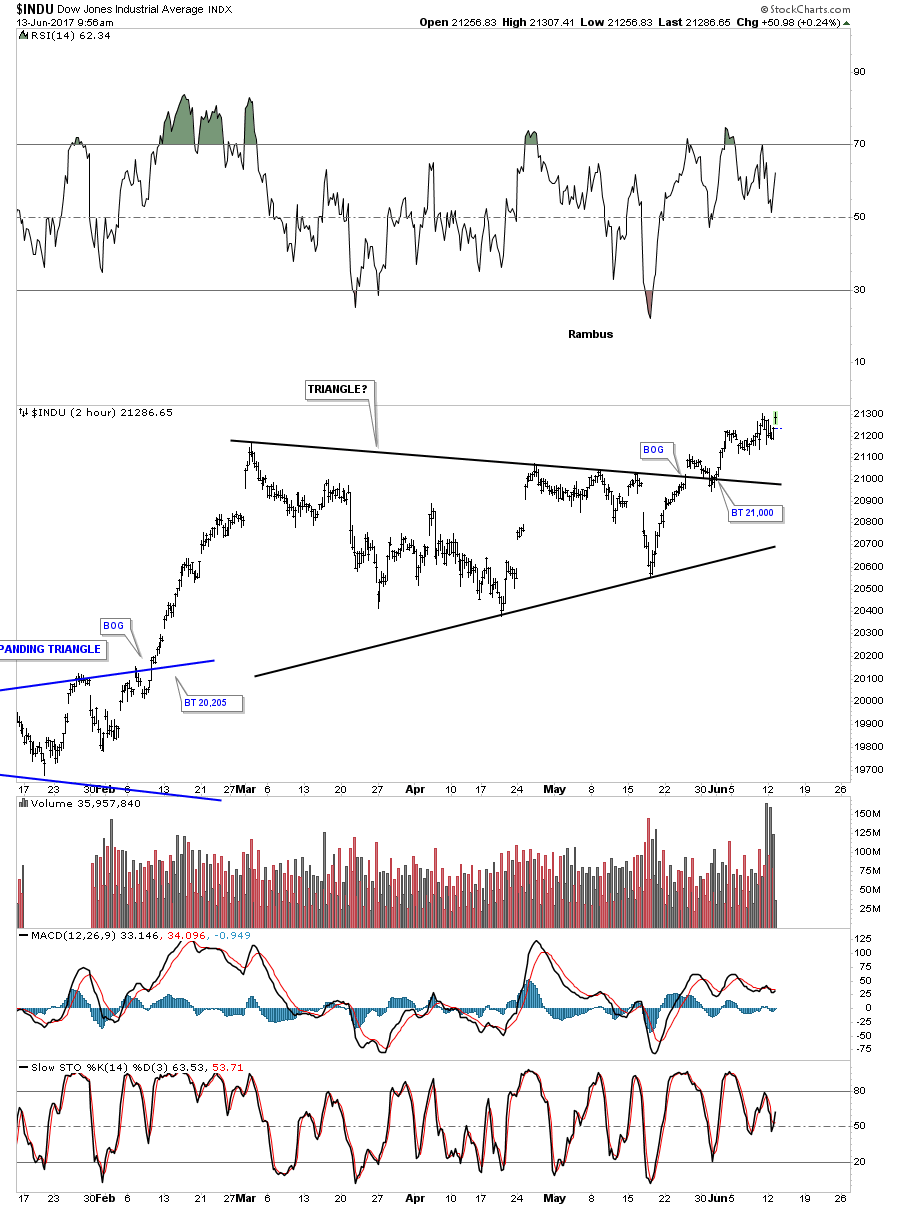
As long as the top rail of the triangle consolidation pattern holds support the impulse move should continue.
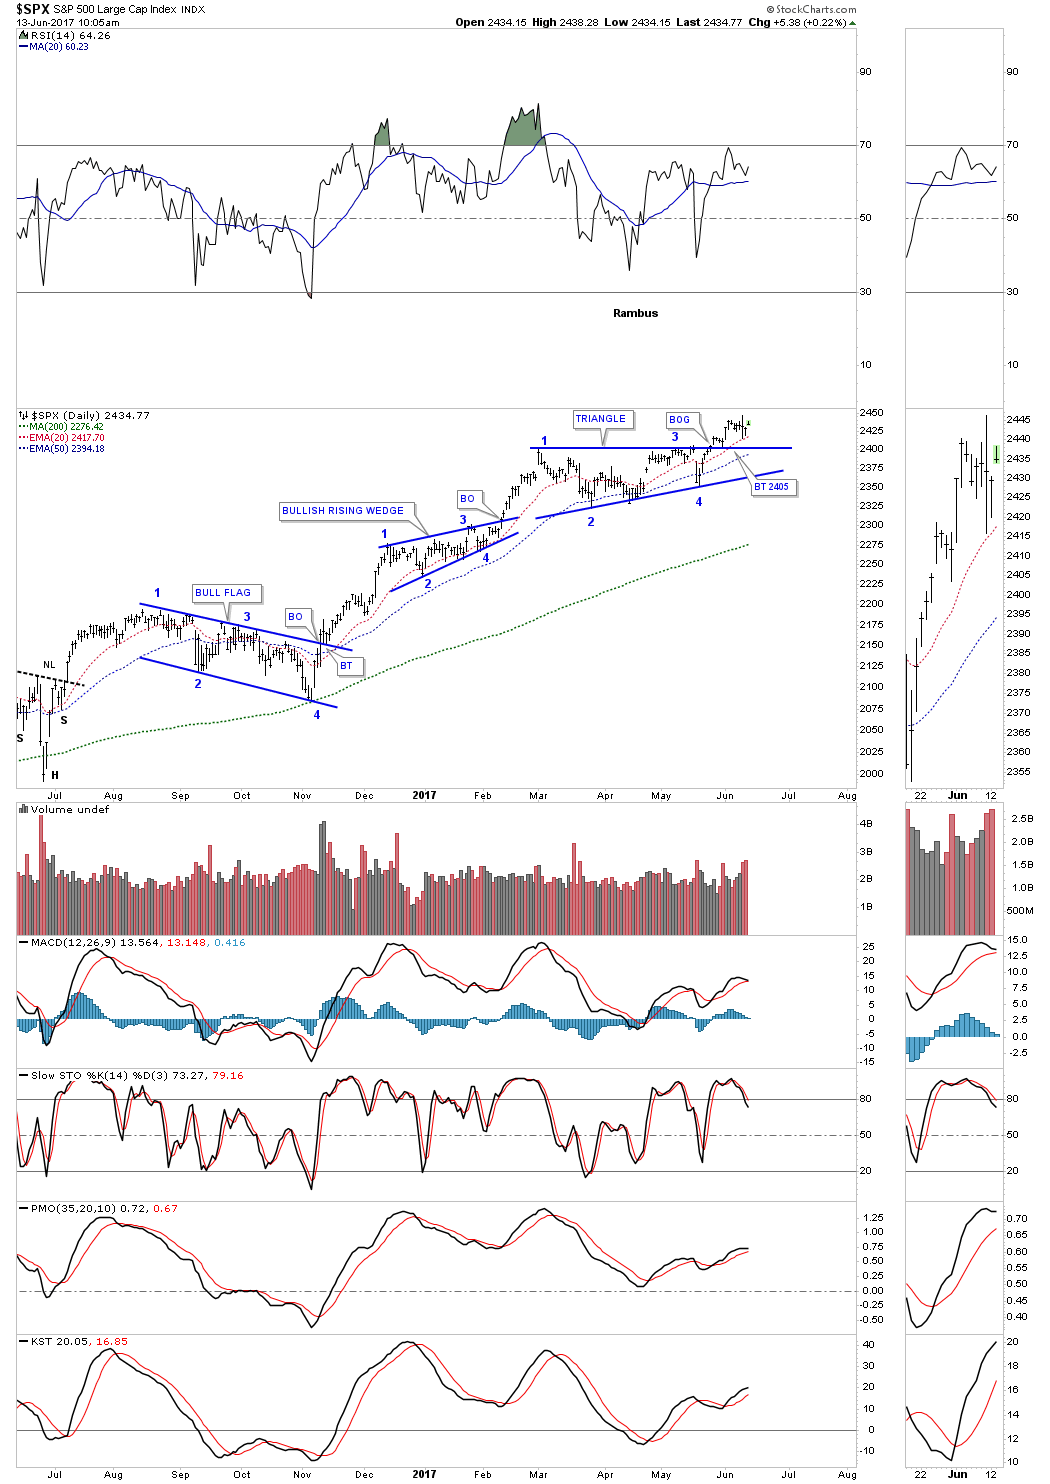
The SPX shows the breakout from its triangle consolidation pattern in late May. Support continues to be around the 2400 area. Short term traders need to watch the 20 day ema or the 50 day ema as a place to set your sell/stops.
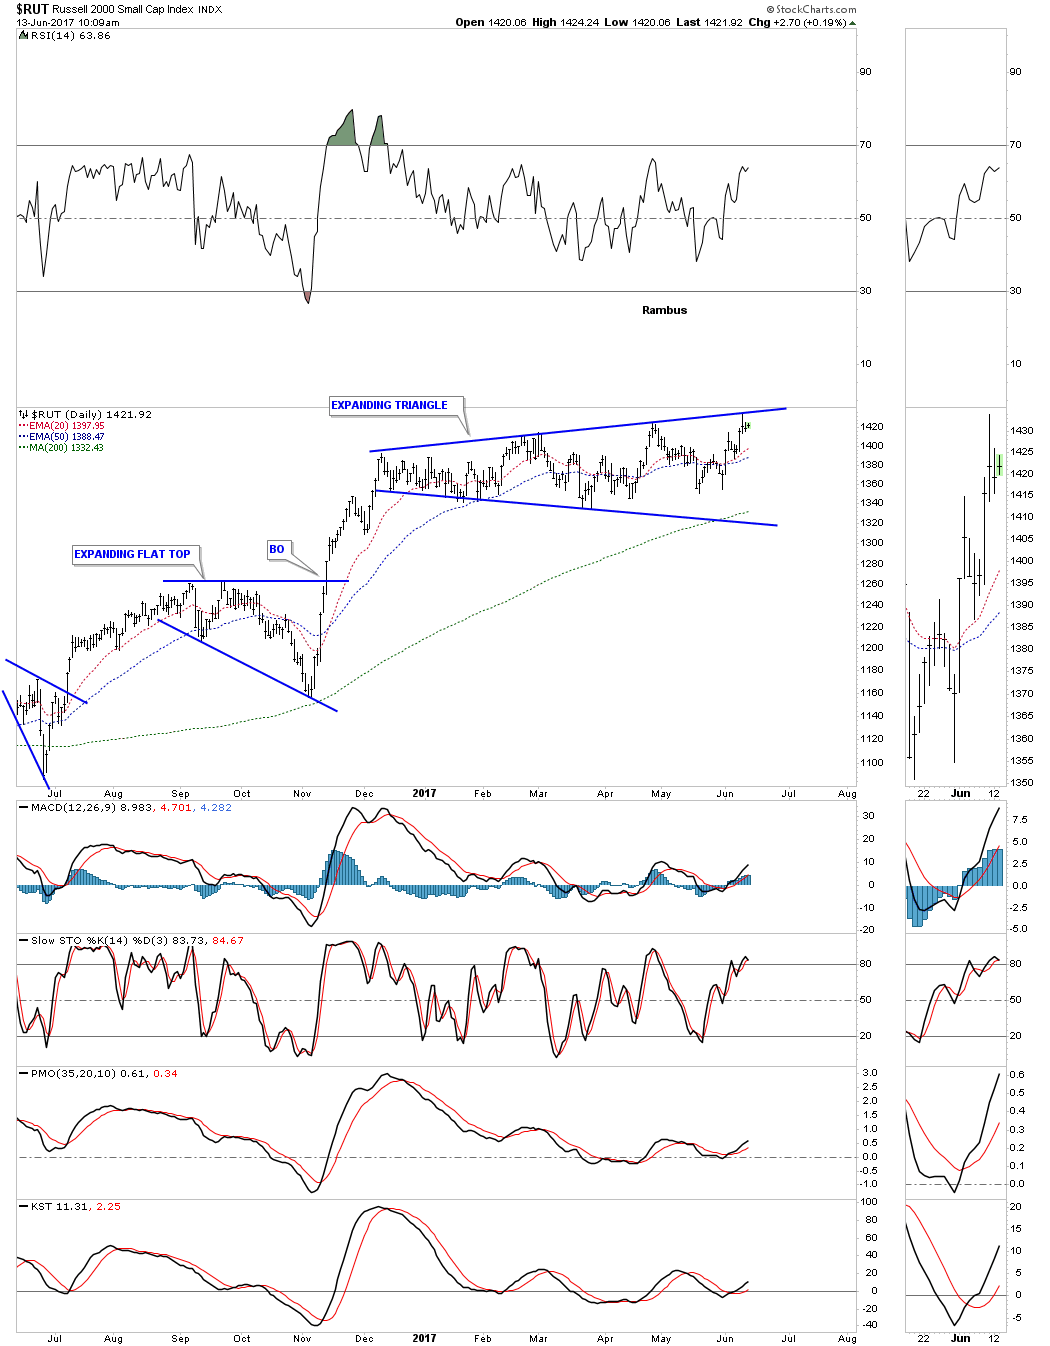
The RUT is still finding resistance at the top rail of its 6 month trading range. A breakout above that top rail, whenever it occurs, will be very bullish for the small caps.
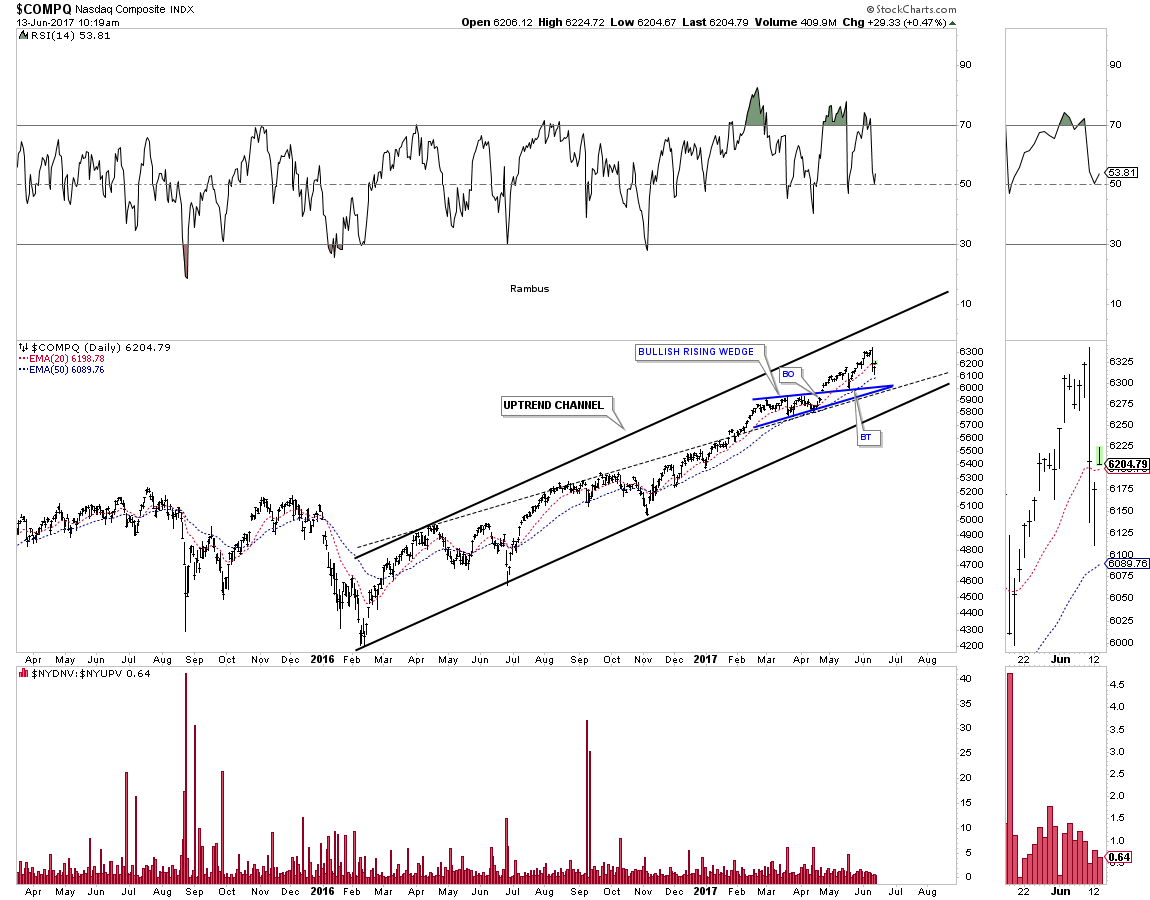
Below is a daily chart for the $COMPQ which shows the bull market uptrend channel began in February of 2016 which is still intact.
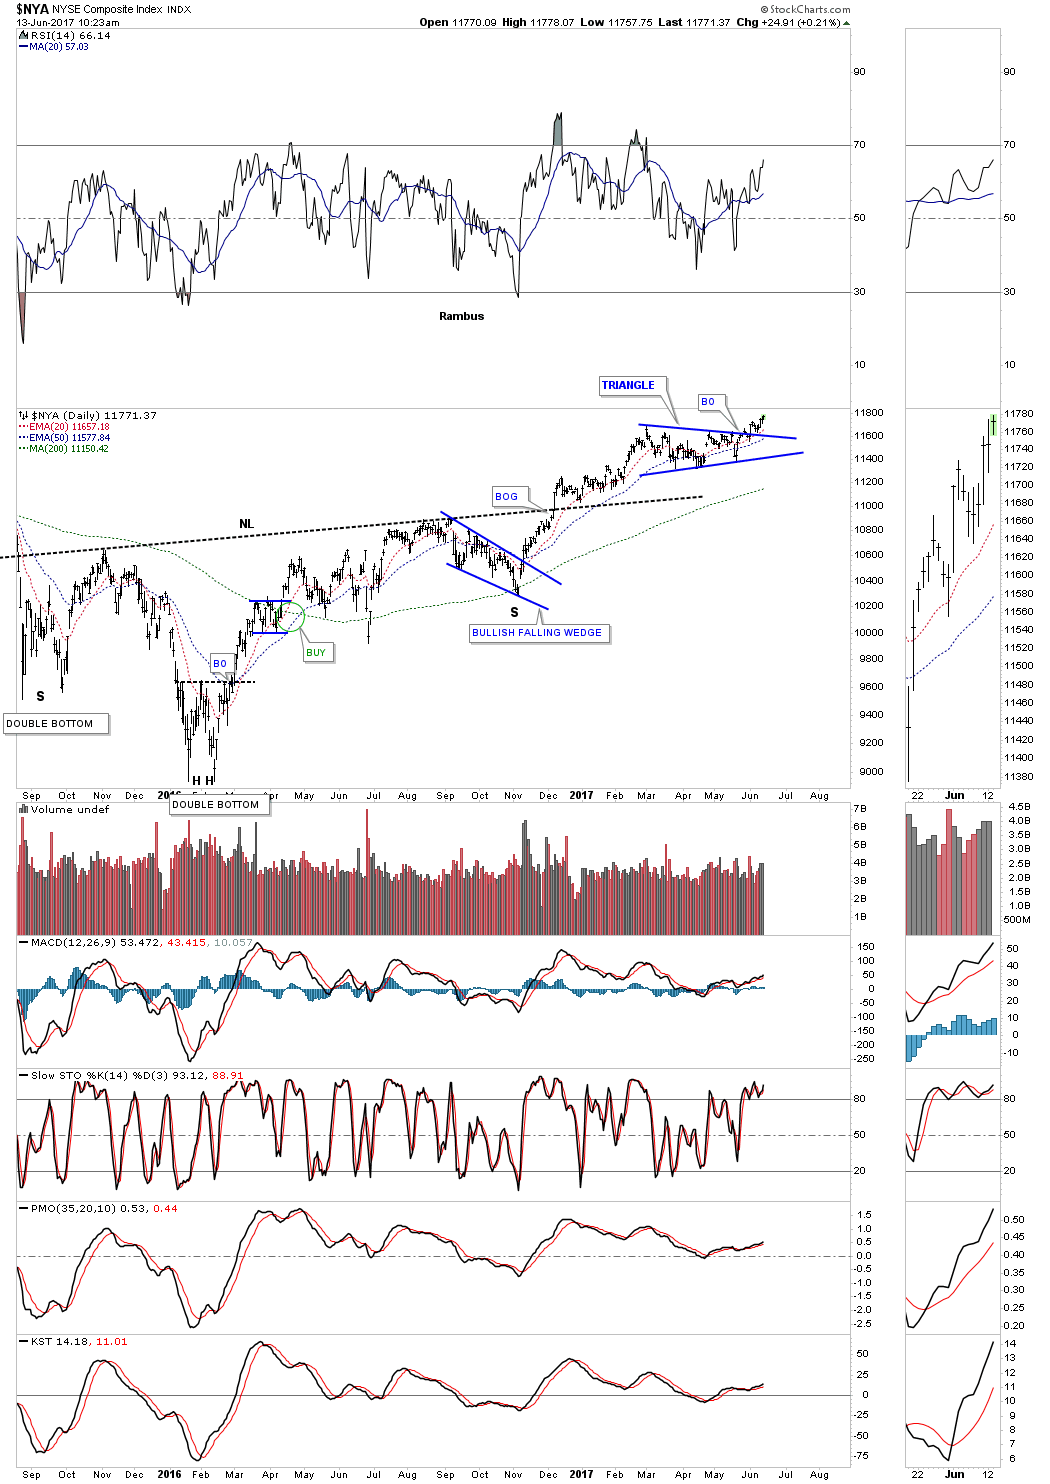
The $NYA, which is a good measure for the health of the overall stock markets, is trading at a new all time high today after breakout out of its blue triangle which formed just above the neckline of a very large H&S bottom.
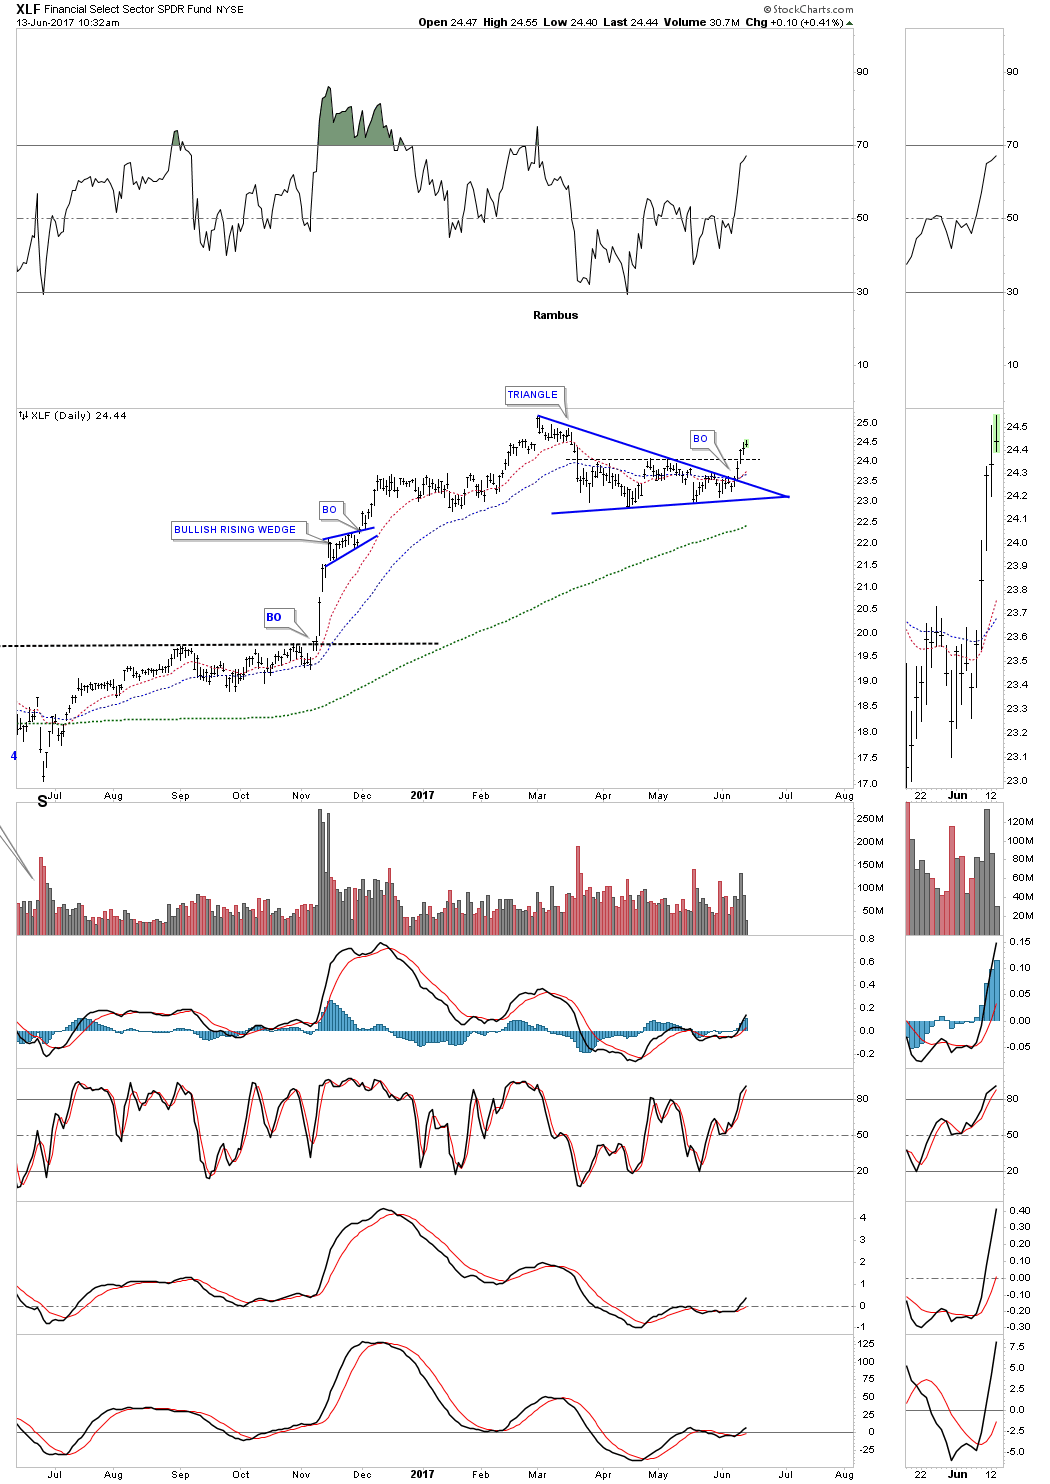
The daily chart for the XLF, financial sector broke out of its blue triangle 4 days ago and is now trading above the right shoulder of the possible H&S top that many are looking for. So far so good.
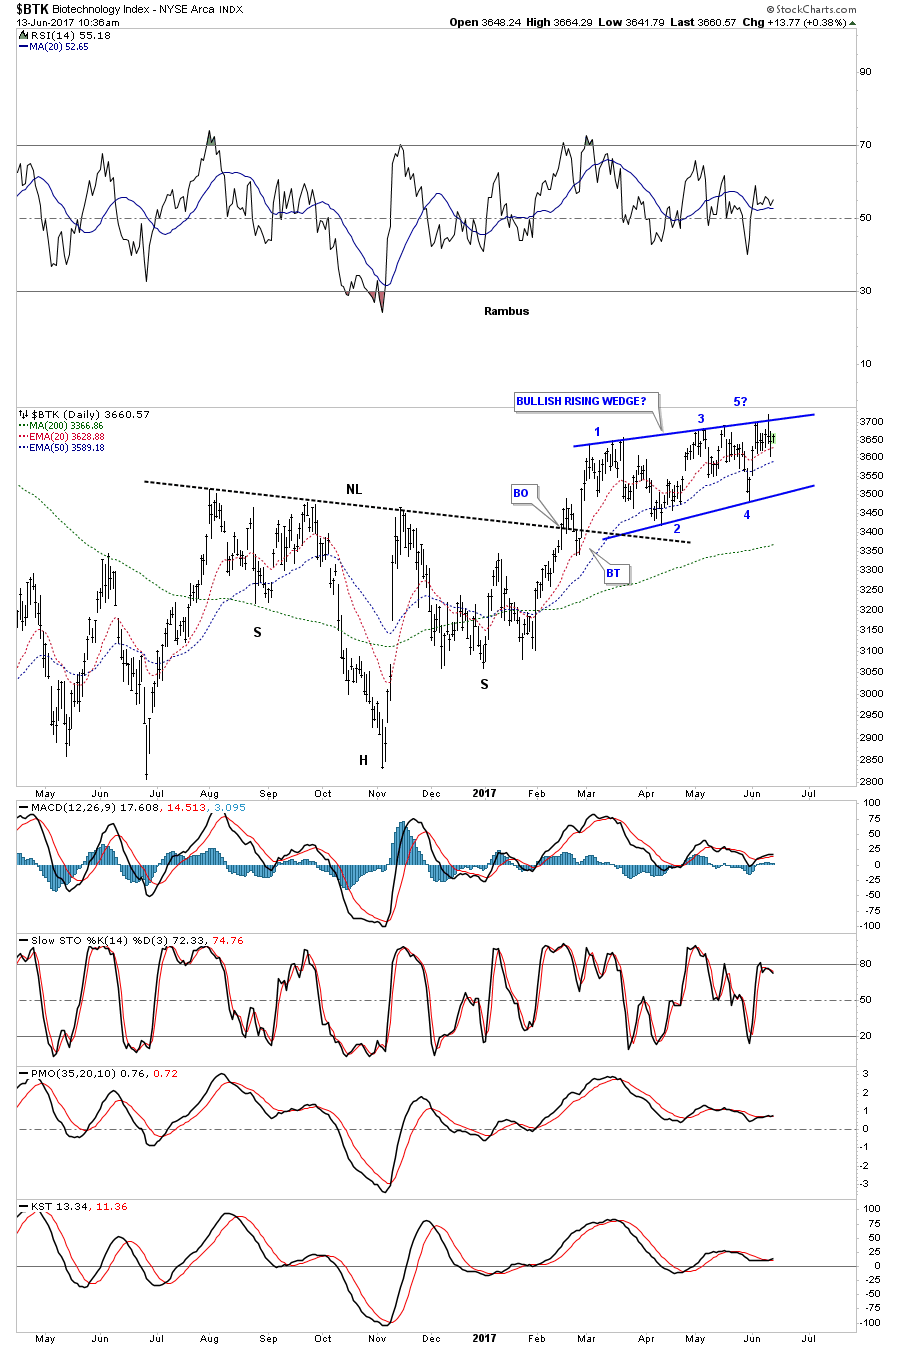
Keep a close eye on the $BTK, biotech index, as it’s still testing the top rail of a potential bullish rising wedge if the breakout is to the topside.
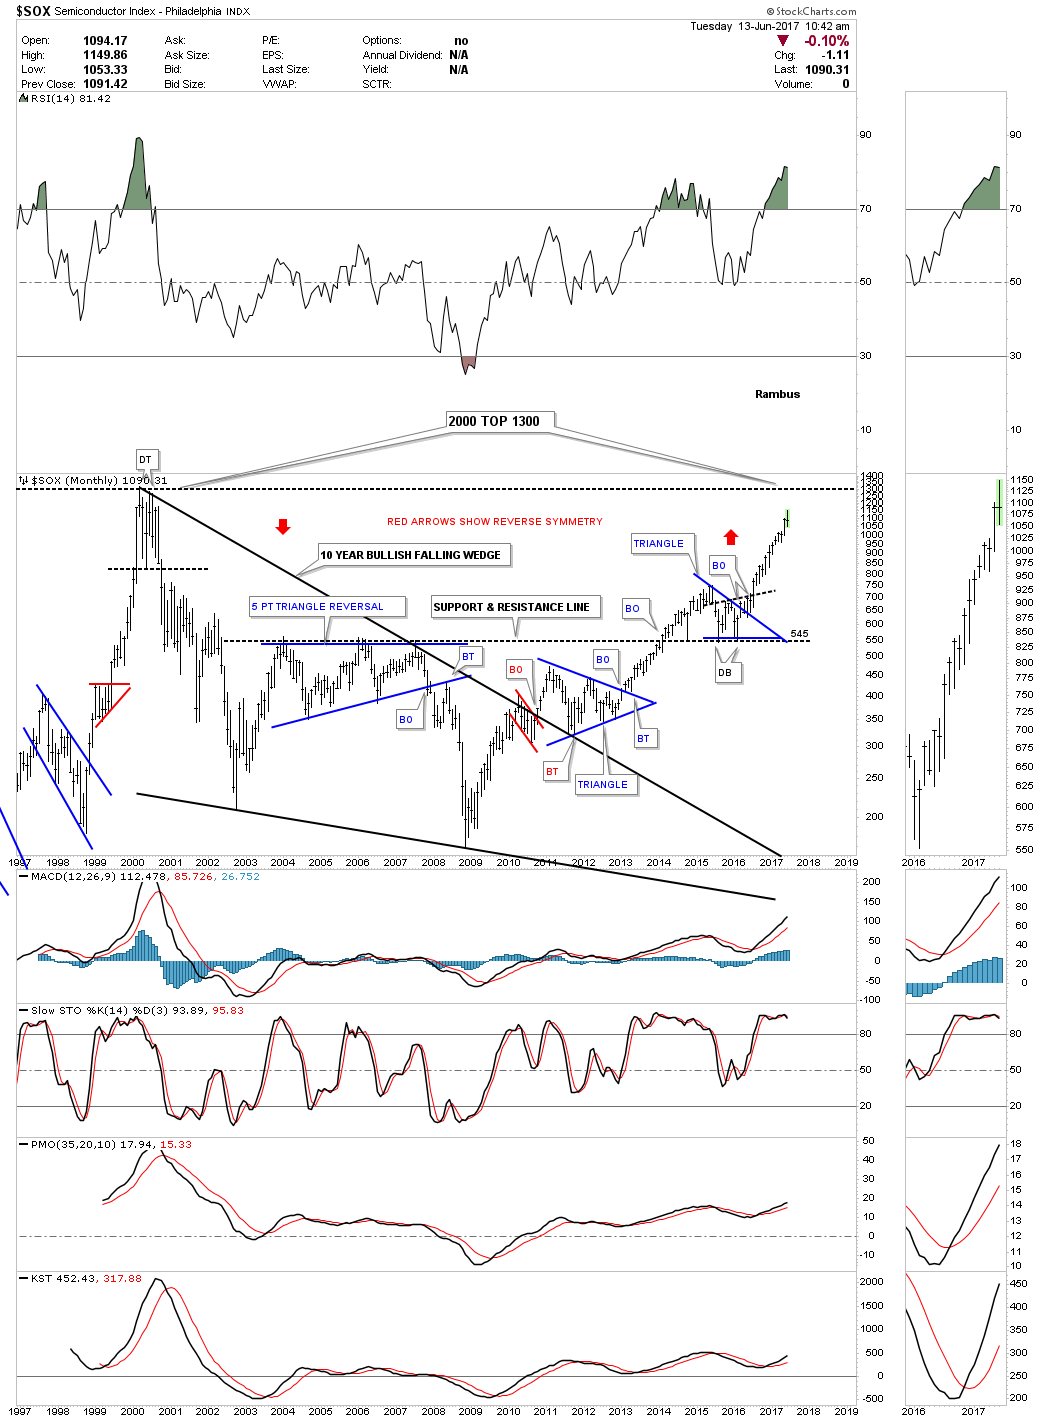
My goal with the $SOX trade is to ride it up to the 2000 high around the 1300 area, where at that point we could see an important correction take place.
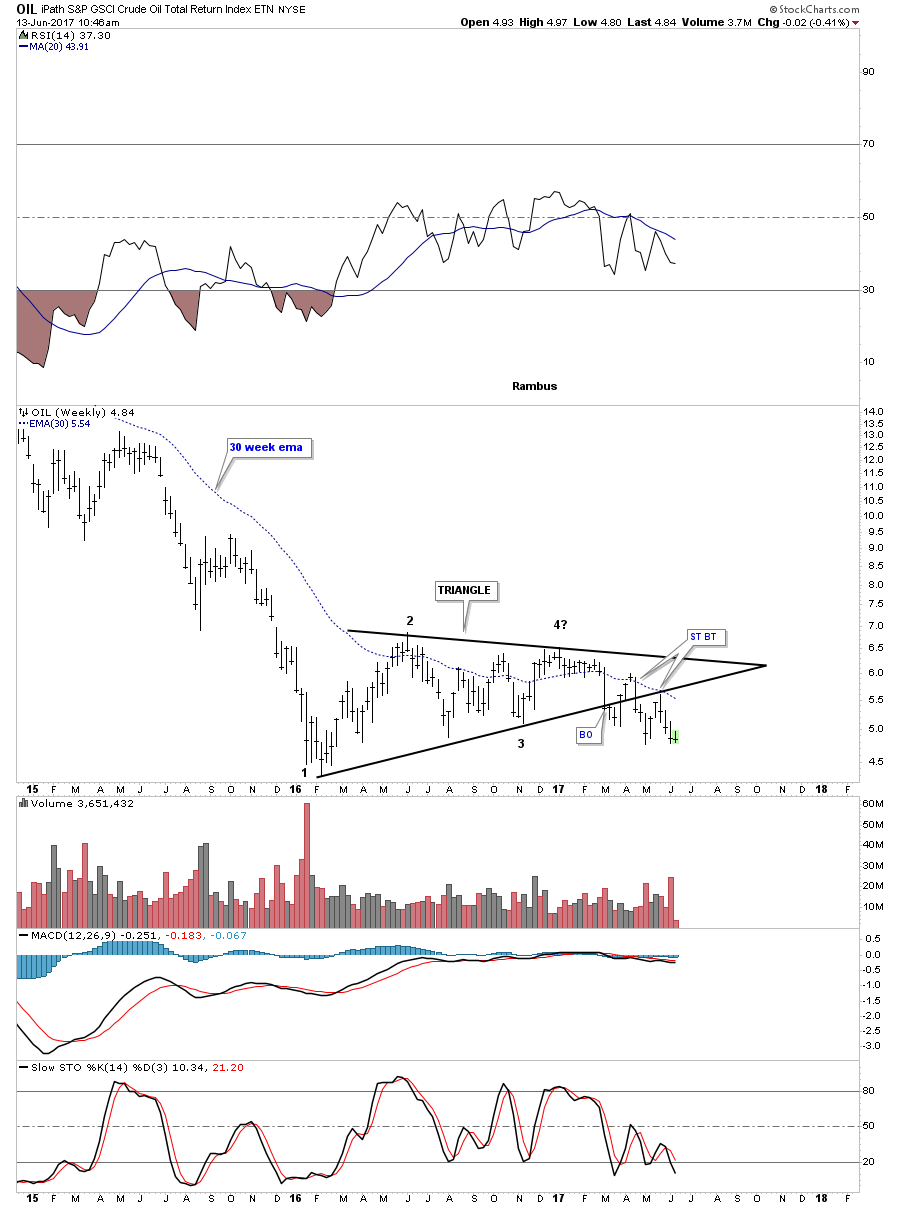
The weekly chart for oil shows it’s close to making a new low since the breakout which is needed to keep the impulse move going.
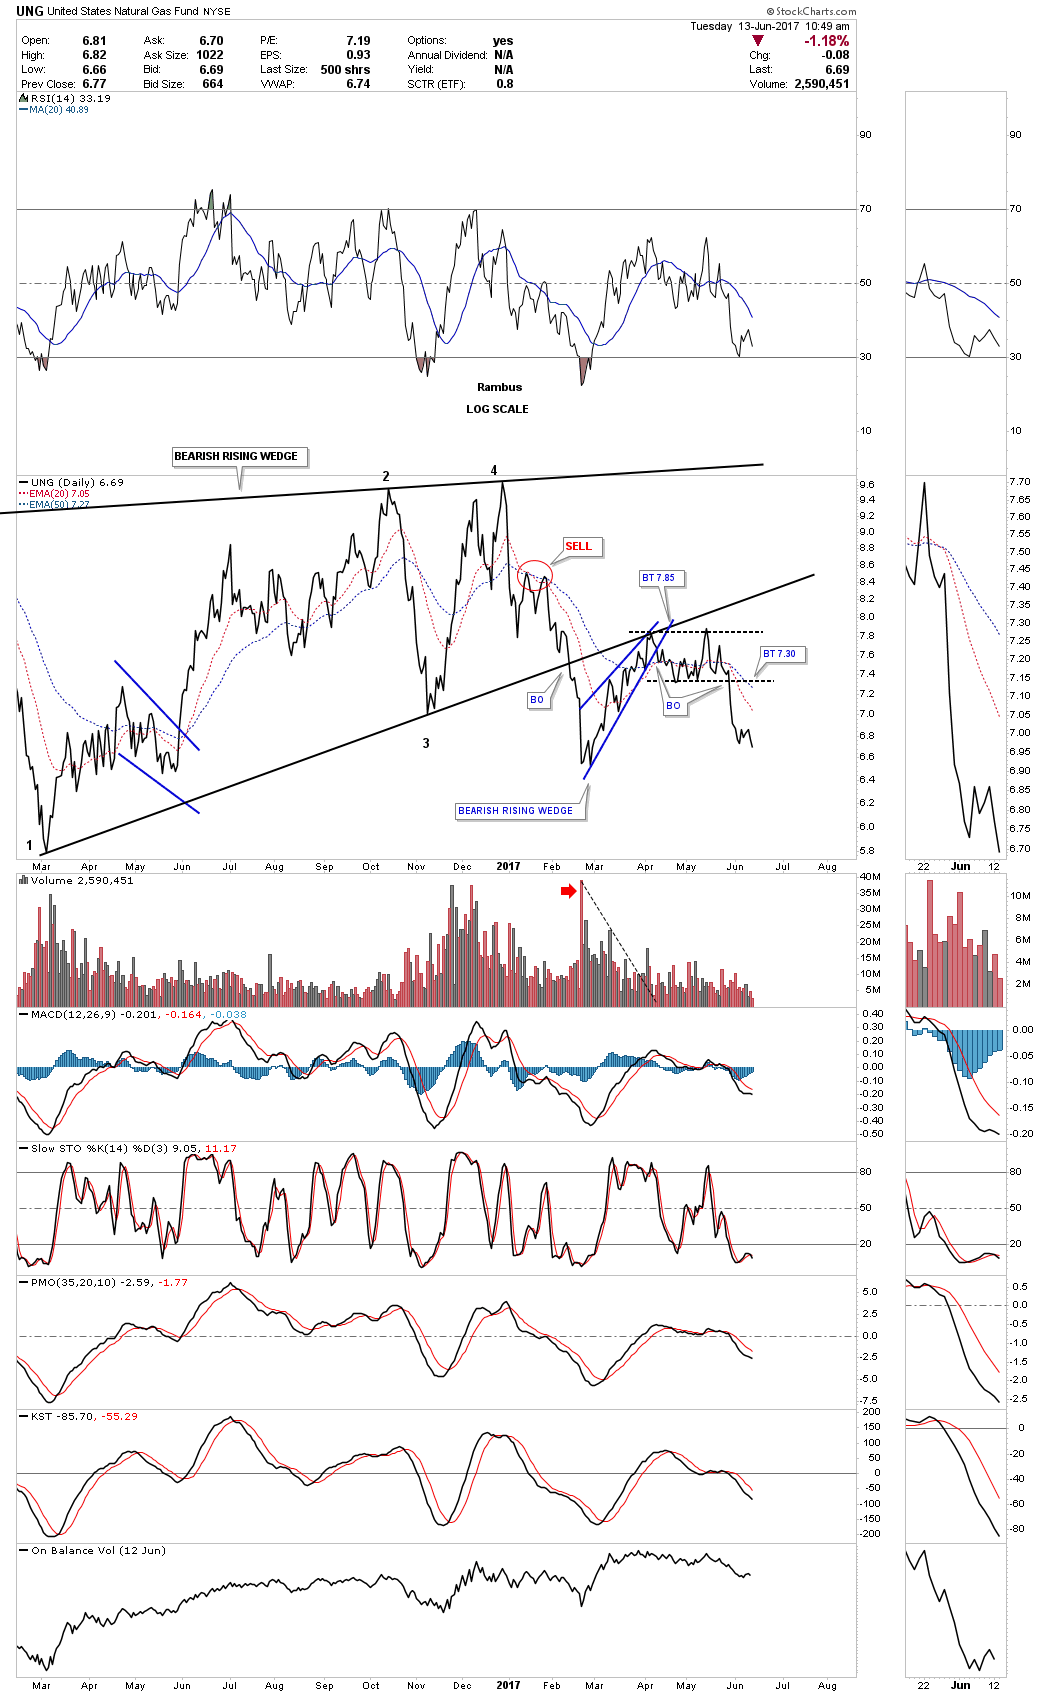
The daily line chart for the UNG is showing it’s making a lower low currently.