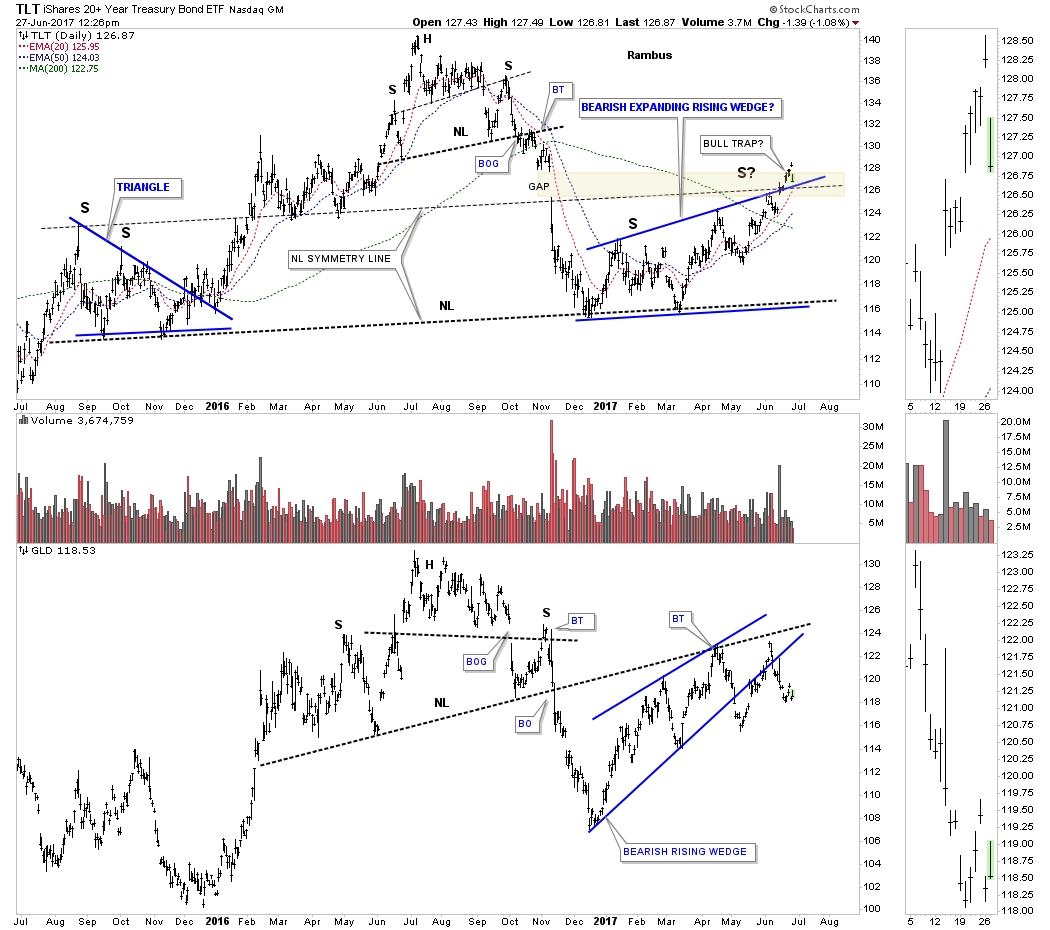
It’s been awhile since we last looked at this combo chart which has the TLT on top and GLD on the bottom. Earlier this year I was showing you a possible H&S top on TLT, but the breakout below the neckline never materialized because of the big gap at the 128 area. I was showing the right shoulder as a possible bearish expanding rising wedge. Last week the price action gapped above the top rail and the neckline symmetry line when it closed the gap.Today’s move down has created an island reversal just above the top rail of the expanding rising wedge. A move back below the top rail of the expanding rising wedge will show a bull trap and possibly the high for the right shoulder.