Tonight I would like to show you some new and old charts for oil which is starting to look positive again. I know it seems counterintuitive that a strong oil price is good for the Transportation Average and to a certain degree the stock markets, but that is generally how it works unless oil goes parabolic. A strong economy puts pressure on the consumption of oil and you generally get a rising price. Same thing for Copper which I think these two commodities are telling us.
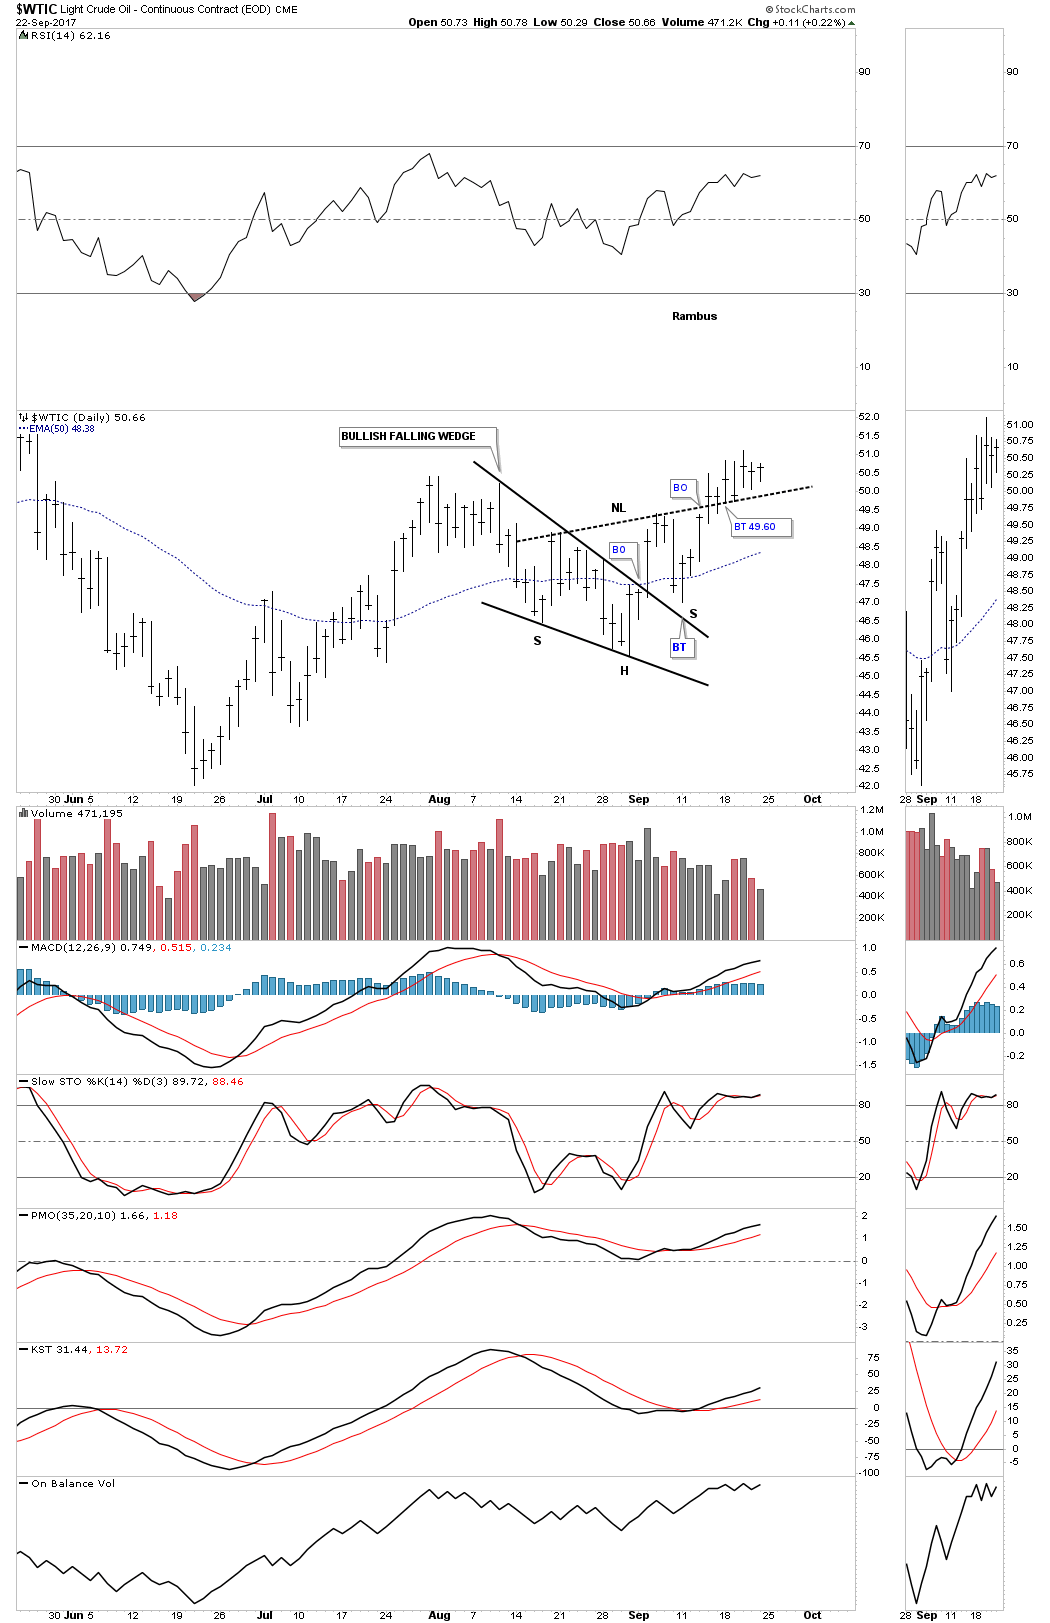
This first chart for oil is one we looked at last week which shows the classic H&S bottom with the left shoulder and head forming inside the bullish falling wedge and the right shoulder low forming on the backtest to the top rail. Oil has now spent 7 days trading above the neckline.
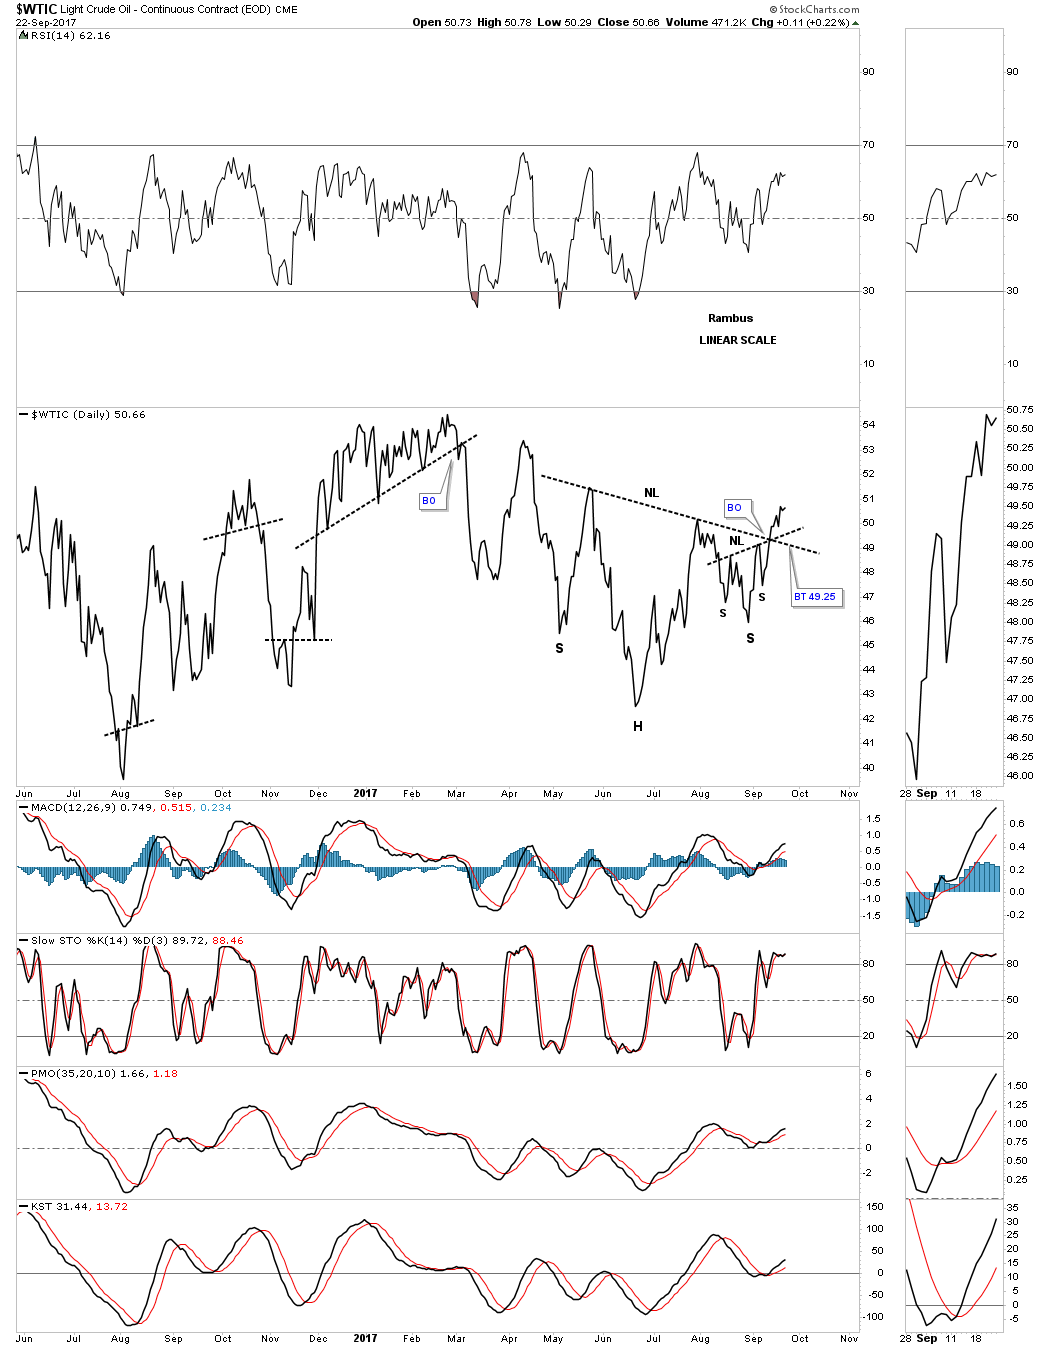
There are many ways to look at oil from a Chartology perspective. Below is a year and a half daily line chart which shows the H&S bottom we just looked at on the chart above as the right shoulder of a much bigger H&S bottom. So we have 2 H&S bottoms building out a bigger H&S bottom which I will show you later is part of a much bigger H&S bottom. Big reversal or consolidation patterns are generally made up of several smaller patterns.
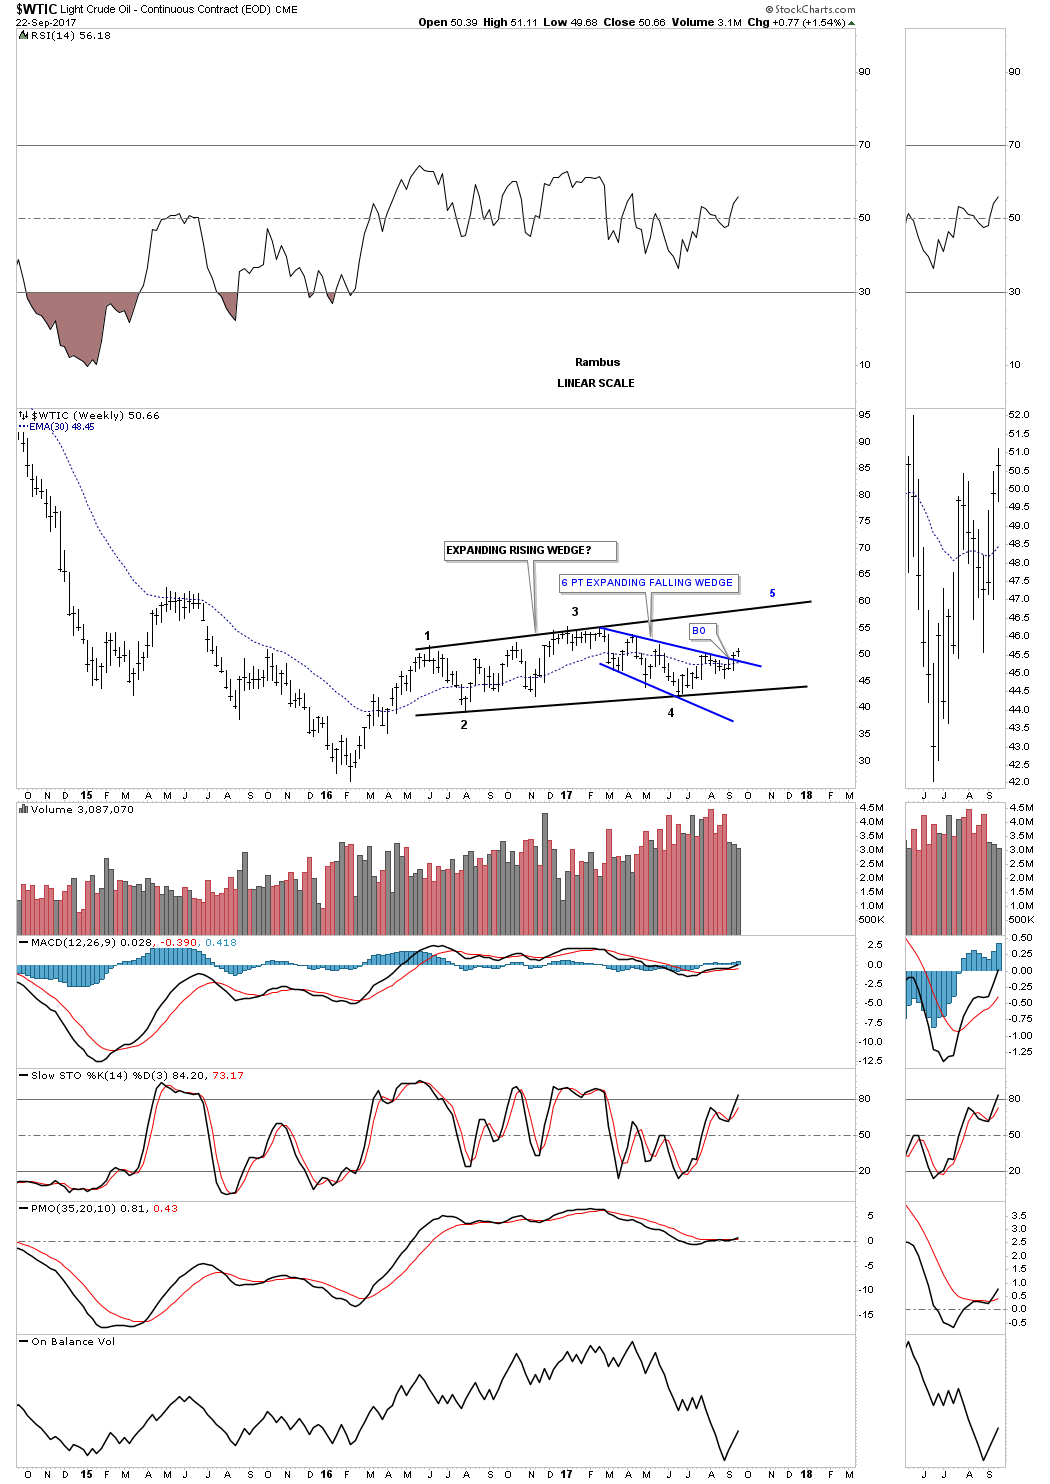
Now I would like to show you a third pattern that has formed since the first of the year which is the blue bullish expanding falling wedge. As you can see part of the bullish expanding falling wedge is the H&S bottom that formed on the daily line chart above, along with the small H&S bottom, that makes up the right shoulder being the first H&S bottom we looked at on the daily bar chart. Also the $WTIC is trading back above the 200 day moving average which is positive.
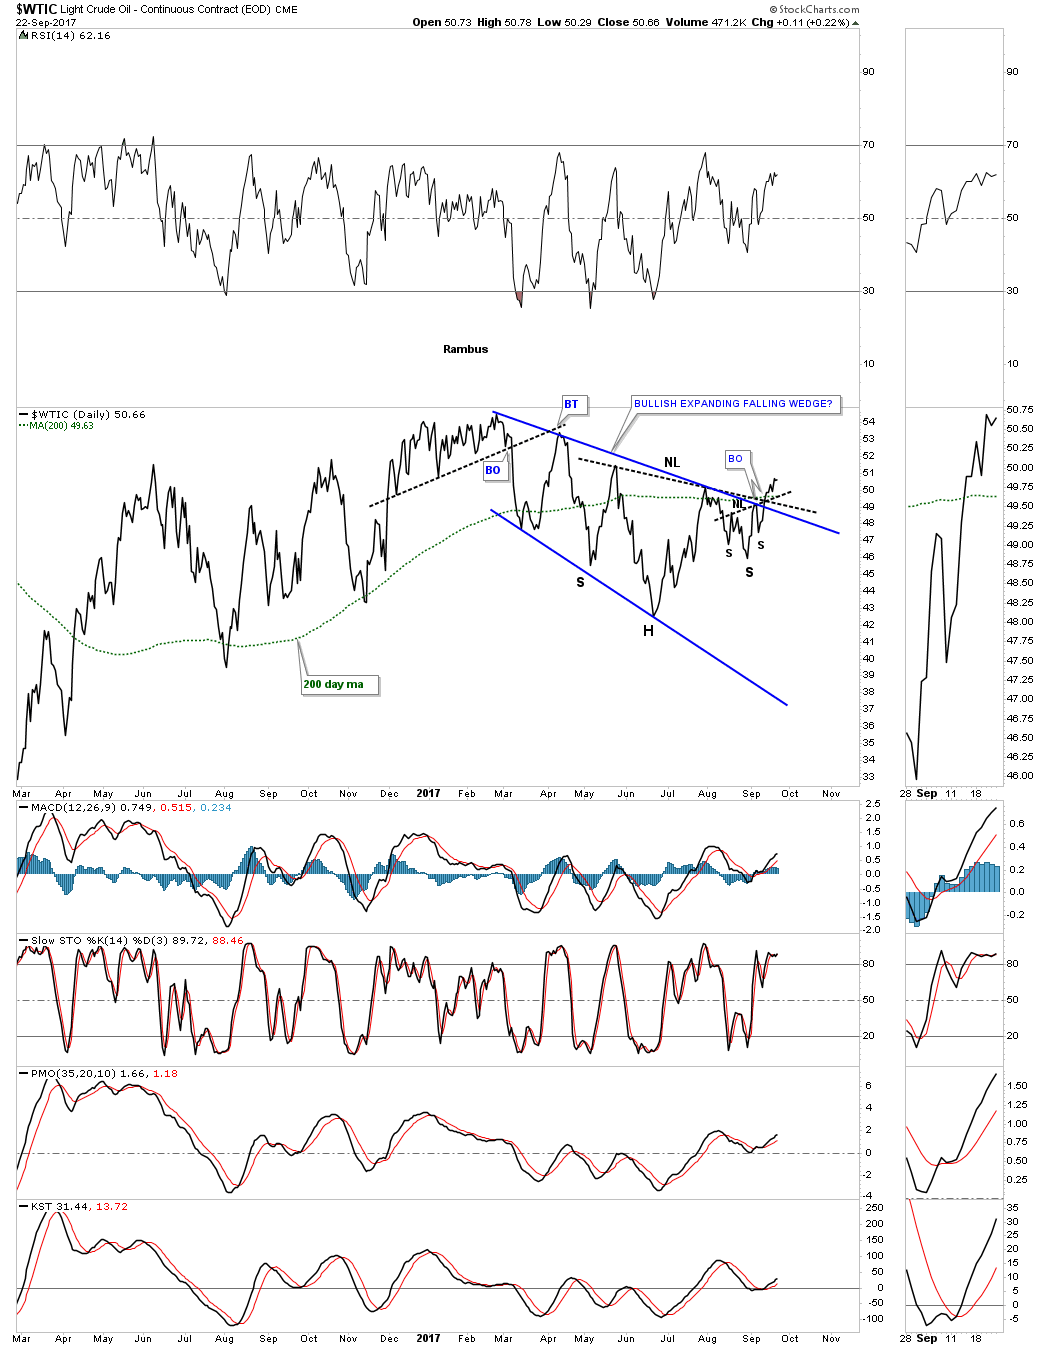
Now lets work our way back in time and look at a 3 1/12 year weekly bar chart for oil which puts the blue expanding falling wedge in perspective. As you can see the bullish expanding falling wedge is part of a much bigger pattern which is year and a half expanding rising wedge that is working on its 4th reversal point. Oil is also trading above the 30 week ema.
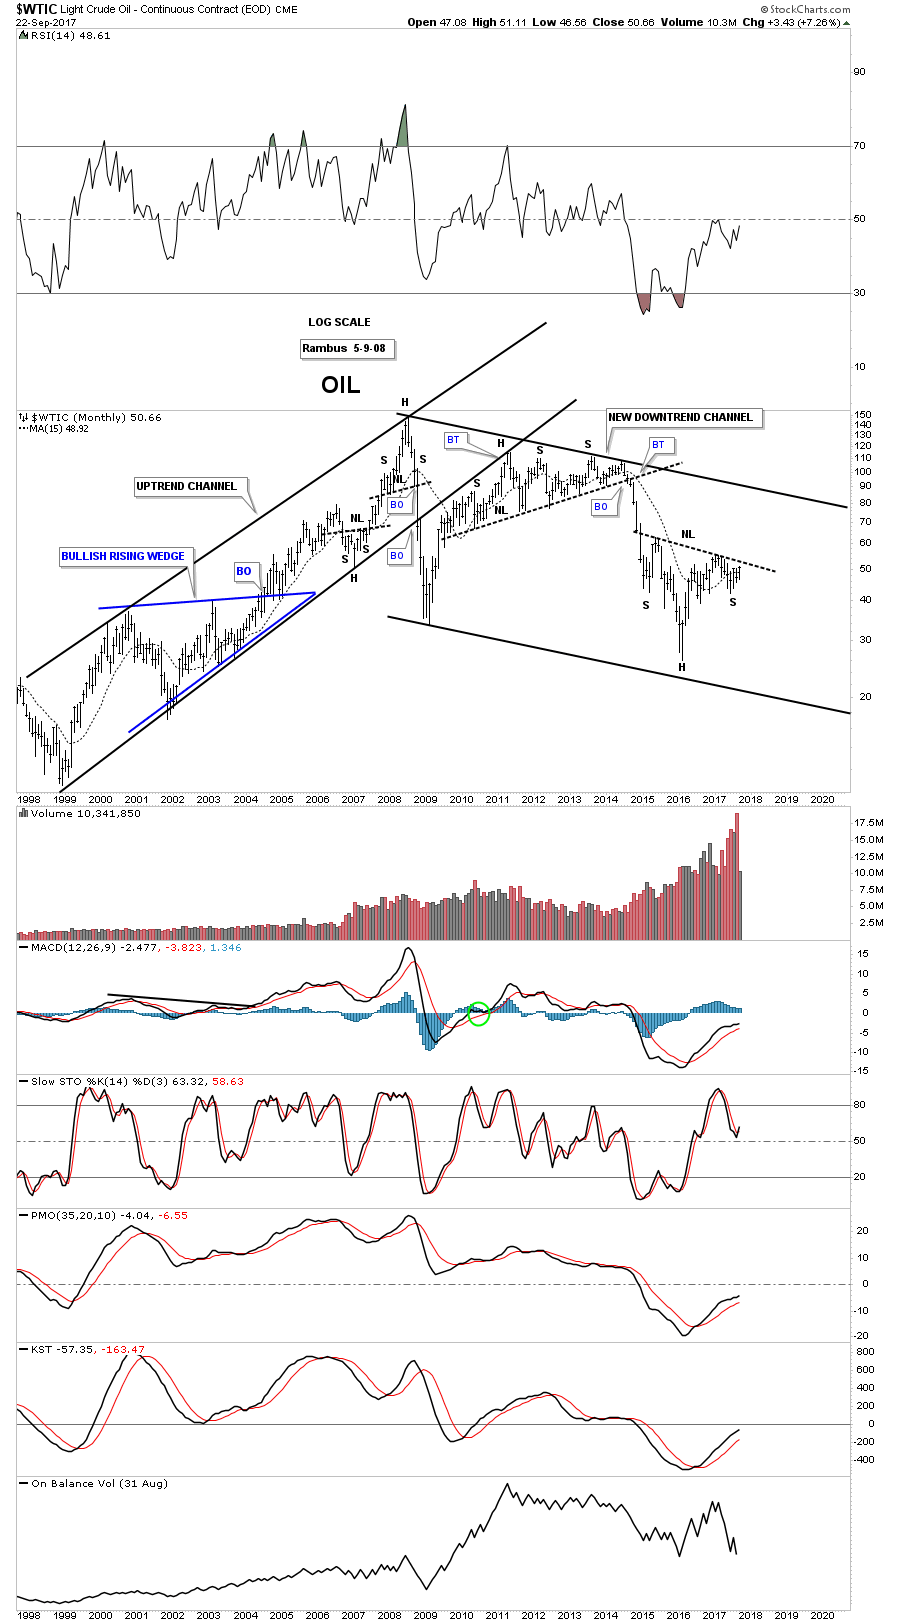
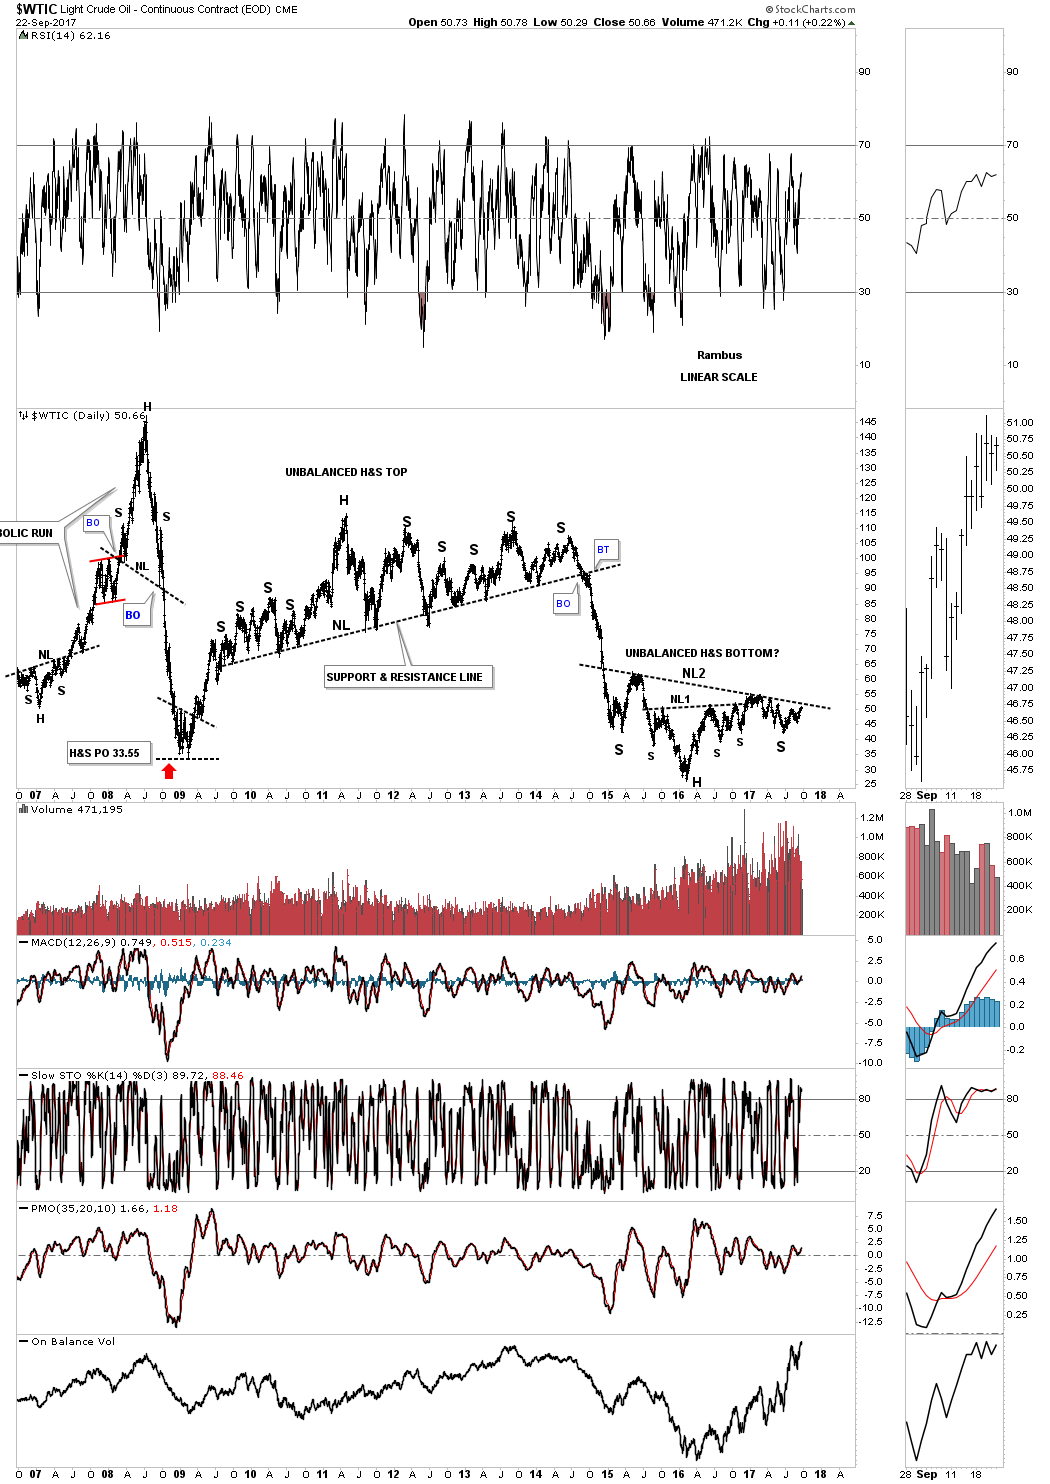
This next chart is an old chart I’ve had for many years which shows the parabolic rise into the 147 high and the parabolic decline that followed. The countertrend rally took over 4 years to complete and built out a massive unbalanced H&S top. When you spot big patterns like that early on it can be very frustrating because each time the price action hits the neckline or support and resistance line you would get another rally. This went on for several years with each rally being more frustrating than the previous one as I was looking for a breakdown at any one of those lows.
When the breakdown finally happened in late 2014 oil had one quick backtest to the neckline and then collapsed in a vertical move down. All that negative energy was finally released in one massive impulse leg.
Now lets turn our attention to the bottom of the chart. The chart patterns we looked at earlier in this post are hardly visible on this 20 year chart which make up part of the right shoulder of an almost 3 year inverse H&S bottom. What I find fascinating is how similar that massive H&S top is to the inverse H&S bottom. By that I mean the H&S top was an unbalanced H&S top and our H&S bottom is also unbalanced.
Below is another old chart I was using during the topping process which was a weekly line chart. This weekly line chart shows the topping pattern as a 5 point triangle reversal pattern with a H&S top which built out the last half of the 5 point triangle. Our inverse H&S bottom looks a little clearer using a weekly line chart.
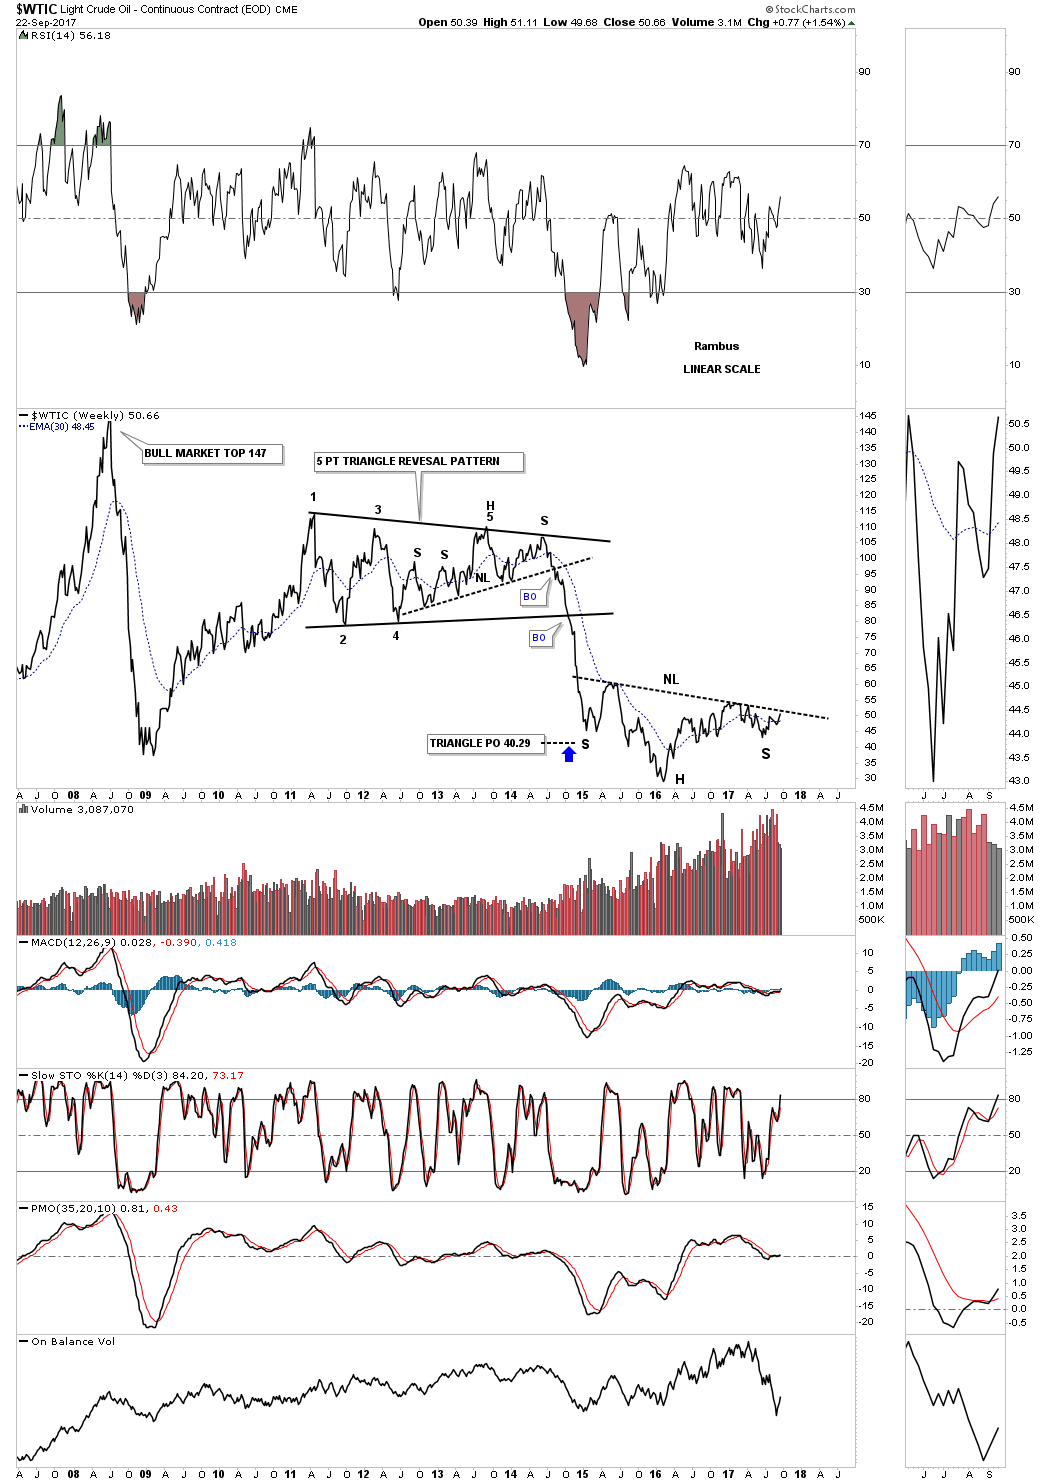
This last chart for oil is a 20 year monthly look that shows the bull market uptrend channel into its parabolic run to 147. The last consolidation pattern oil made before it ran to 147 was a H&S consolidation pattern which formed in 2007. It’s hard to see on this chart but the high at 147 was a H&S top which reversed the parabolic uptrend. Then oil formed that massive unbalanced H&S top to reverse the counter trend rally which brings us to our current inverse H&S bottom. If our current H&S bottom plays out we should see a move of about 25 points from the breakout point which would put oil up around the 75 to 80 area.
As I mentioned at the beginning of this post, if we see oil in a nice move higher, not too strong and not to weak, it would suggest that the world economies should be doing very well as they demand more oil. I also believe that the Transportation Average and the PM complex could also do very well. Just look at oil’s bull market from 1999 to 2008 and compare it to what the PM complex did during those same years. As long as oil doesn’t go parabolic on us I think oil will be a good proxy for the world economies. I also believe oil is presenting us with a big money making opportunity that doesn’t come around very often. If one can find a large pattern early enough that’s where the big money is made if one can have the confidence to ride the price action to completion. Have a great weekend. All the best…Rambus