There are some big H&S bottoms on several of the US stock market indexes that I have maybe only shown you once around the time the necklines were broken. When I first discovered them I wasn’t sure they would play out so I just kept them on the back burner to see what would happen.
I’ve mentioned recently how important it is to have a game plan to follow so you know that when the charts change, then your game plan needs to be adjusted to the new information the charts are showing. Sometimes just a little adjustment is all that is needed and as long as your game plan keeps play out you just go with it until something changes.
These big H&S bottoms are a piece of the bigger puzzle for the game plan I’ve been showing you which suggests we are in a secular bull market that began at the 2009 crash low. The old expression, “If it aint broke don’t fix it,” applies to these H&S bottoms. As long as they keep working they are what they are. One thing these H&S bottoms have in common is they broke out above their necklines in late 2016. I know many of you will think I’ve lost my mind, but keep in mind that I’ve been following the price action for about a year and a half.
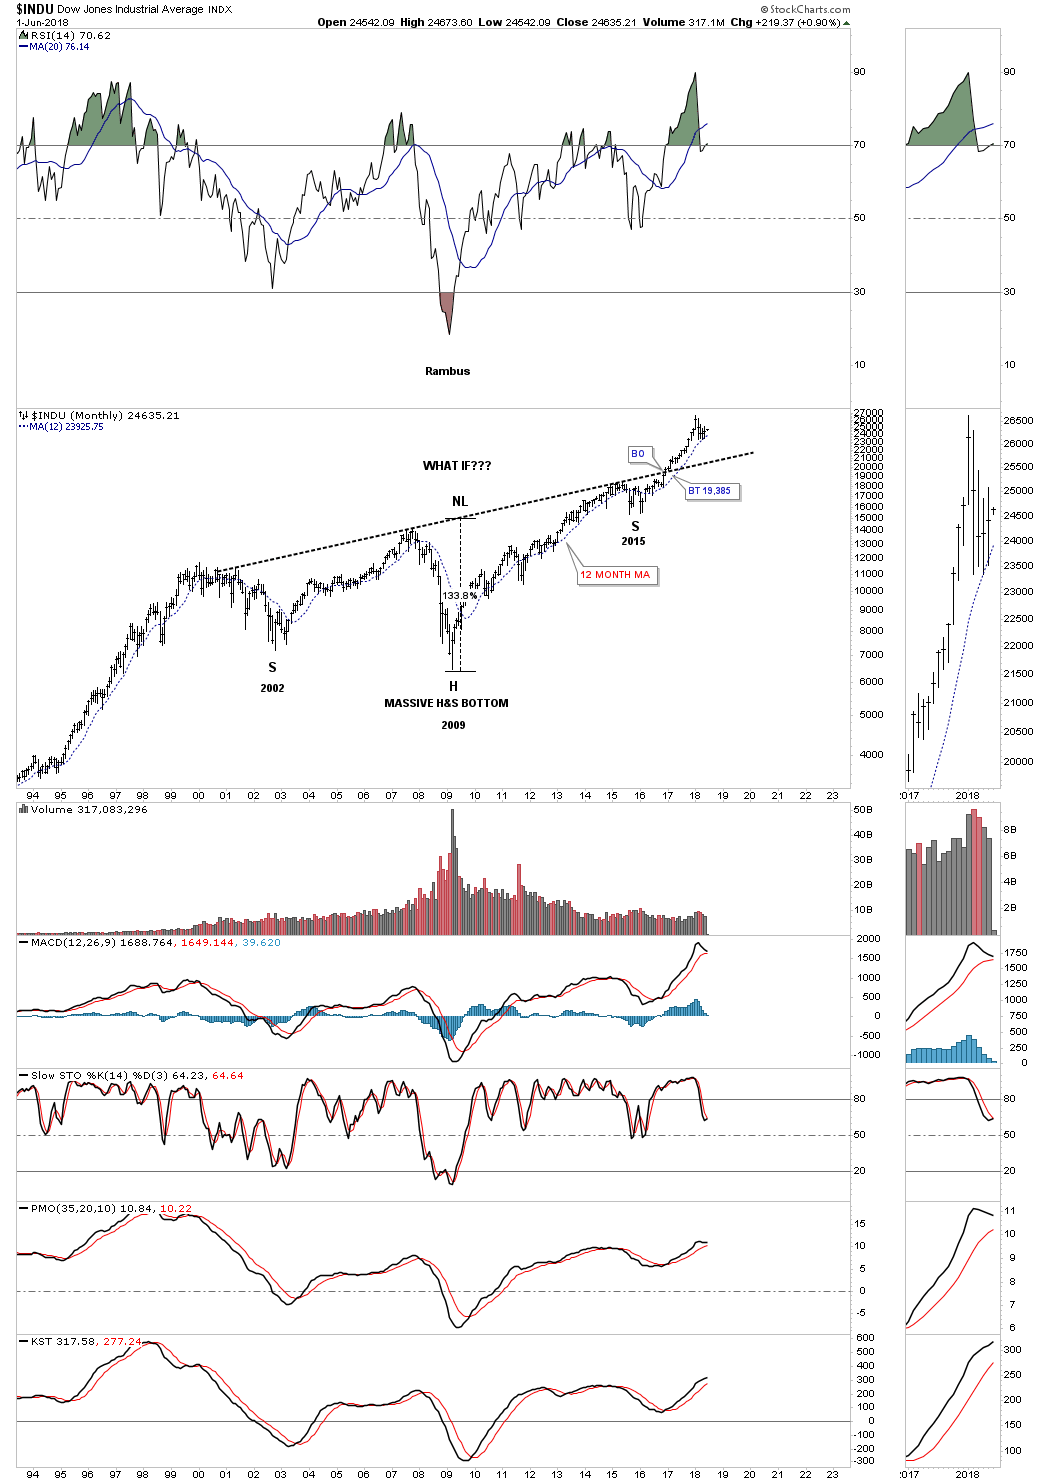
This first massive H&S bottom is for the INDU. The left shoulder was formed during the bear market low in 2002. The head was formed at the 2009 crash low and the right shoulder low formed during that tough correction in 2015. The breakout occurred in late 2016 and the INDU hasn’t looked back since. The price objective for that H&S bottom is well over 40,000 if it continues to plays out.
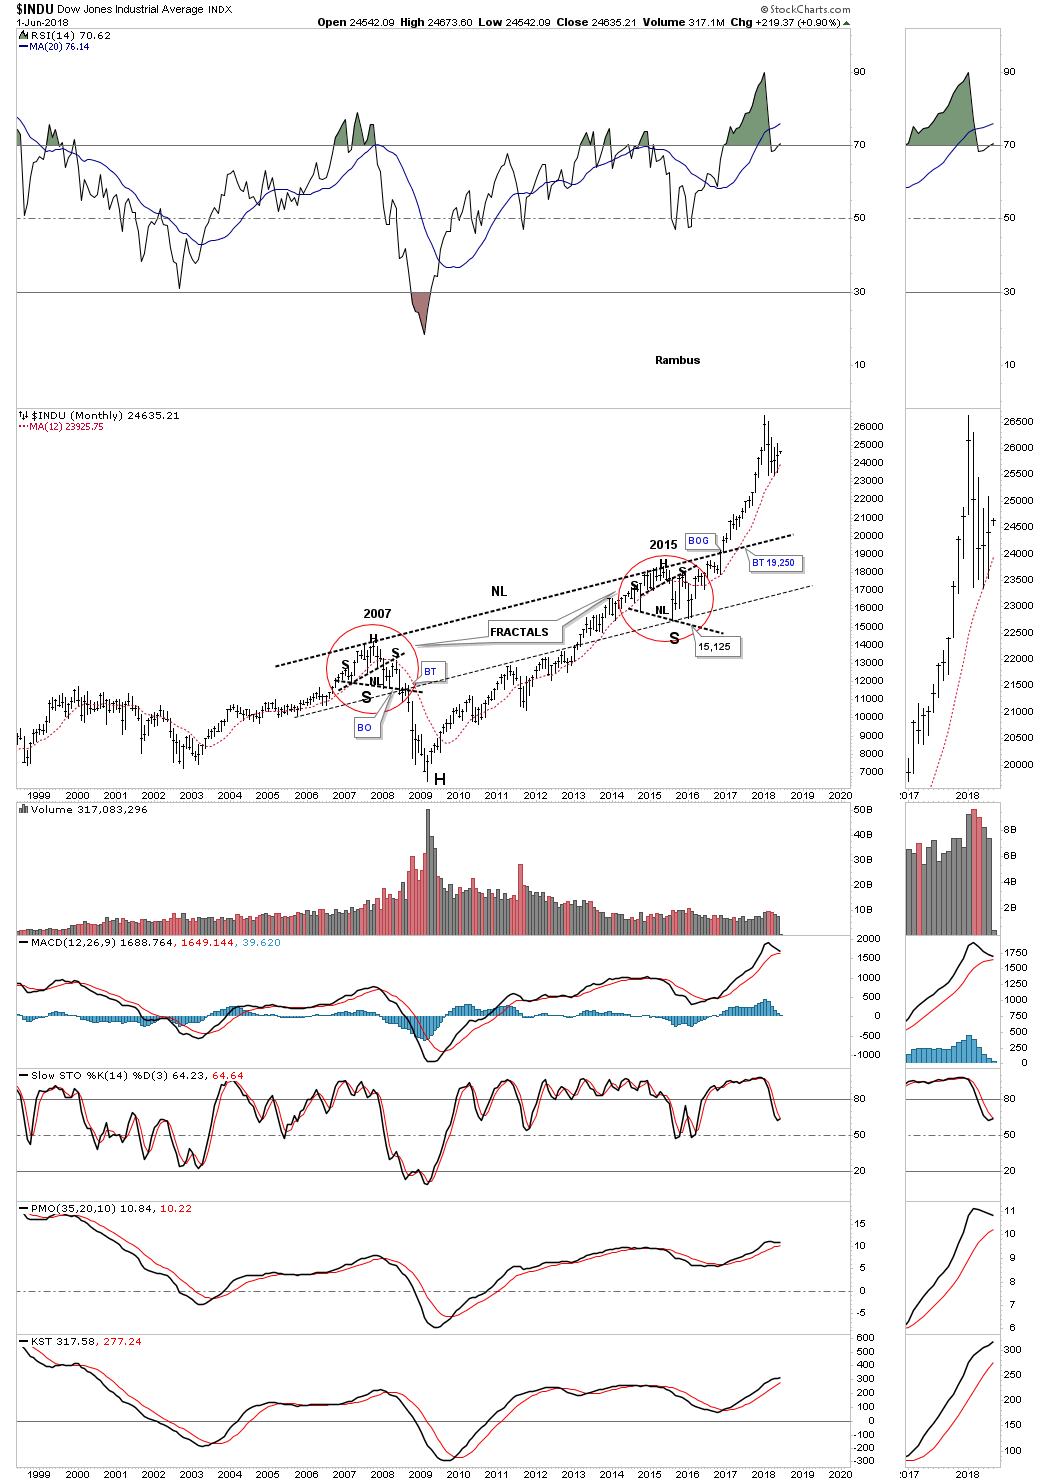
This next chart for the INDU really isn’t a H&S bottom, but I labeled it that way because of the symmetry of the left and right shoulders being fractals.The neckline is really a support and resistance line. I first built this chart during the 2015 correction as the right shoulder was forming what looked like a fractal to the left shoulder. It was uncanny how both the left and right shoulders looked at the time. The right shoulder fractal broke symmetry at the very last moment when the price action reversed up off the neckline symmetry line for the last time. In 2007 the price action broke below the neckline symmetry line. The red circles are the exact same size and the breakout above the big neckline came in December of 2016.
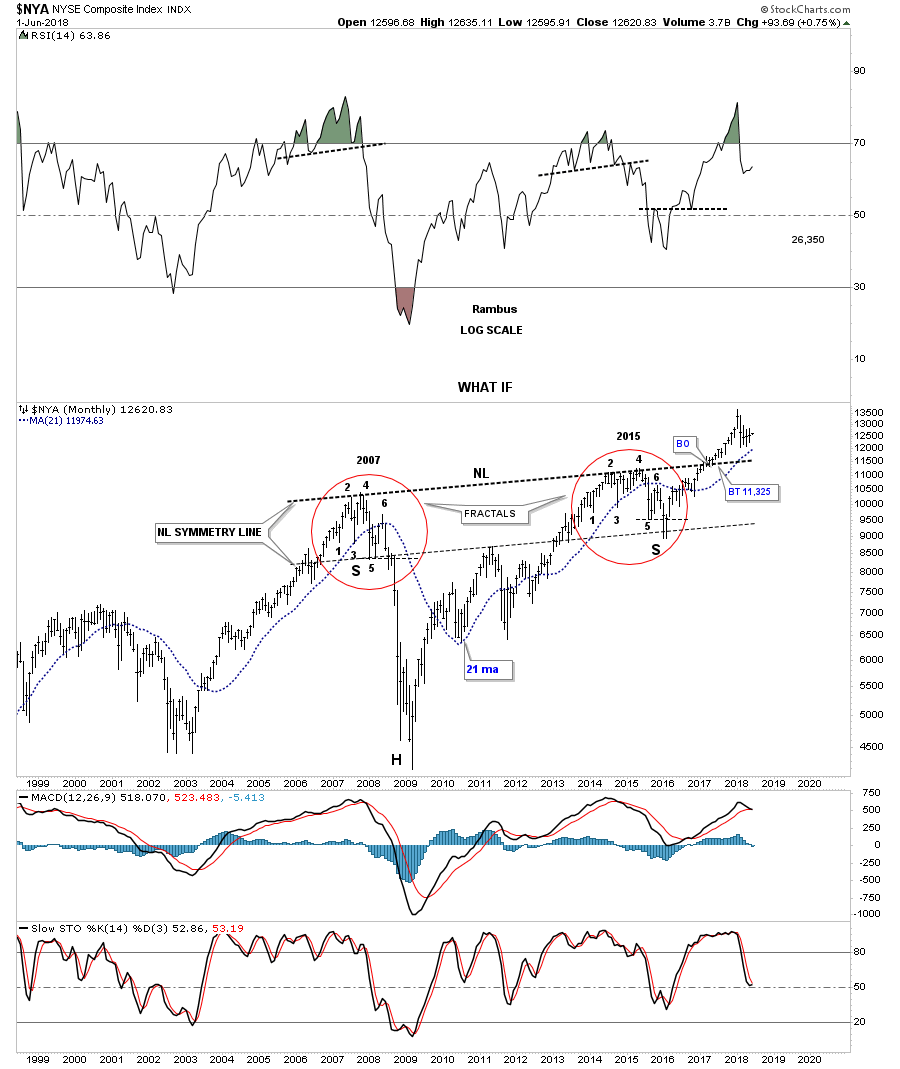
This next chart for the NYA I also built out during the 2015 correction which was also showing a fractal left and right shoulder which was even more pronounced than the one on the INDU. To see the beautiful fractal symmetry follow the price action starting with #1 on the left shoulder then look at #1 on the right shoulder. Then follow the price action from #2 to # 3 so on and so forth until you get to reversal point #6 down to the neckline symmetry line. In 2007 the price action broke below the neckline symmetry line and in February of 2016 the price action bounced off of the neckline symmetry line that started the two year bull run until January of this year. The breakout of the big neckline took place in January of 2017. As long as the neckline holds support the big game plan is still in play.
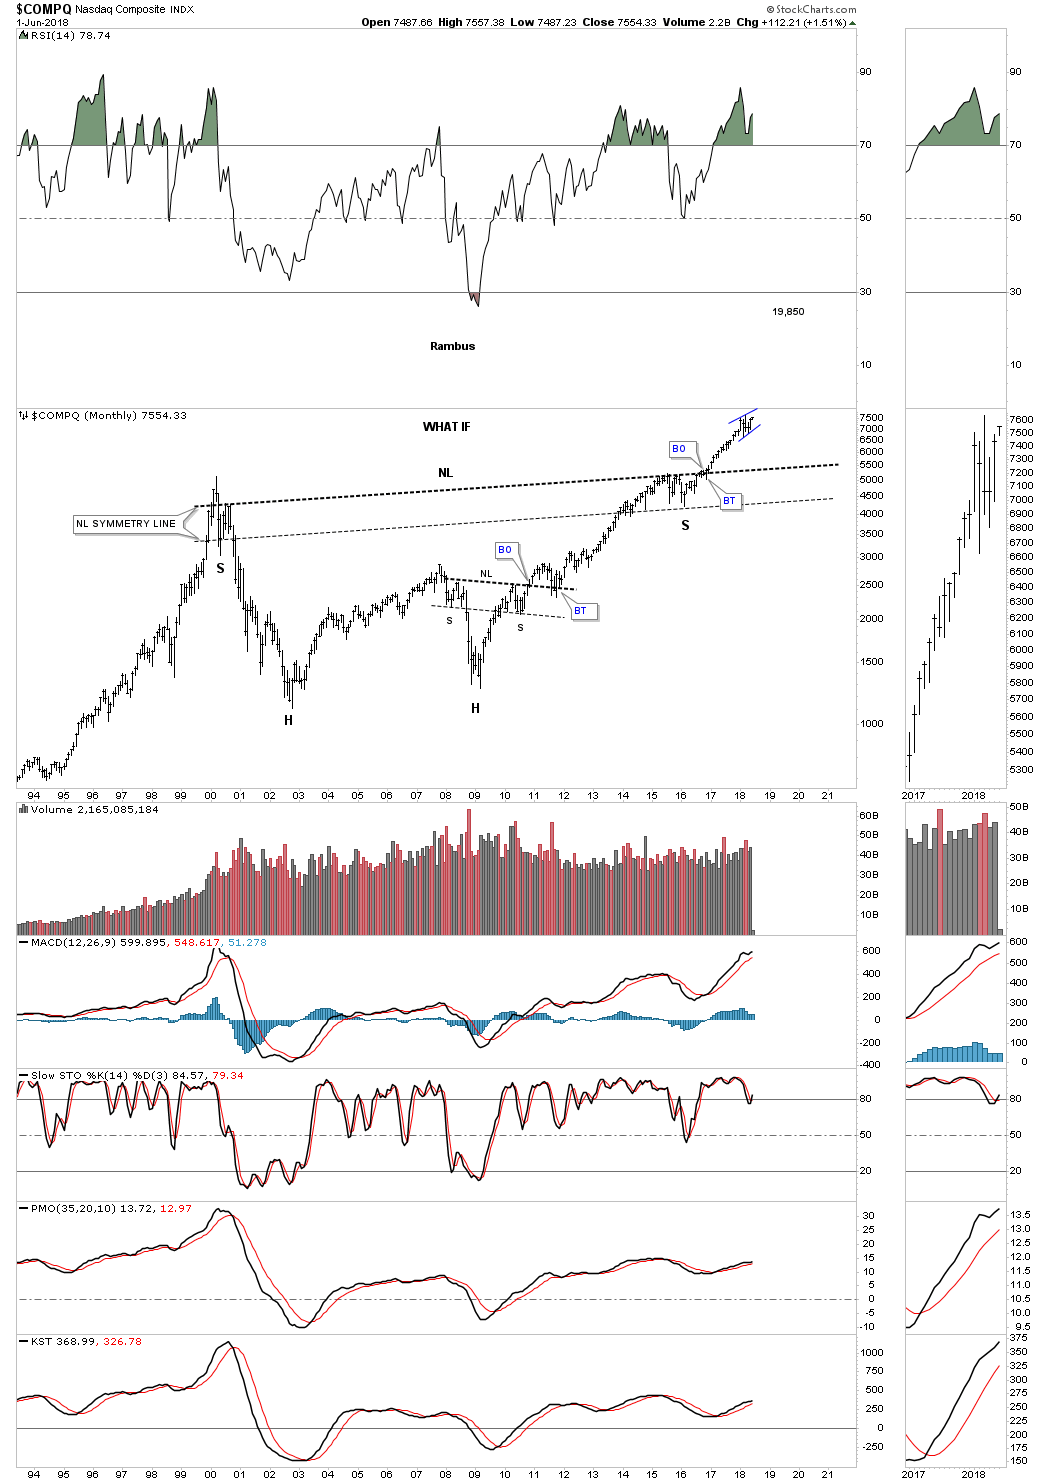
This last chart for tonight shows a massive double headed H&S bottom on the COMPQ. The symmetry is really quite good. Again the breakout above the big neckline took place in late 2016. Since today is the first day of trading for a new month it will be interesting to see if today’s gap will be closed or will we look back and see a break away gap by the end of the month. See thumbnail on the right side of the chart.
These massive H&S bottoms have been working since late 2016 which is right at a year and a half. Will they keep working out is any bodies guess, but as long as they keep playing out this part of the big game plan is still in place. “If it aint broke don’t fix it.” Have a great weekend. All the best…Rambus