The HUI along with most of the other PM stock indexes are at a critical point right here and now. Below is a combo chart we’ve following which has the UUP (The US Dollar Index ETF) on top and the HUI on the bottom. The UUP is building out a potential morphing bullish rising wedge consolidation pattern which would most likely give the PM complex some headwind if the price action breaks out top side. On the other hand if the rising wedge breaks down then the PM complex should have a strong tailwind at their backs. If the HUI can breakout above the top rail of its descending triangle that would be very bullish for the PM complex. As you can see the HUI and the UUP are trading at a critical inflection point right here.

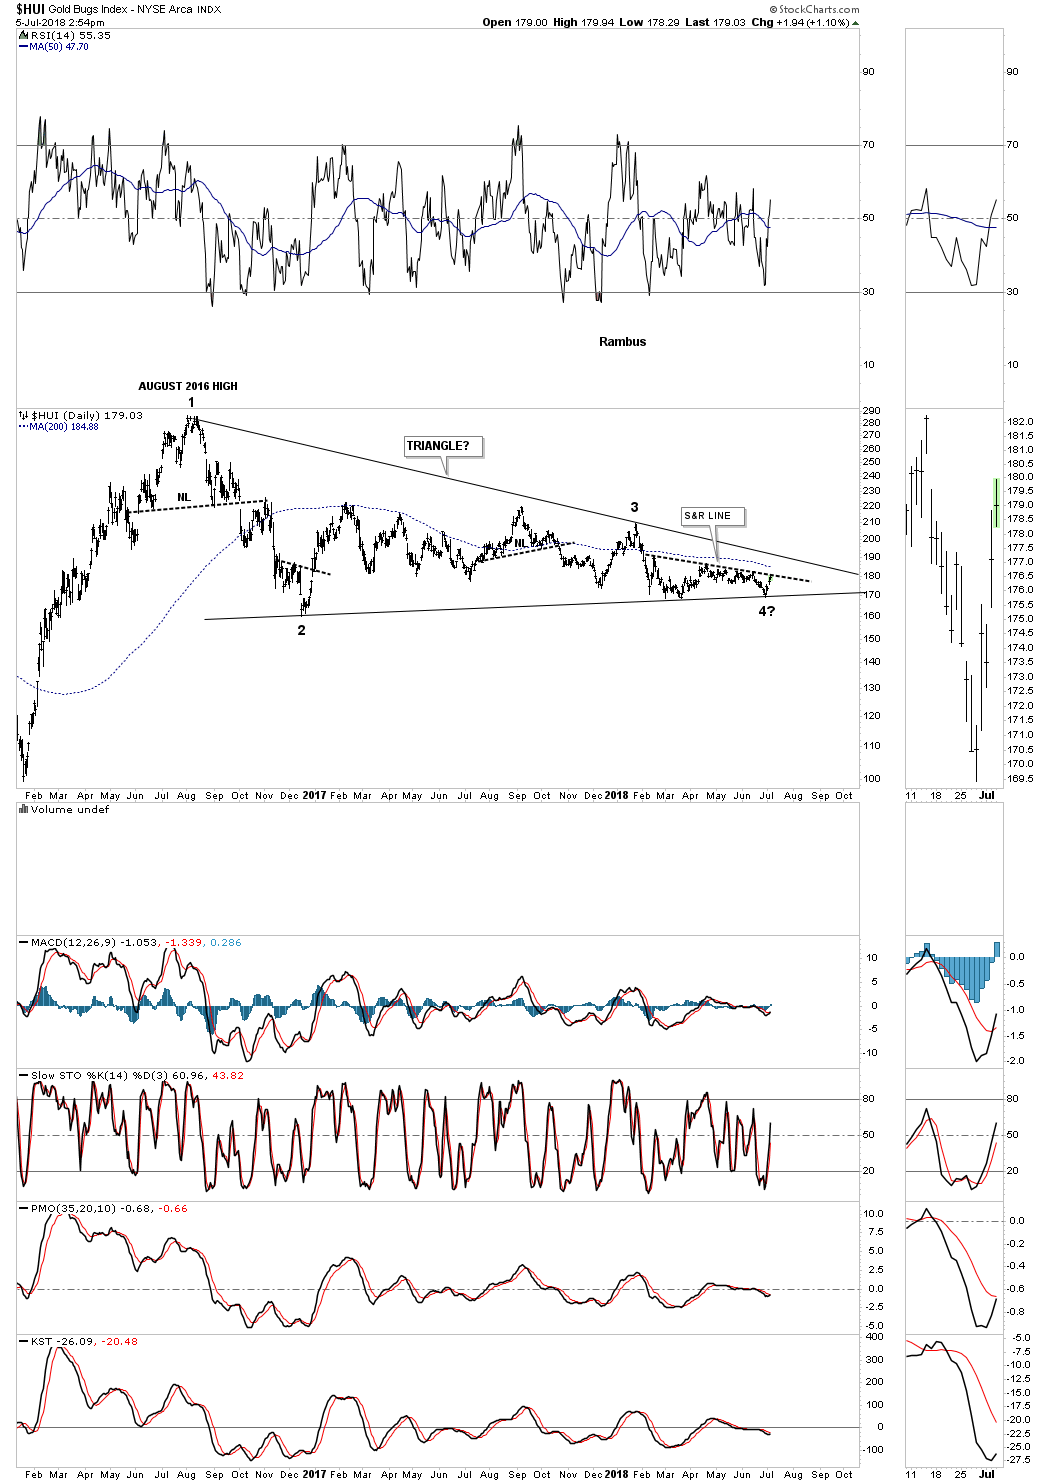
This next chart for the HUI is a long term daily look. If the HUI is putting in a long term bottom the perfect scenario would be to see the HUI breakout above the S&R line which is the top rail on the triangle above. Then maybe a ping pong move between the S&R line and the top rail of the 2 year triangle followed by a big breakout gap above the two year triangle which would then complete the fourth reversal point. From a Chartology perspective that would be the most bullish outcome we could expect. Let the games continue.