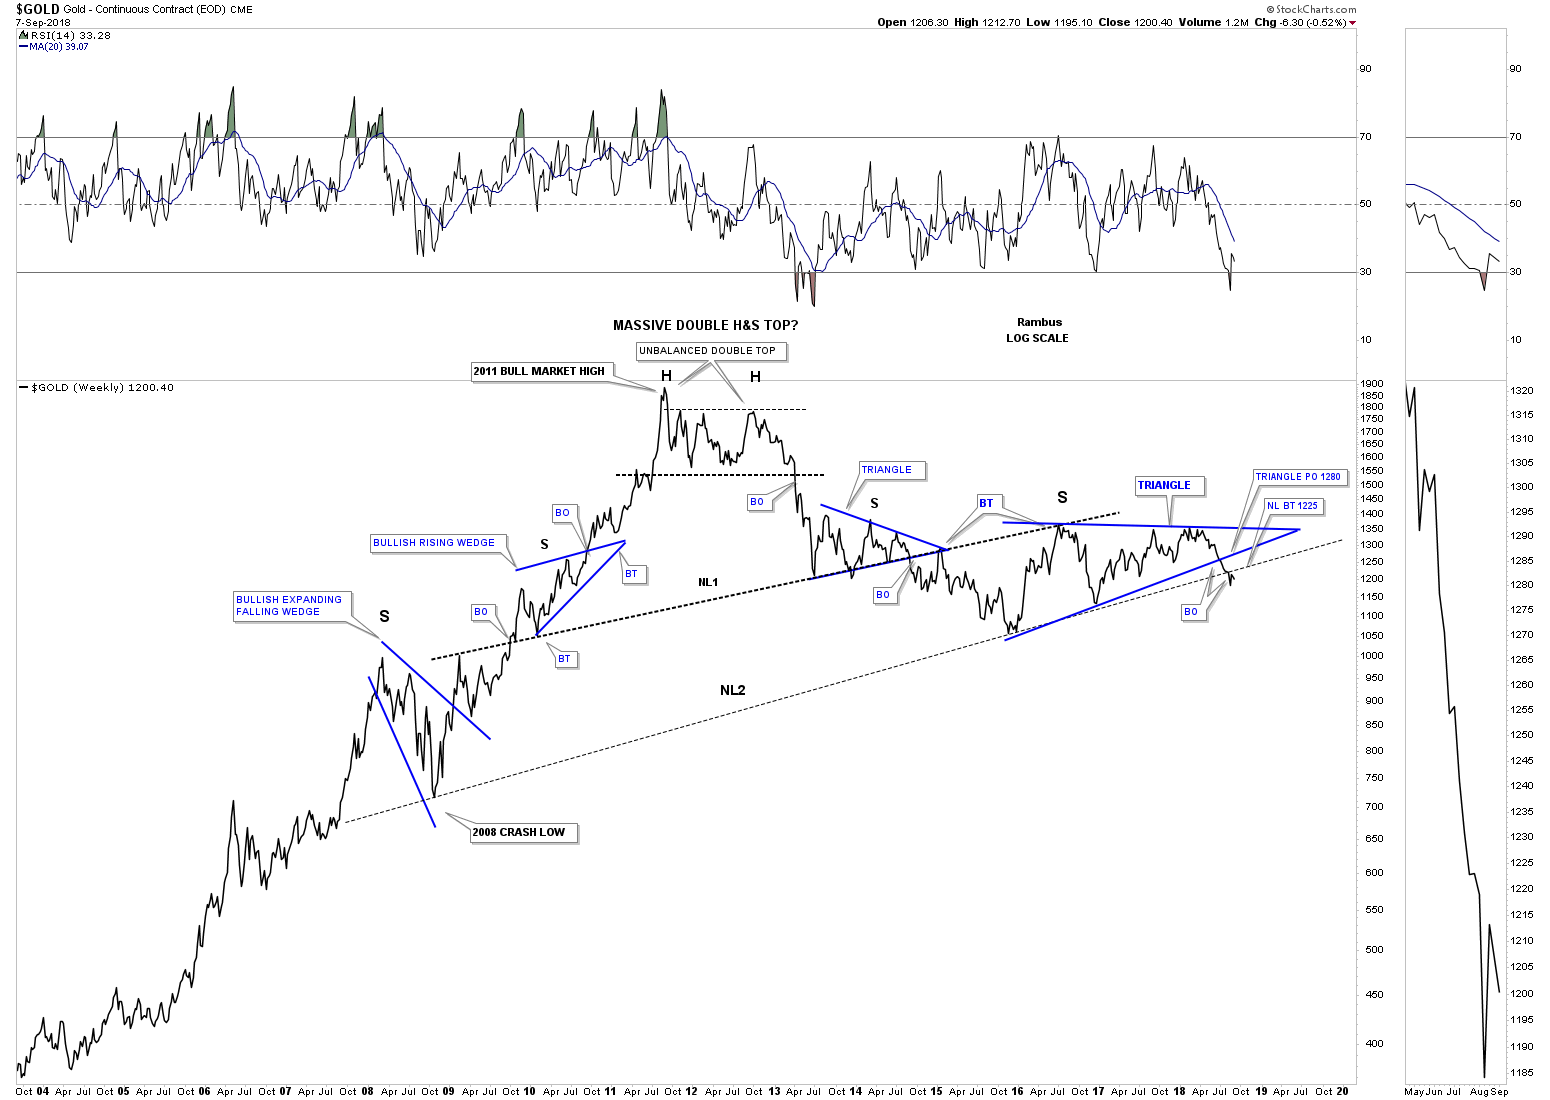
Tonight I would like to update some of the PM charts we’ve been following to see how they’ve been progressing starting with the massive ten year H&S top on gold. Since the price action broke below the neckline several weeks ago it’s a week to week observation to see how the backtest is playing out. The backtest to the neckline comes in around the 1225 area with this weeks high at 1212.70 so the backtest held for another week. What we need to see next for the current move lower to continue is to see a new weekly close below the previous weekly low.
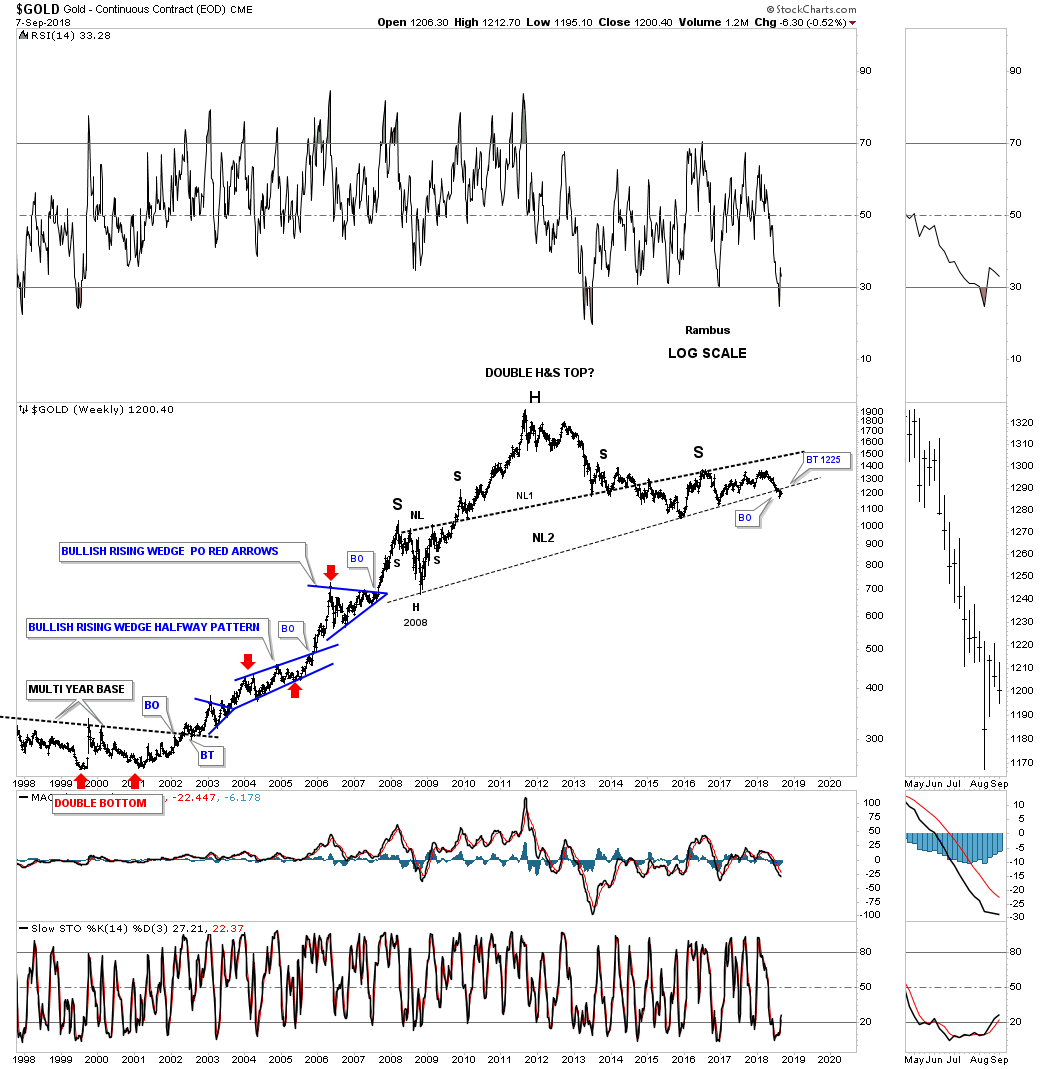
Below is a weekly bar chart for gold that goes all the way back to the beginning of the bull market in 2000.
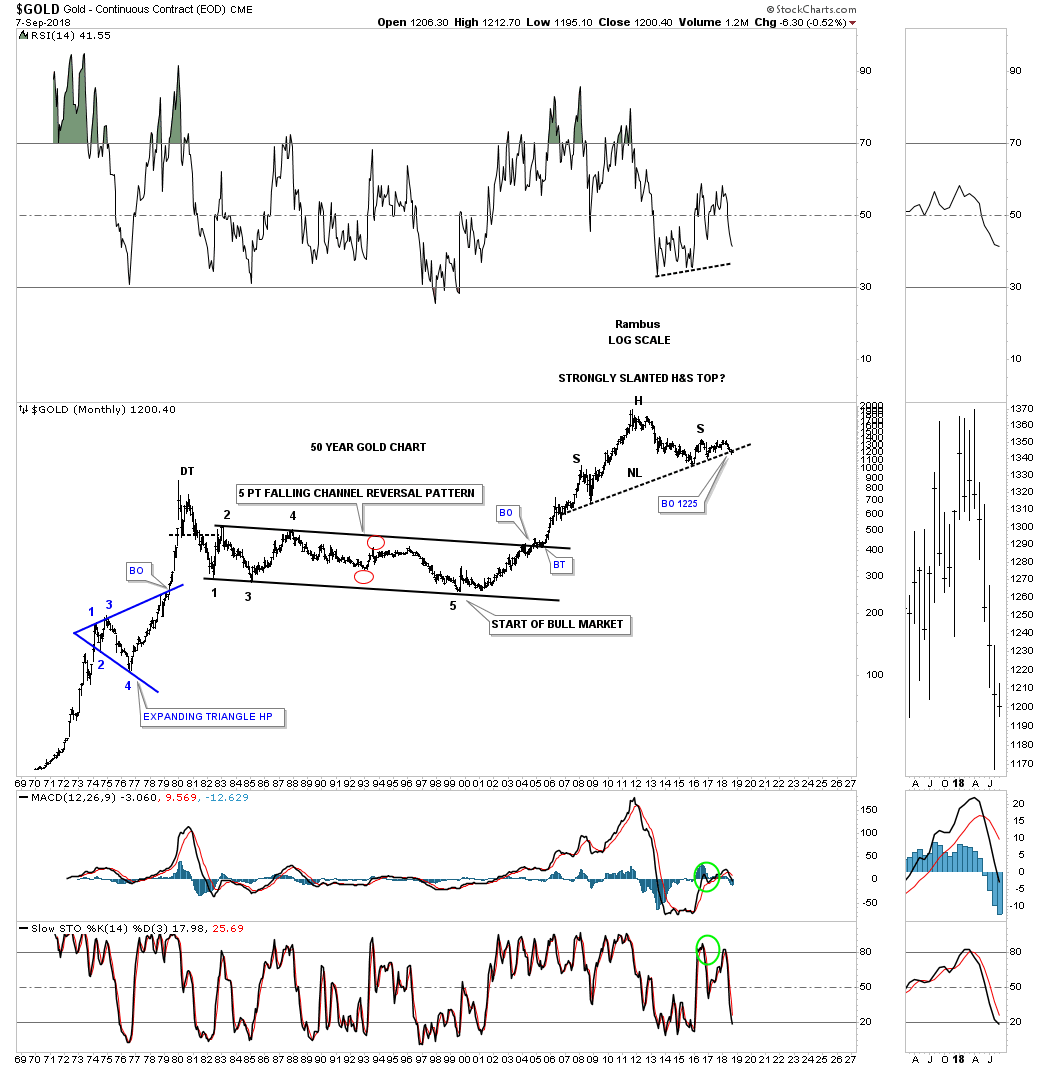
Next is the 50 year chart for gold which puts the ten year H&S top in perspecitive.
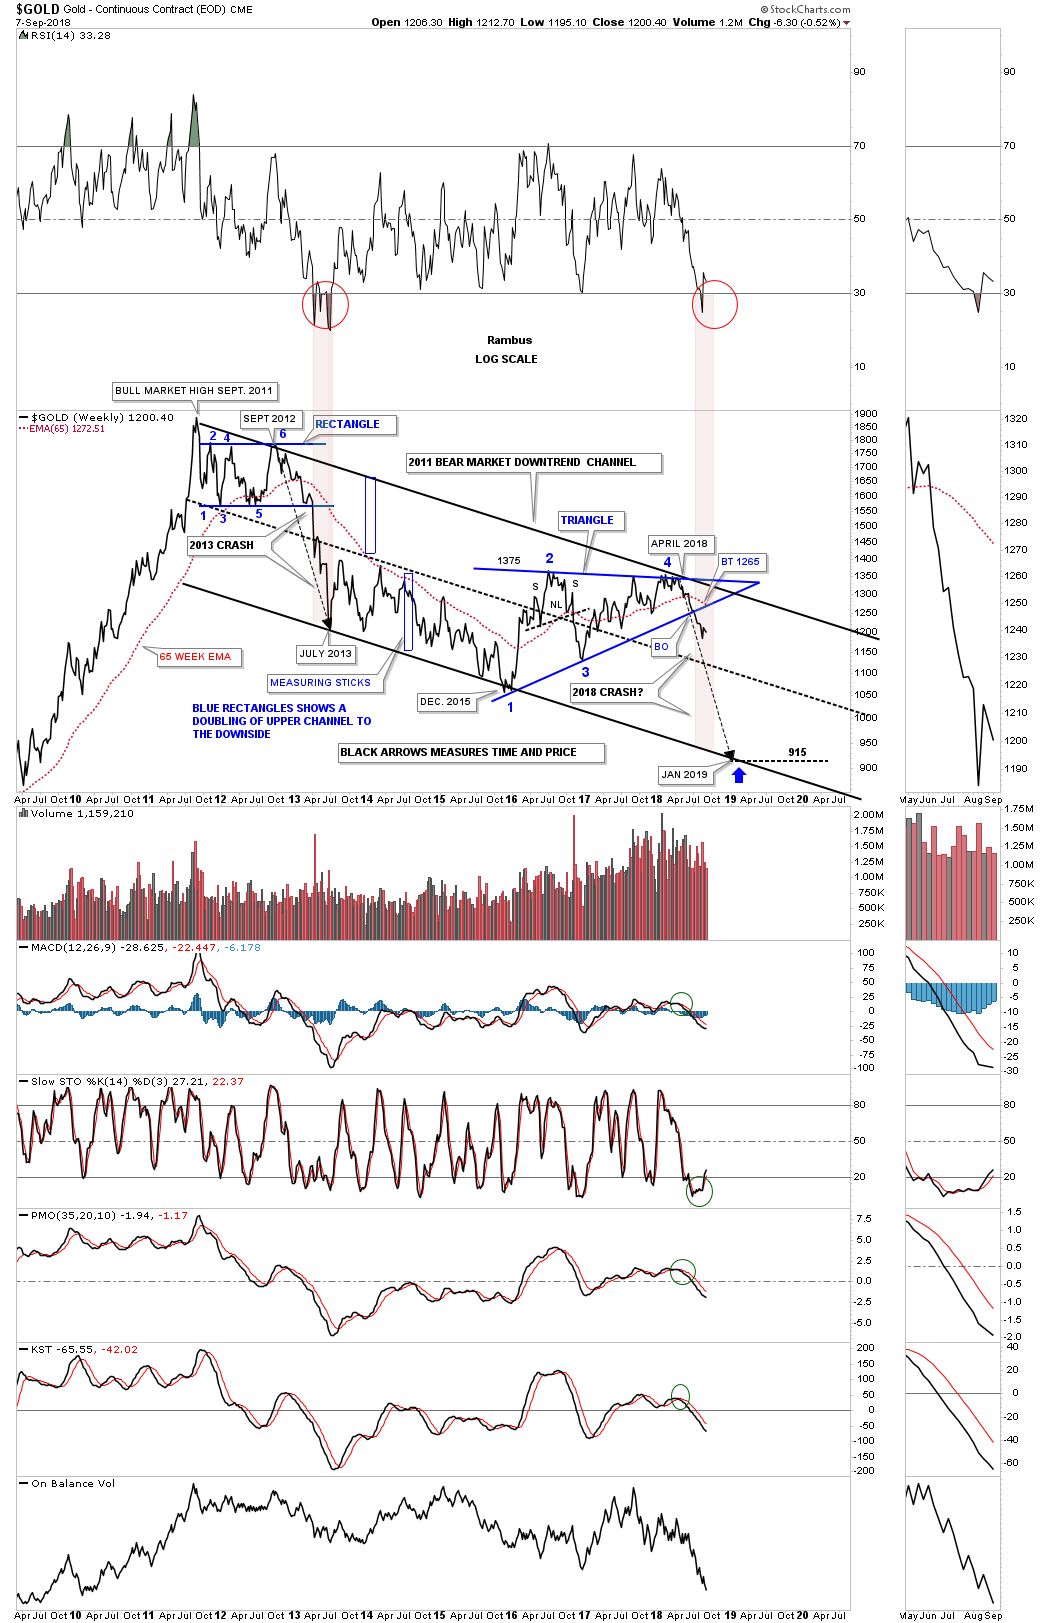
This next chart for gold is the weekly line chart which shows its 2011 bear market downtrend channel. Our current impulse leg down actually began in April of this year when the price action touched the top rail of the 2011 bear market downtrend channel and the top rail of the 2 1/2 year triangle. Currently the bottom rail of the 2 1/2 year triangle and the 65 week ema intersects at the 1270 area which would be maximum resistance.
Next is a short term daily chart for the GDX which shows the impulse move down from the February bearish rising wedge.

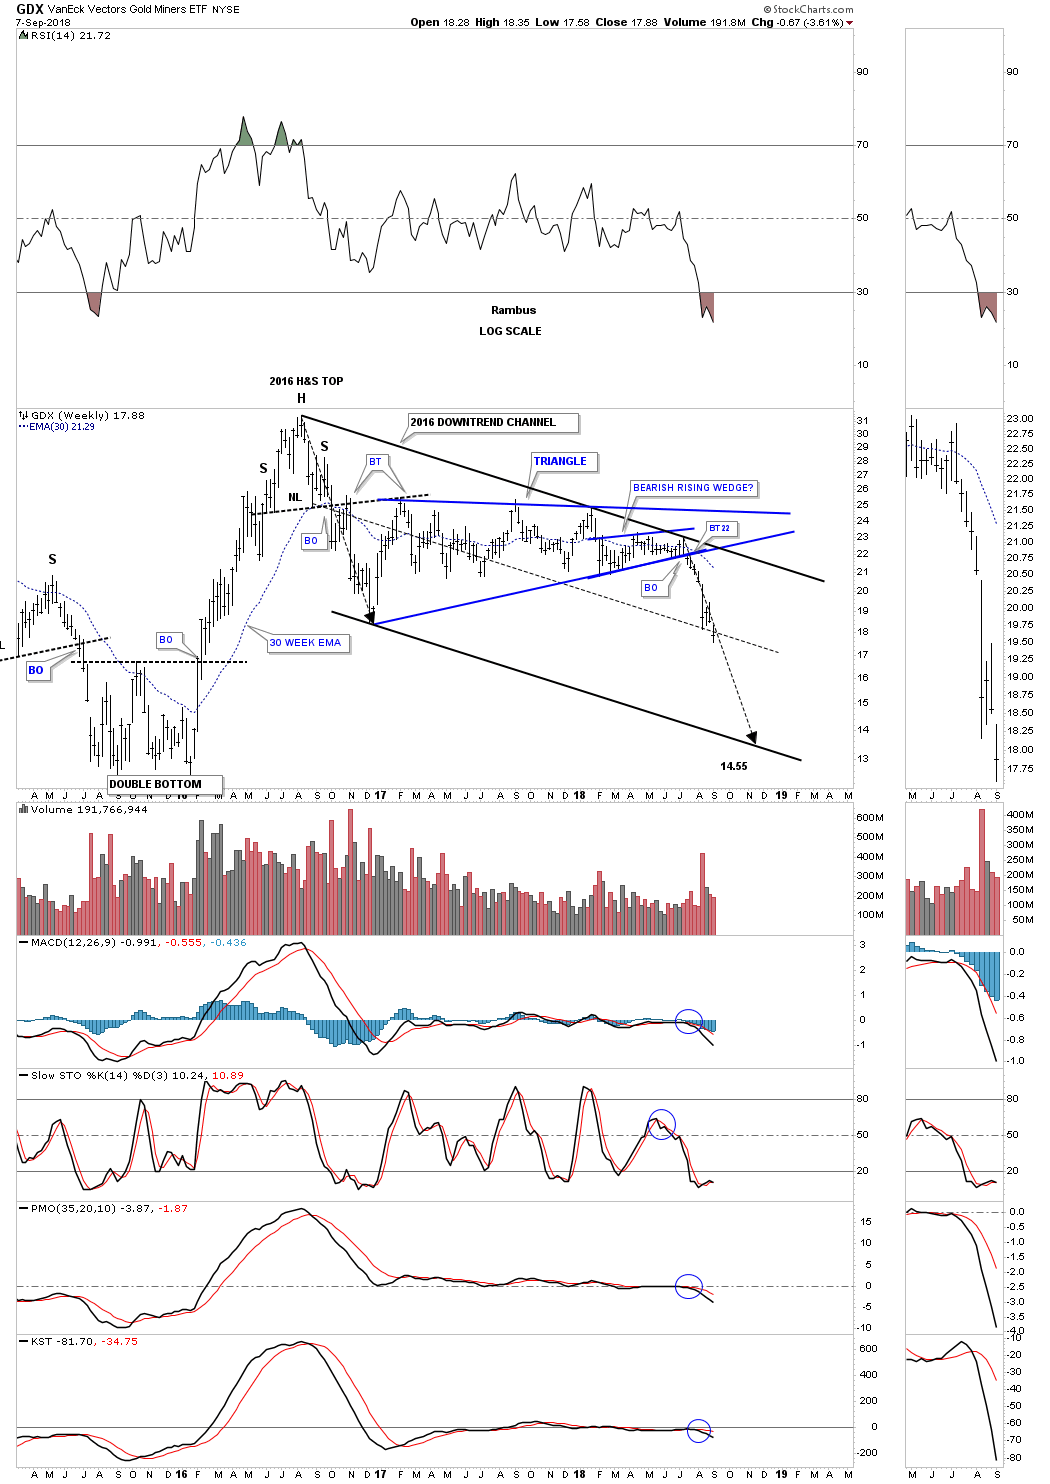
This next chart for the GDX shows three dominate chart patterns starting with the 2016 H&S top reversal pattern, the February bearish rising wedge we just looked at on the daily chart above and the 1 1/2 year triangle consolidation pattern. These three pattern are building out the 2016 downtrend channel we’ve been following. The black arrows show the 1 1/2 triangle as a halfway pattern with the first led down off the 2016 top and our current 2018 impulse leg down moving at the same angle lower so far.
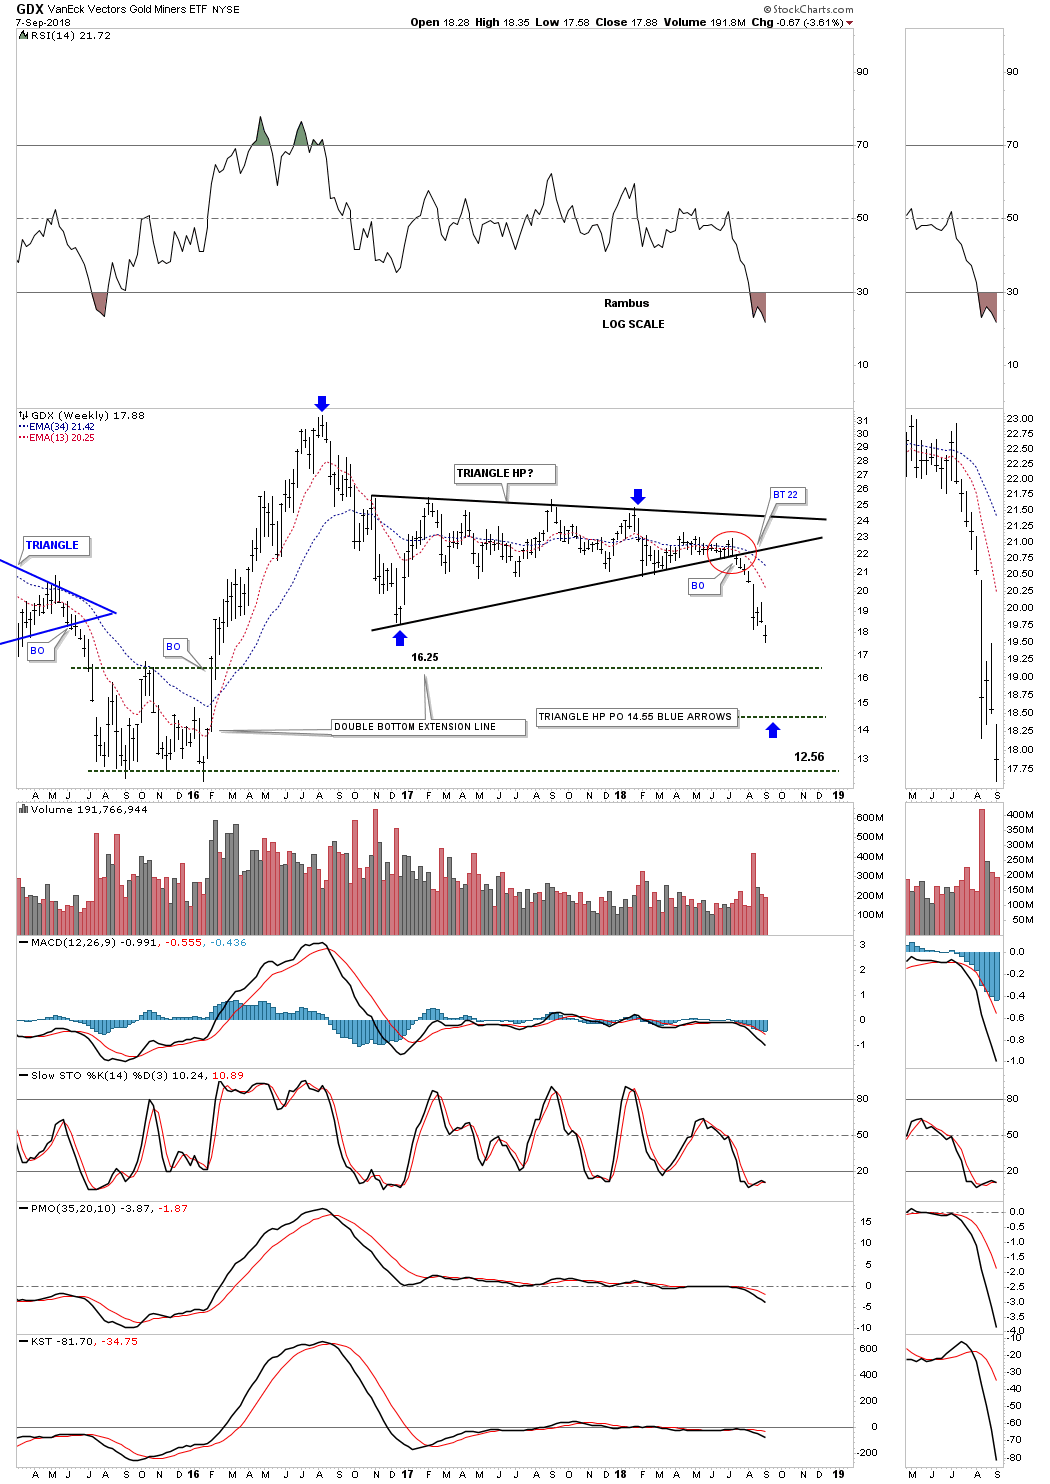
It’s hard to believe its been 8 weeks already since we looked at the breakout below the bottom rail of the year and a half triangle as shown by the red circle which showed a nice clean breakout. In 2015 when the GDX bottomed it built out a double bottom reversal pattern with the double bottom hump at the 16.25 area which might come into play as initial support. The HUI is already testing its 2015 double bottom hump currently.
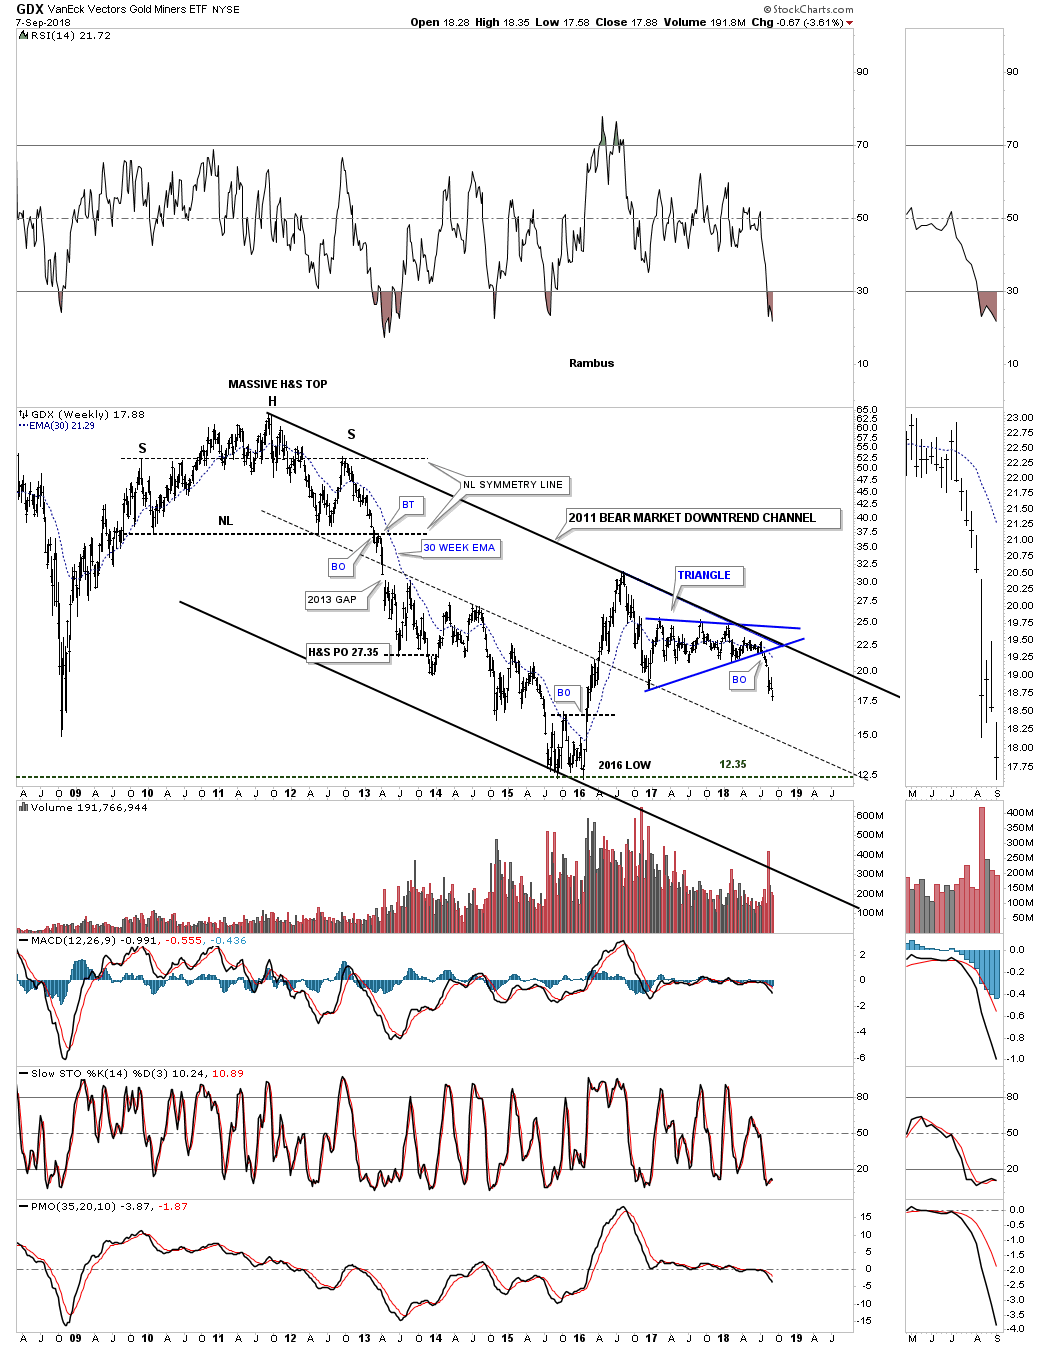
I wasn’t going to show you this last chart for the GDX because I don’t think the bottom rail of the 2011 bear market will ever be hit but the 2011 bear market downtrend channel is still firmly in place. The bear market began with the perfectly formed massive four year H&S top as shown by the neckline symmetry line. The breakout and backtest to the neckline was short and sweet with the infamous 2013 runaway gap showing up several weeks after the backtest was completed.
Initially we were looking at a possible bullish rising wedge that was forming on the US dollar. That pattern failed when the price action traded back down below the top rail which was disappointing, but there was still a good chance that we would see some type of rising pattern because the initial pattern was a rising wedge. The morphing process is still taking place which now looks like a possible bullish expanding rising wedge building out. Note the small H&S bottom building out at the 4th reversal point which should give the US dollar the energy it needs to at least rally back up to the top of the trading range.
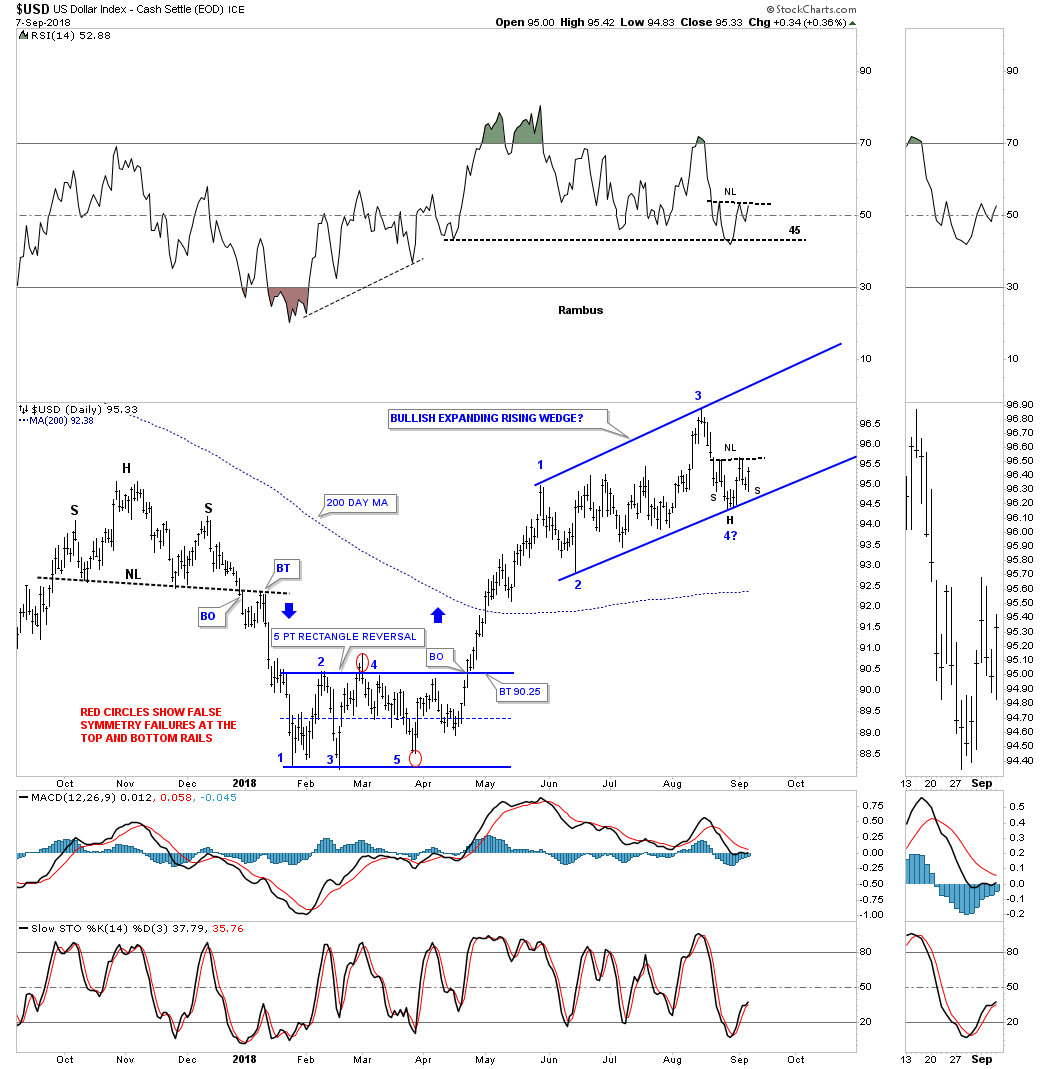
Here is what the possible bullish expanding rising wedge looks like on a longer term daily chart. I know it doesn’t feel like it right now but we know that when a pattern slopes up in the direction of the uptrend it shows a stock to be very strong. If this pattern plays out it’s telling us the US dollar is going to be very strong.
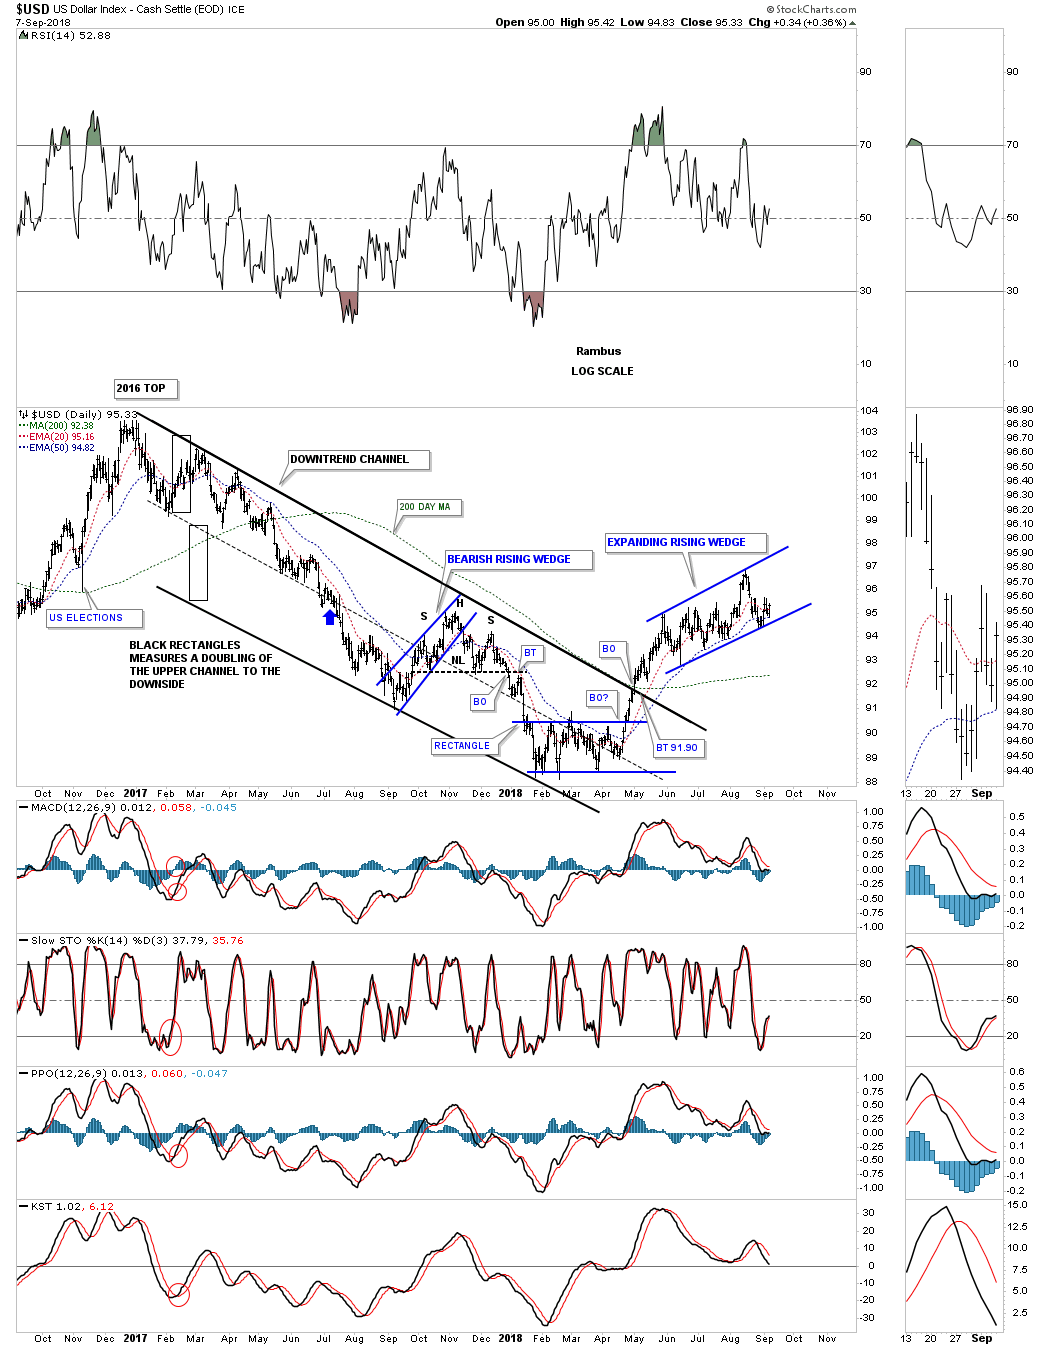
If gold has been trading in a bear market downtrend channel since 2011 then there is a good chance that the US dollar has been trading in a 2011 uptrend channel which this combo chart below shows.

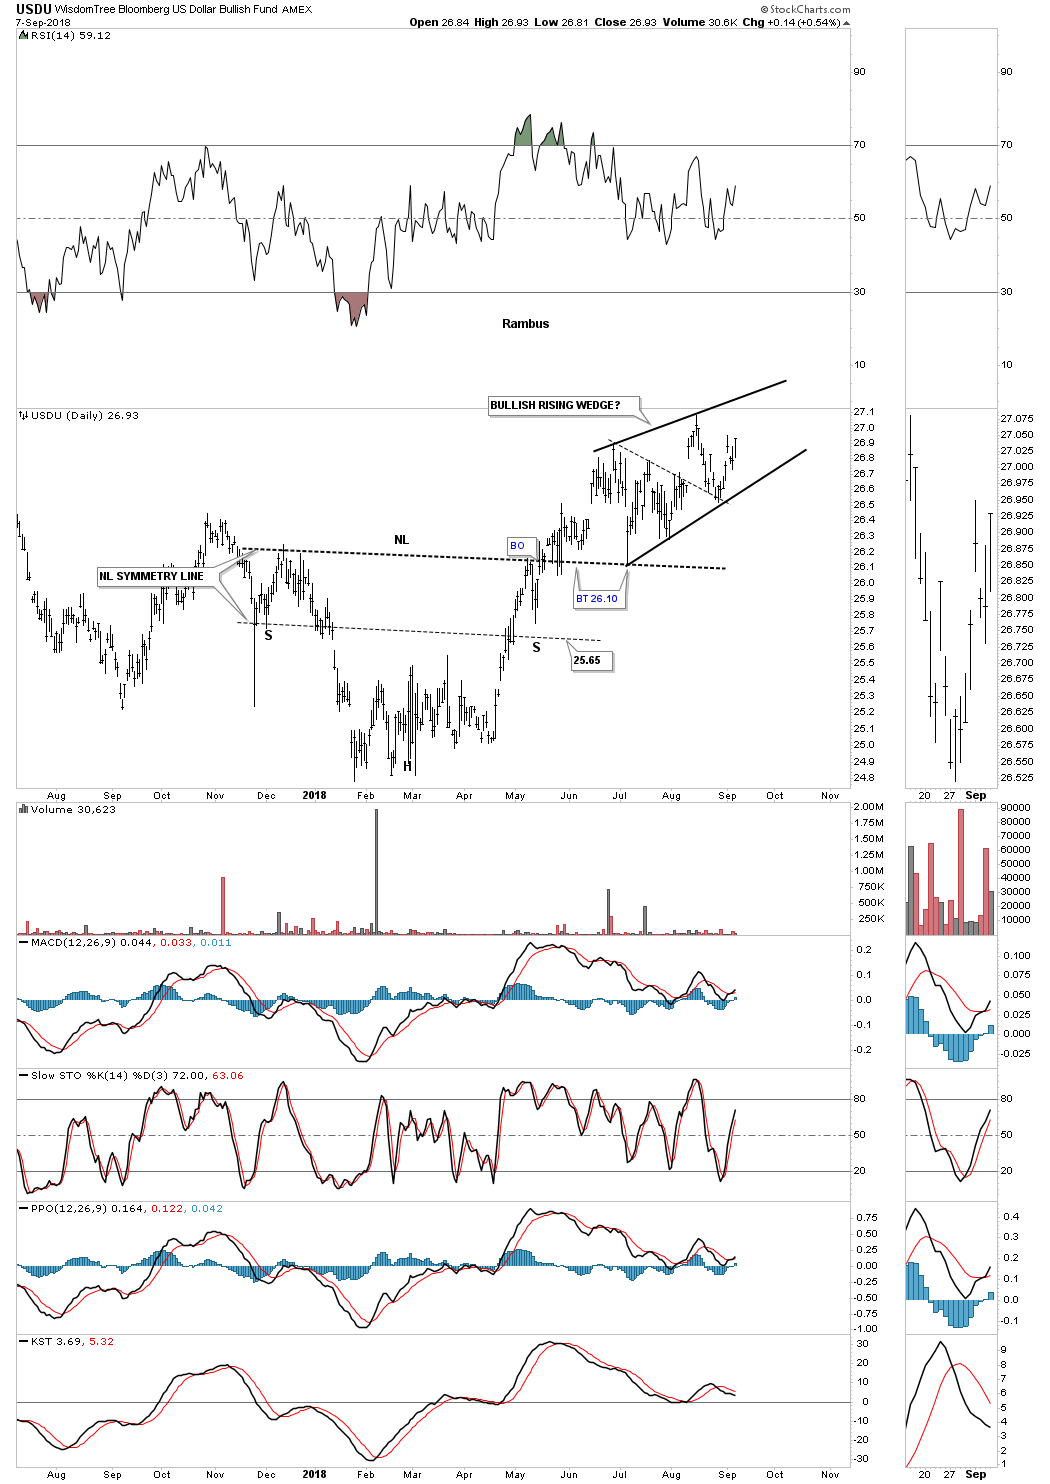
This last chart for tonight is a daily look at the USDU which is a more equally weighted index for the US dollar. The last time we looked at this chart the price action was building out a triangle above the neckline which was completed with a big breakout gap above the original top rail which is the black dashed line with a backtest. It now looks like the triangle is morphing into a bigger bullish rising wedge consolidation pattern. We’ll know more when the USDU trades up to the top rail and how it interacts with it. With most of the other important currencies of the world breaking down from their respective large consolidation patterns it makes perfect sense that the US dollar will have a strong impulse move to the upside. Have a great weekend and all the best…Rambus