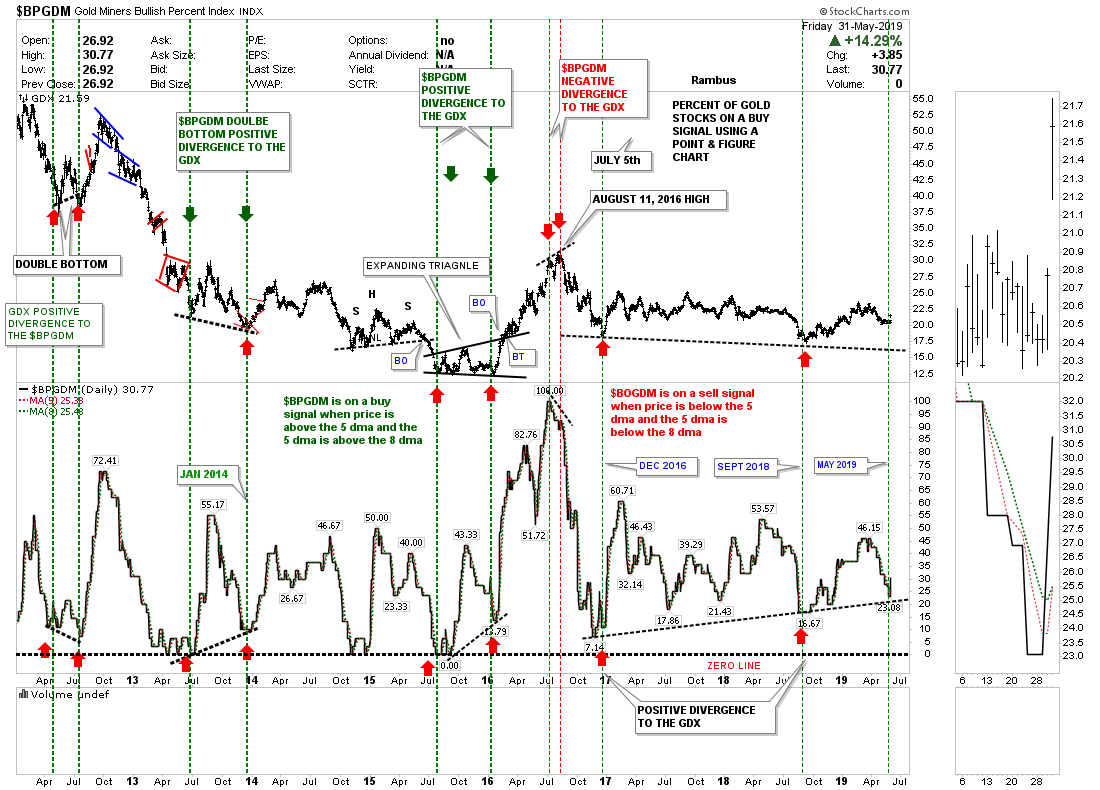
We’ve been following a possible positive divergence between the $BPGDM gold miners bullish percent index and the GDX. Back in December of 2016 both the $BPGDM and the GDX put in a short term bottom. The positive divergence began to show itself in September of 2018 when the GDX made a lower low vs its 2016 low while the $BPGDM made a higher low vs its 2016 low thus a positive divergence. Since the 2018 low both have been moving up together. During the December 2016 low on the $BPGDM there were 7.14 gold stocks on a buy signal. Then at the September 2018 low there were 16.67 gold stocks on a buy signal. At its most recent low the $BPGDM had 23.08 gold stocks on a buy signal.
On Friday of this week the $BPGDM gave us a new buy signal when the $BPGDM crossed above the 5 day sma and the 5 day sma crossed above the 8 day sma. Have a great weekend. All the best…Rambus