
This is a condensed version of Rambus Weekend Report. There are over 20 individual PM stocks individually updated in the full version.
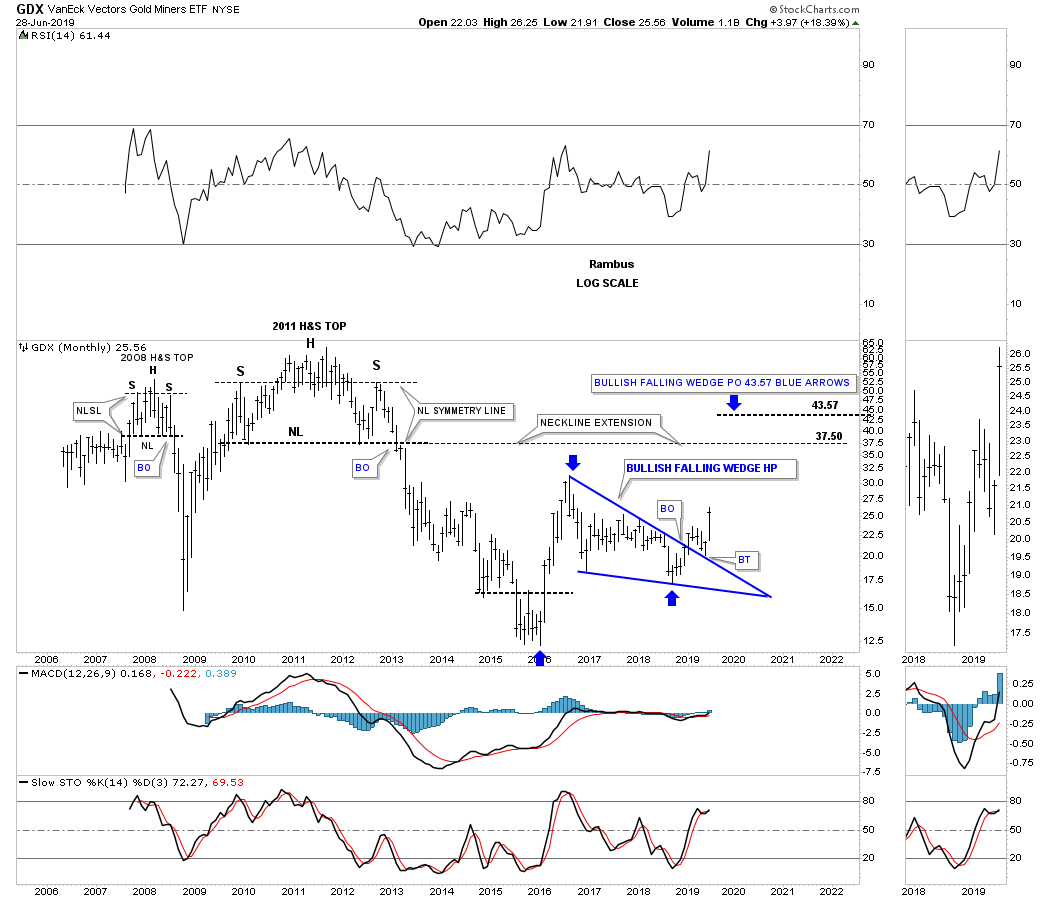
I would like to start out this Weekend Report by looking at a long term monthly chart for the GDX. The multi year bear market actually began in September of 2011 at the head portion of the 3 1/2 year H&S top. The H&S top actually began to form in September of 2009 and ended in February of 2013 when the price action broke below the neckline. From that point the GDX declined for the next three years in its bear market so from a technical perspective the GDX ended its bear market in January of 2016 which marked its all time low.
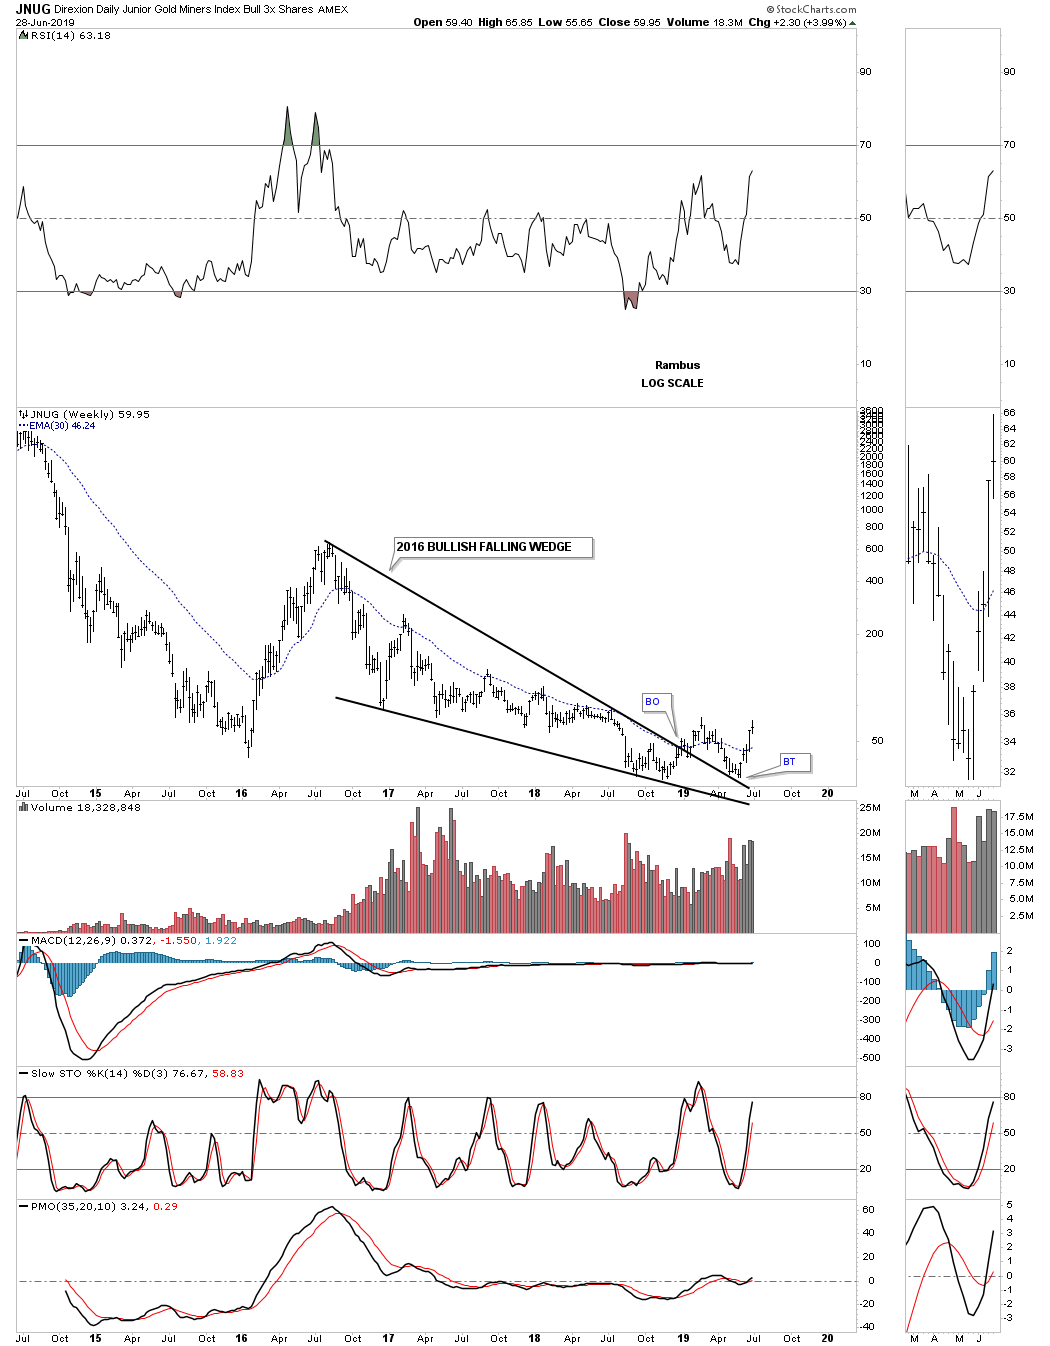
The rally out of the 2016 low lasted seven months and ended in September of the same year. After a strong impulse move like that one looks for the price action to consolidate its gains before moving higher. There was no way to know at the time what trading range would develop and how long it will take to complete. Now in hindsight we can see the GDX built out the 2016 bullish falling wedge, that we’ve been following for well over a year, which took two years to complete from the August 2016 high to the September 2018 low. It wasn’t until the breakout above the top rail of the 2016 bullish falling wedge and the completion of the backtest two months ago in May that we had significant confirmation that the bear market that began in September of 2011 was officially over.
Now that we know the bear market is officially over depending on what matrix you want to use, calling the 2016 low the beginning of the new bull market or the completion of the backtest to the top rail of the 2016 bullish falling wedge in May of this year the completion, the bottom line is that it’s time to start thinking in bull market terms leaving the bear market logic behind.
After five months of the breaking out and backtesting process out of the way the GDX has created a new high this month keeping the new uptrend intact. So if we are going to start playing by bull market rules we can now do a measured move to see how high the power of the 2016 bullish falling wedge can take the GDX. The measured move I’m showing on this weekly chart is called an impulse measured move which measures each half of the impulse move with the 2016 falling wedge being the halfway pattern. The first two blue arrows measure the first impulse leg up from the 2016 low to the August 2016 high. The second set of blue arrows on the right side of the 2016 falling wedge measures the second impulse move which has a price objective up to the 43.57 area.
There is also another important area of resistance that might come into play and that is the old neckline from the 2011 H&S top, labeled neckline extension, which will come into play around the 37.50. The bottom line is that the PM complex is in its second impulse leg higher which will look clear as a bell when we look back in hindsight. As I’ve mentioned previously the hardest thing to do during an impulse move is to do, NOTHING.
I’ve spent all weekend updating and annotating all the stock in the, Gold Stocks Portfolio, so you can see how things are coming along. There will be three charts for each PM stock, daily, weekly, and monthly which will show you the reasons I picked these stocks to start with. As this new impulse move continues to move higher I may tweak some of the weaker PM stocks for some that are showing more strength, but for now I’m content to stick with the original portfolio.
When looking at each individual stock, note how the daily shorter term charts will show many small H&S bottoms and double bottoms that have or are forming at the last reversal point in the bigger 2016 patterns. The weekly charts will show you the dominate chart pattern which is the 2016 bullish falling wedge with a few triangles. The long term monthly charts should put the new bull market in perspective with many of the PM stocks building out some very large consolation patterns.
There are many different ways to play the PM stocks. Some investors like to stick to the big cap producers as they will perform well during the bull market but won’t give you the leverage and is a safer play. Some will gravitate toward the Royalty stocks that usually do very well in a bull market as Sir Plunger has done.
As for me, after trading the bull market before the 2008 crash, I found that in a bull market the tide lifts all boats, some higher than others, but in general most get lifted. Even some of the juniors that from a fundamental perspective don’t look that good on paper can still rise with the tide. There is no other place in the markets that offers a chance for leverage to the degree some of the PM juniors will show during their bull market. To get that leverage one has to buy them cheap before they explode higher knocking down your leverage. This strategy is much riskier than buying your safer PM stocks but if you can get several to really take off it will make up the difference for the ones that don’t play out as you expected.
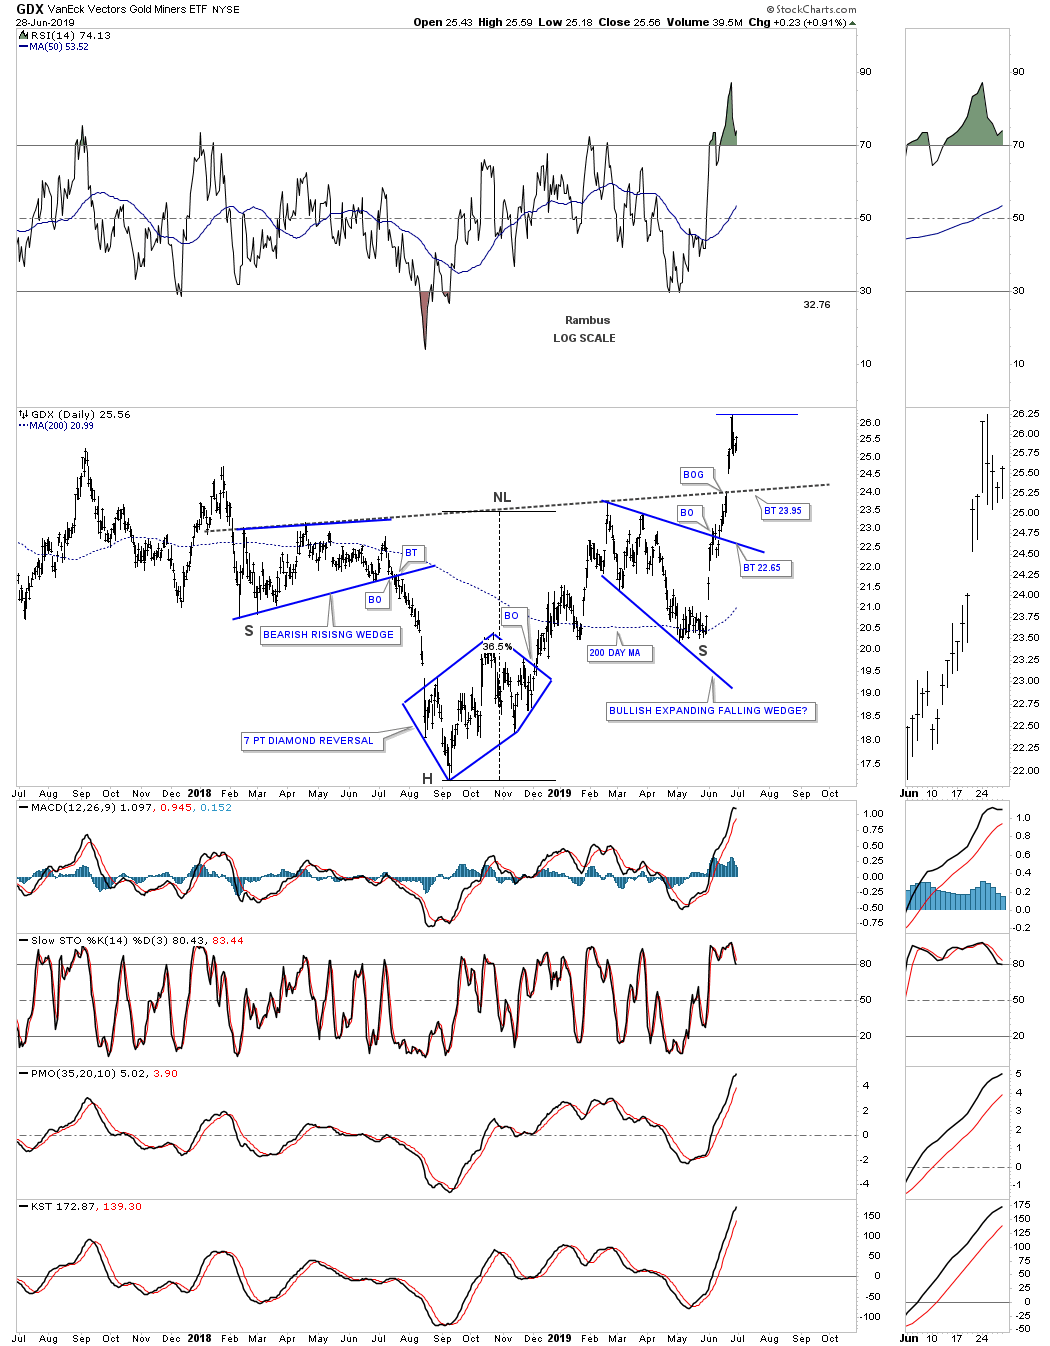
Before I finish I want to make if perfectly clear that we could see a backtest take place on the GDX to the one and a half year old neckline that would come into play around the 23.95 area.
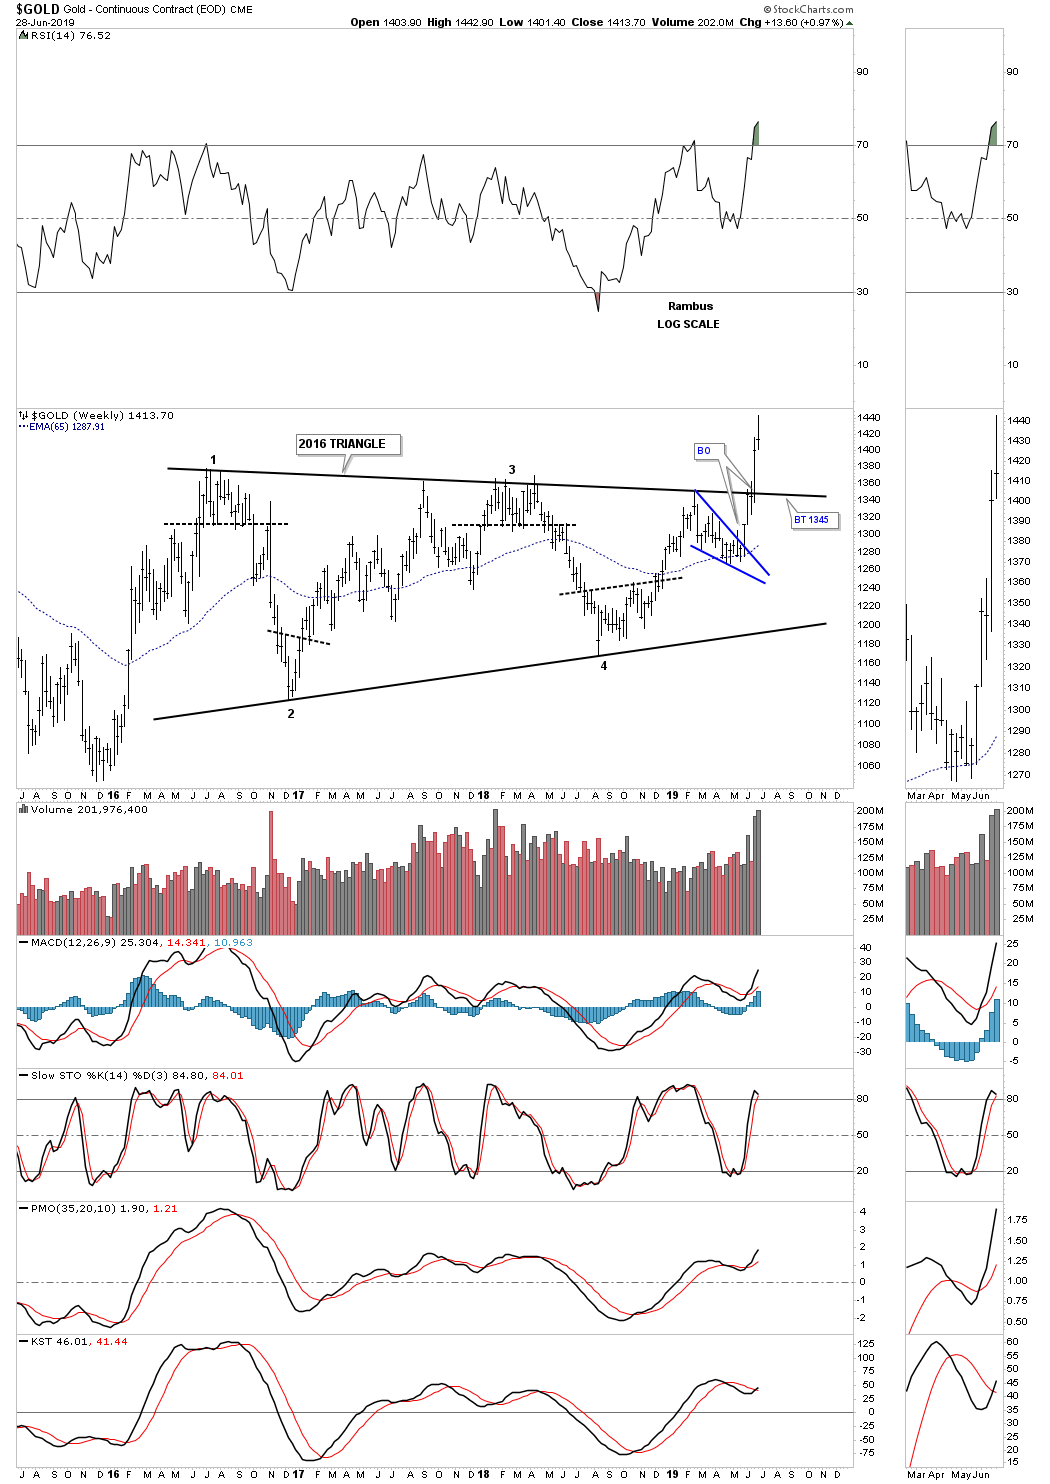
A backtest to the top rail on gold’s 2016 triangle would come into play around the 1345 area.
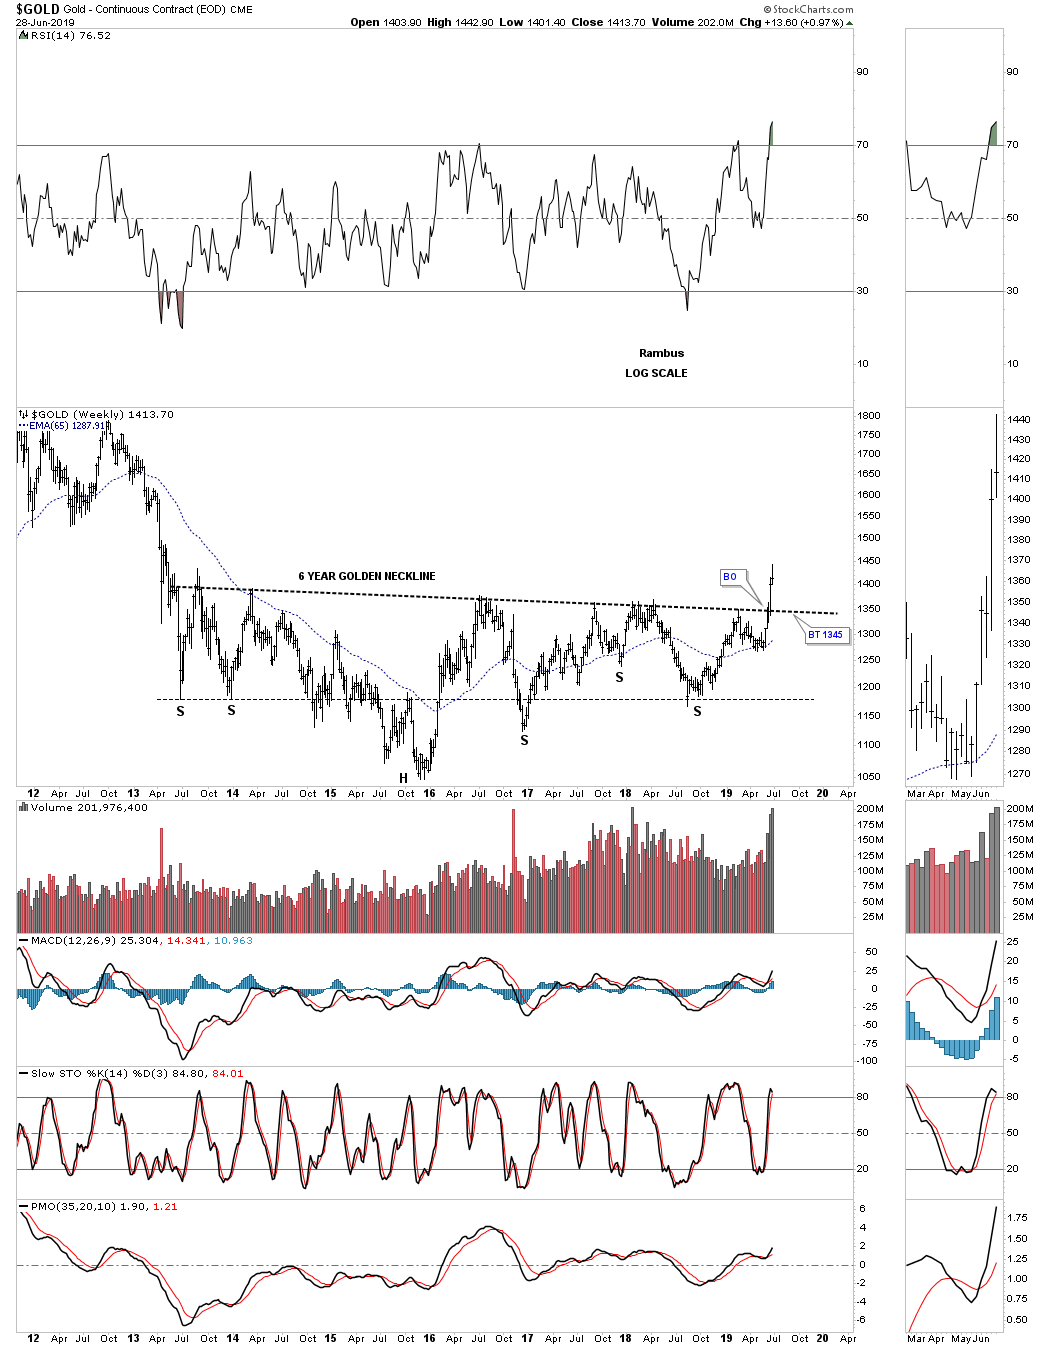
A backtest to the 6 year golden neckline would come in around the 1345 area.
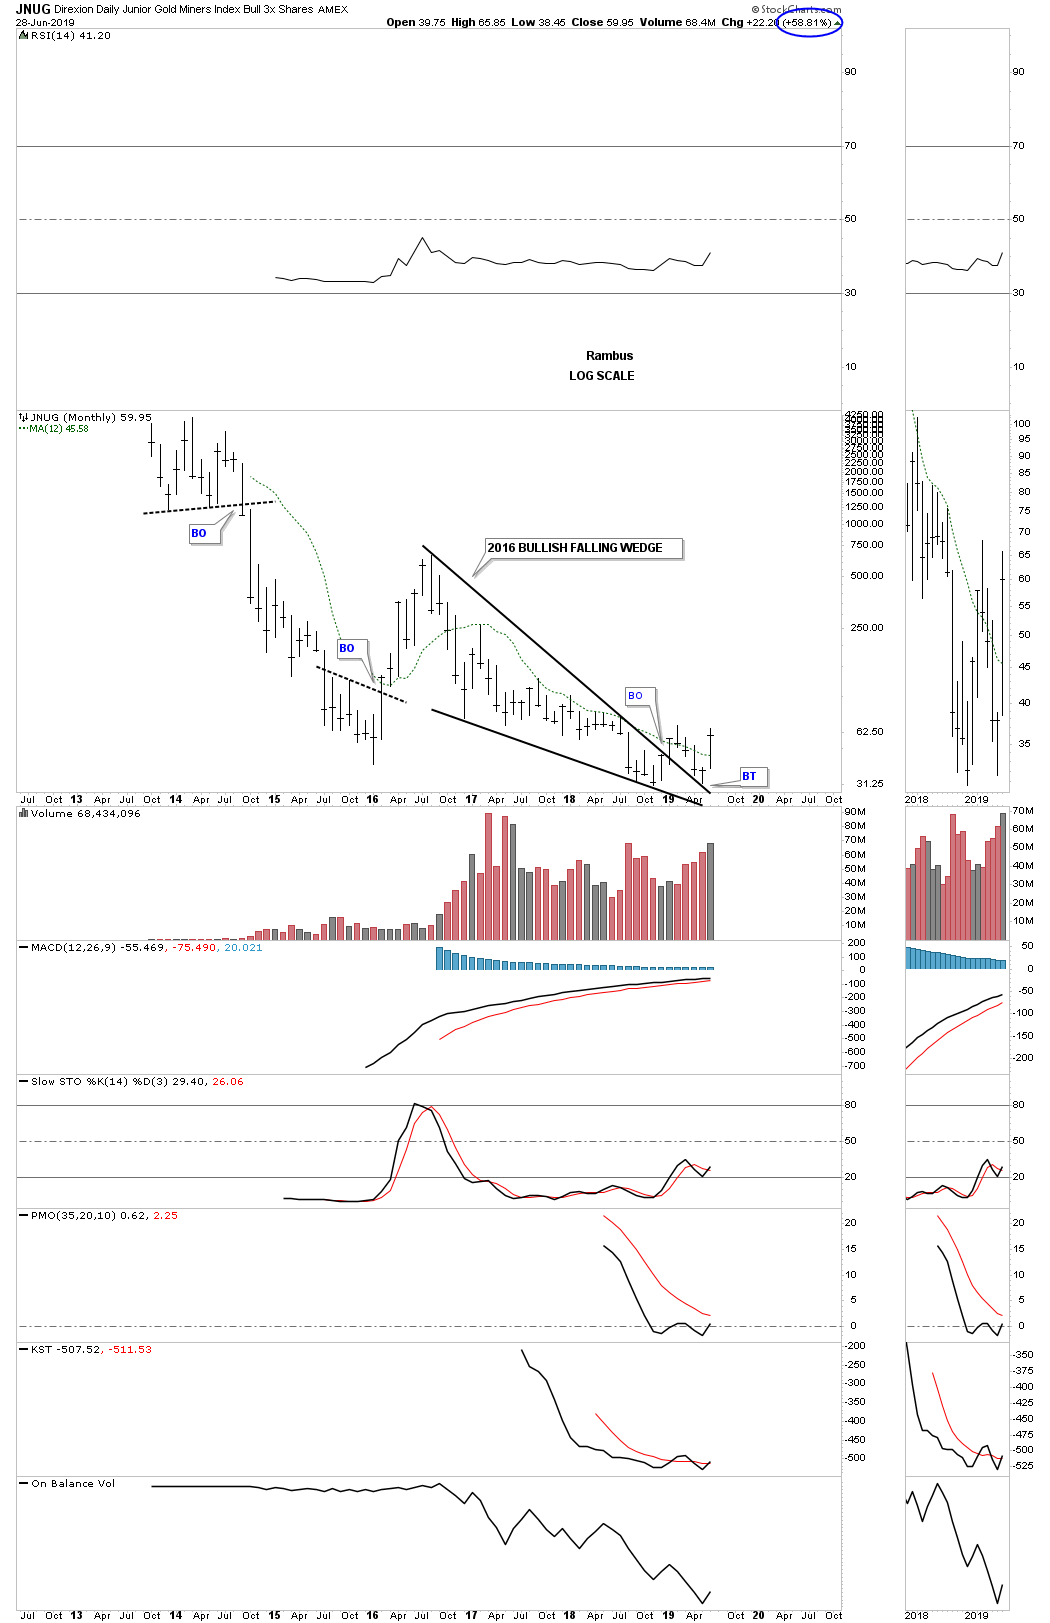
On the portfolio stocks below I’ve added a blue circle to the monthly charts that shows up in the top right hand corner of the chart, which shows what each stock did for the month of June on a percentage basis. I’ve also got the, Gold Stocks Portfolio, updated on the sidebar, with these stocks to follow. Everything should now be up to date. All the best…Rambus
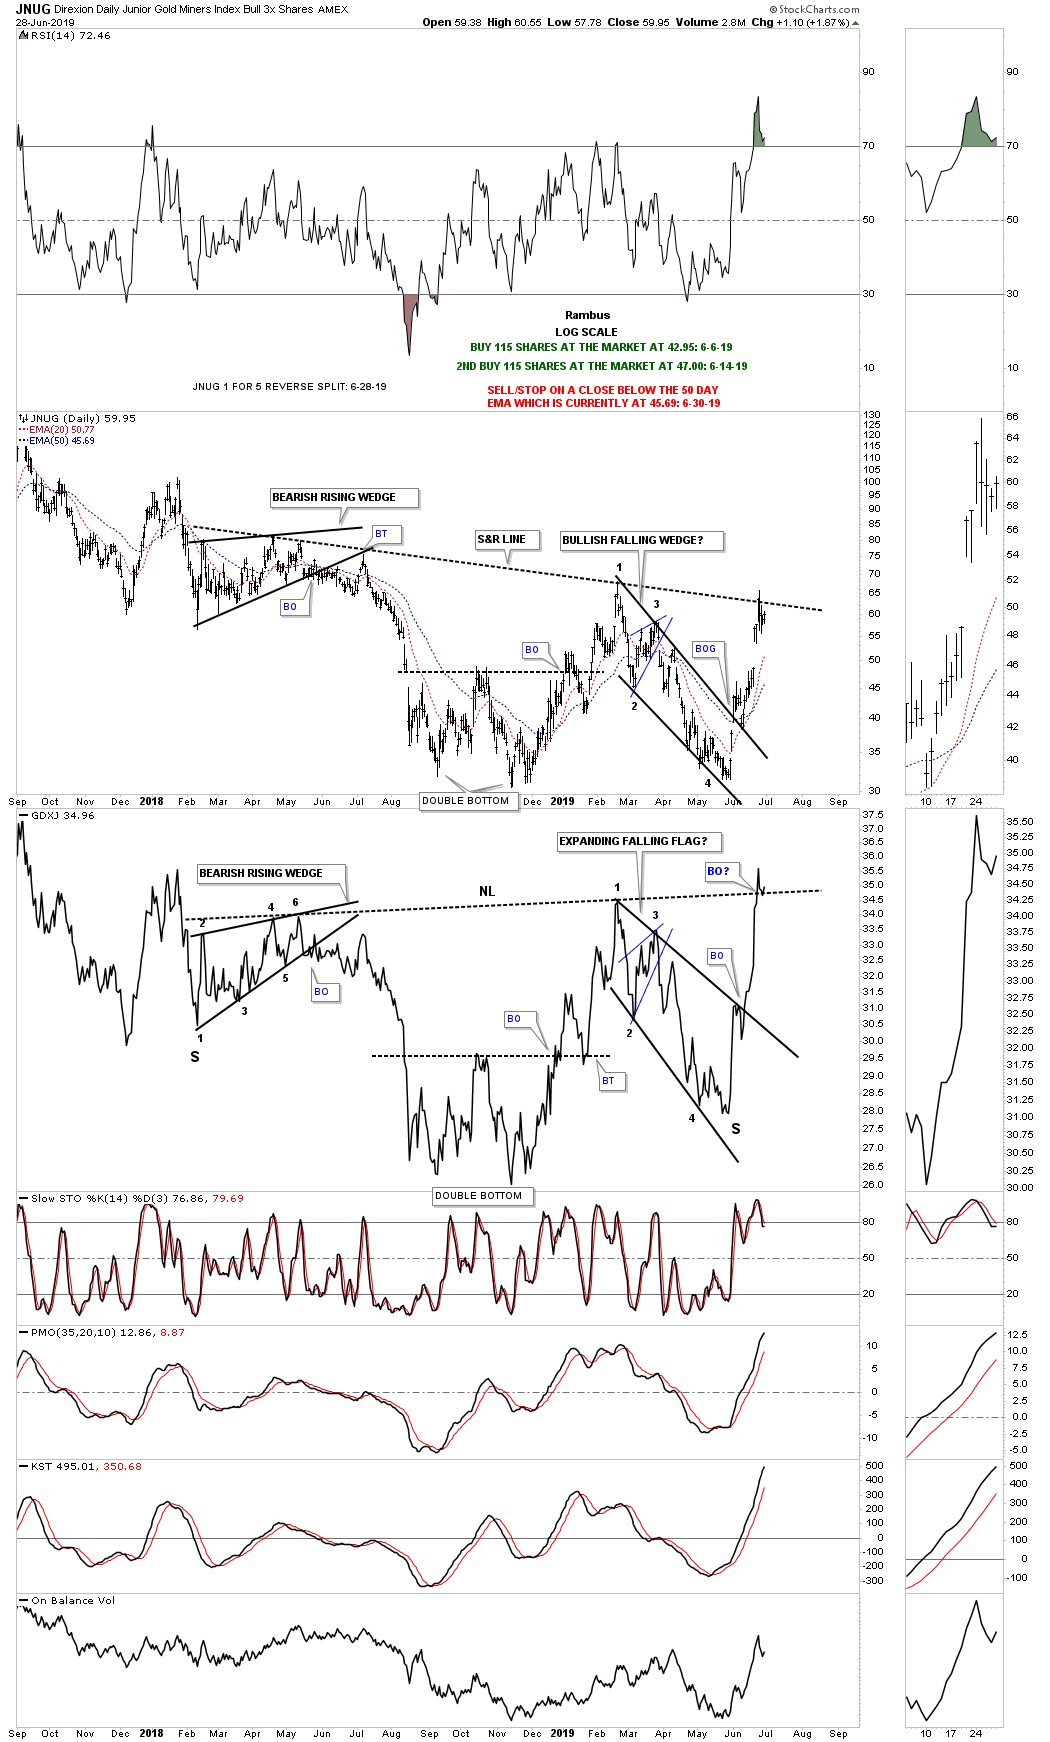
JNUG 6-30-19 Update: 5 for 1 reverse split on 6-28-19. Daily.
JNUG weekly:
JNUG monthly:
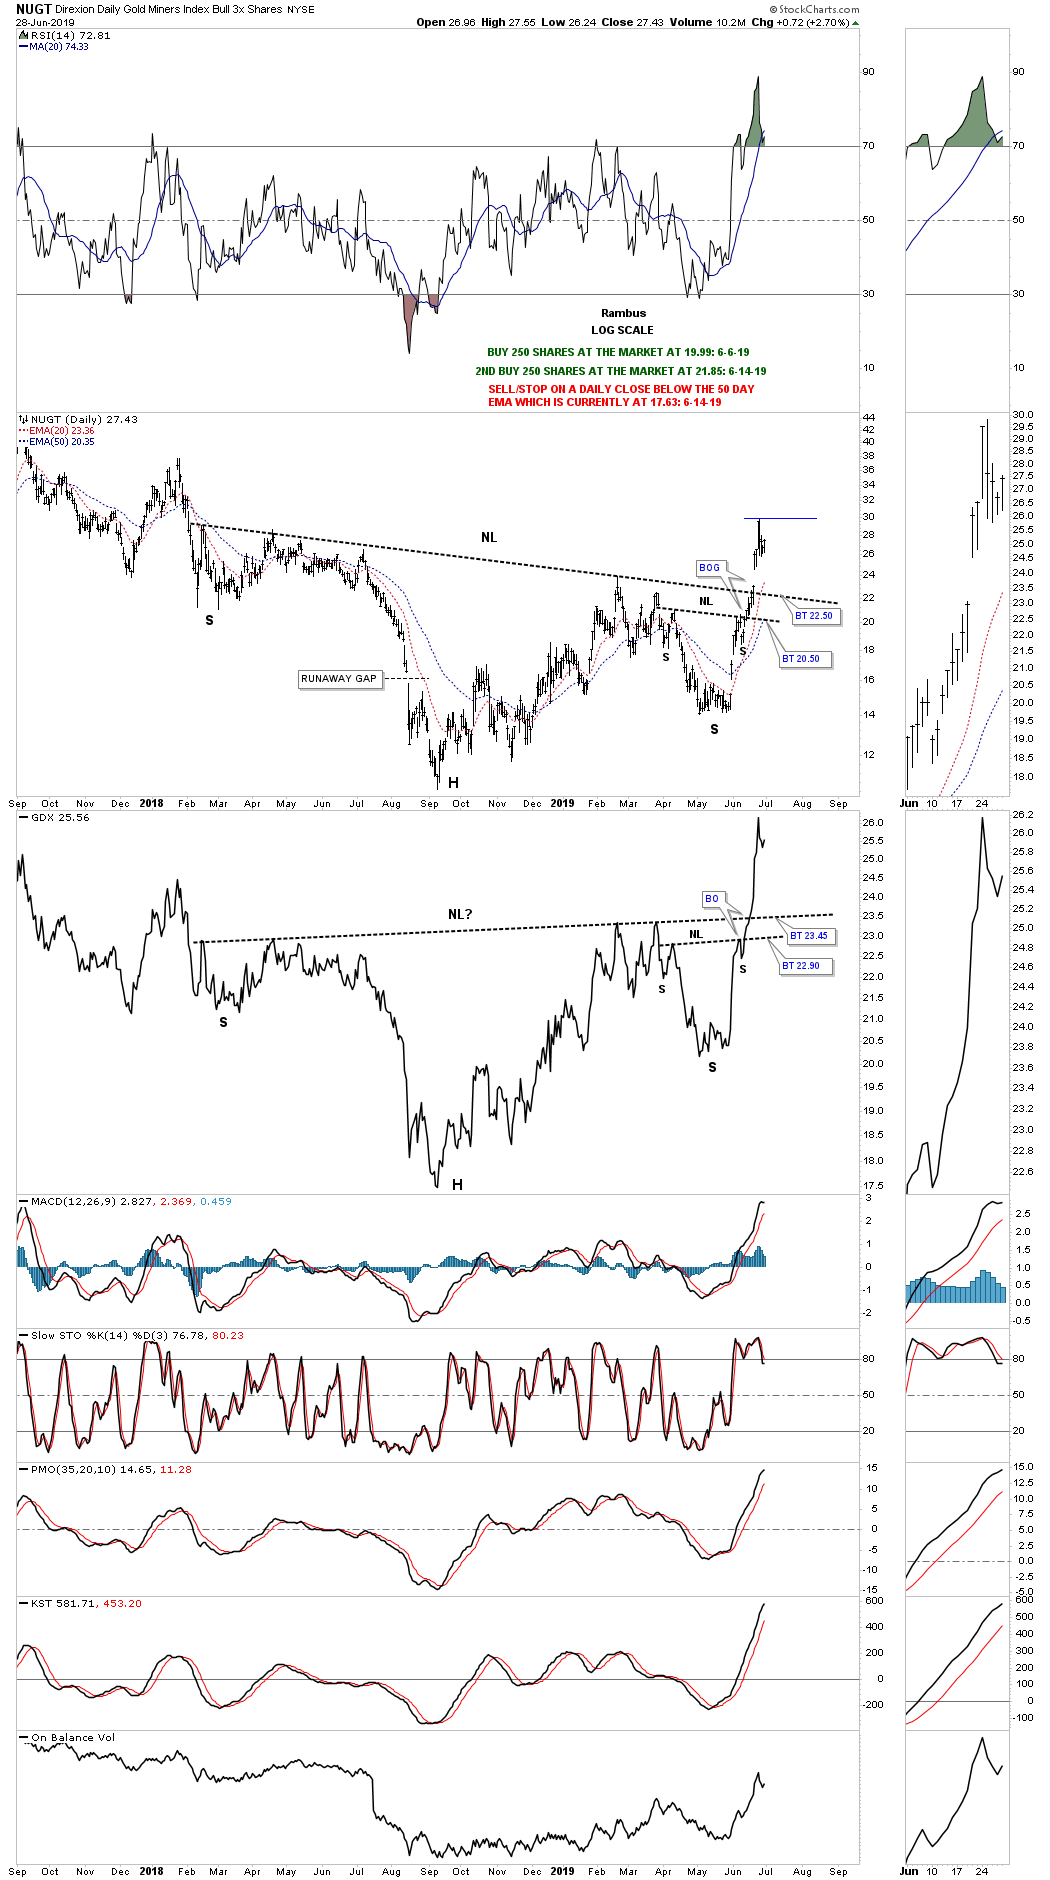
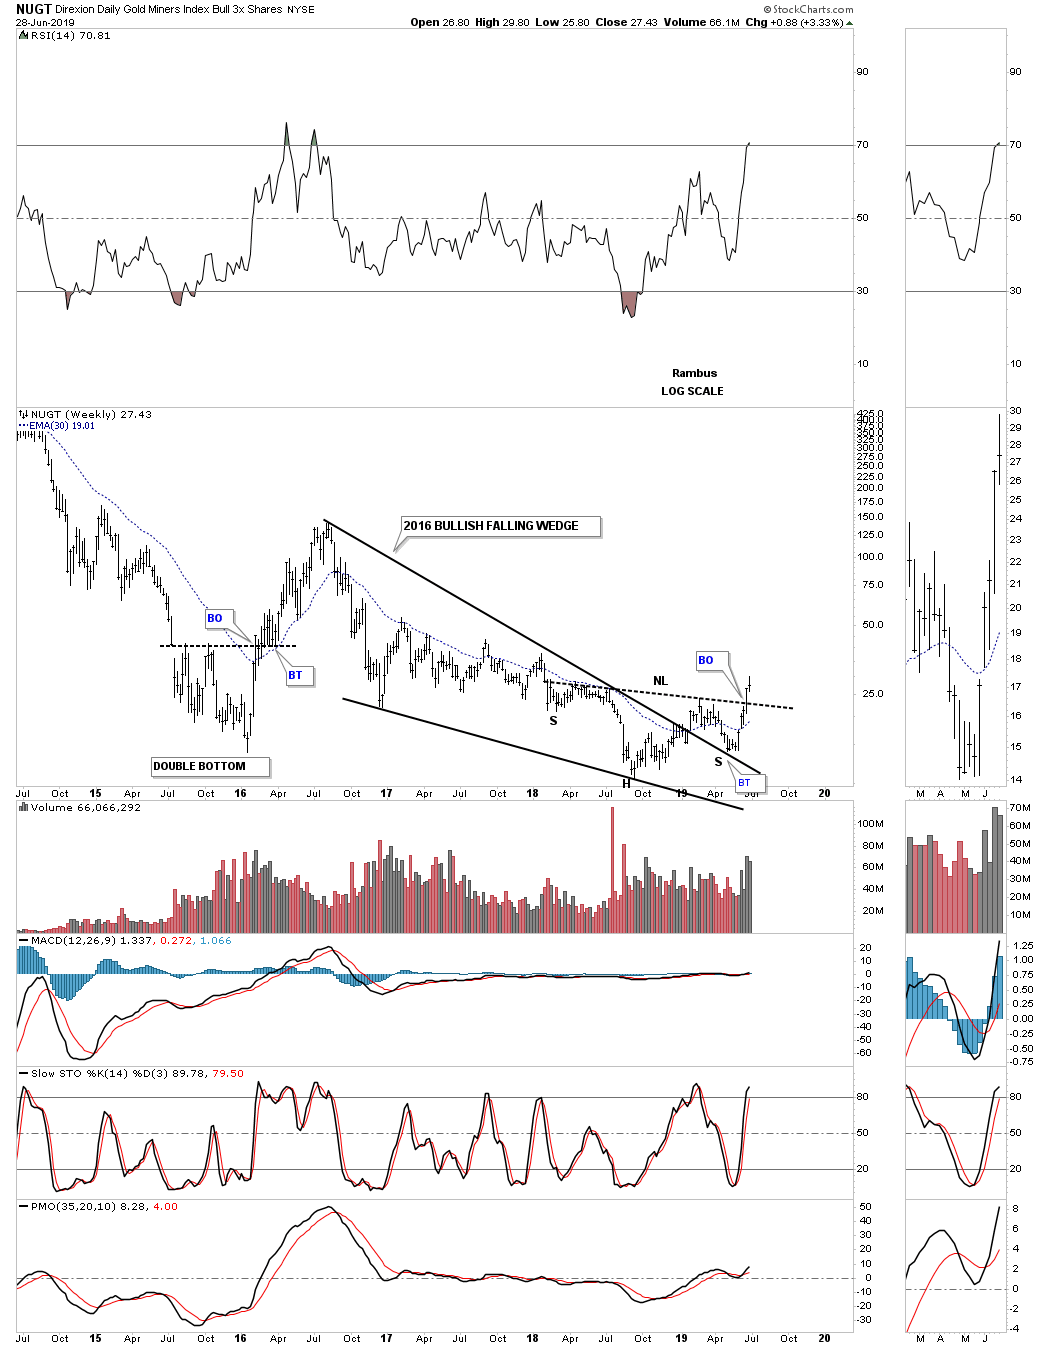
NUGT daily:
NUGT weekly:

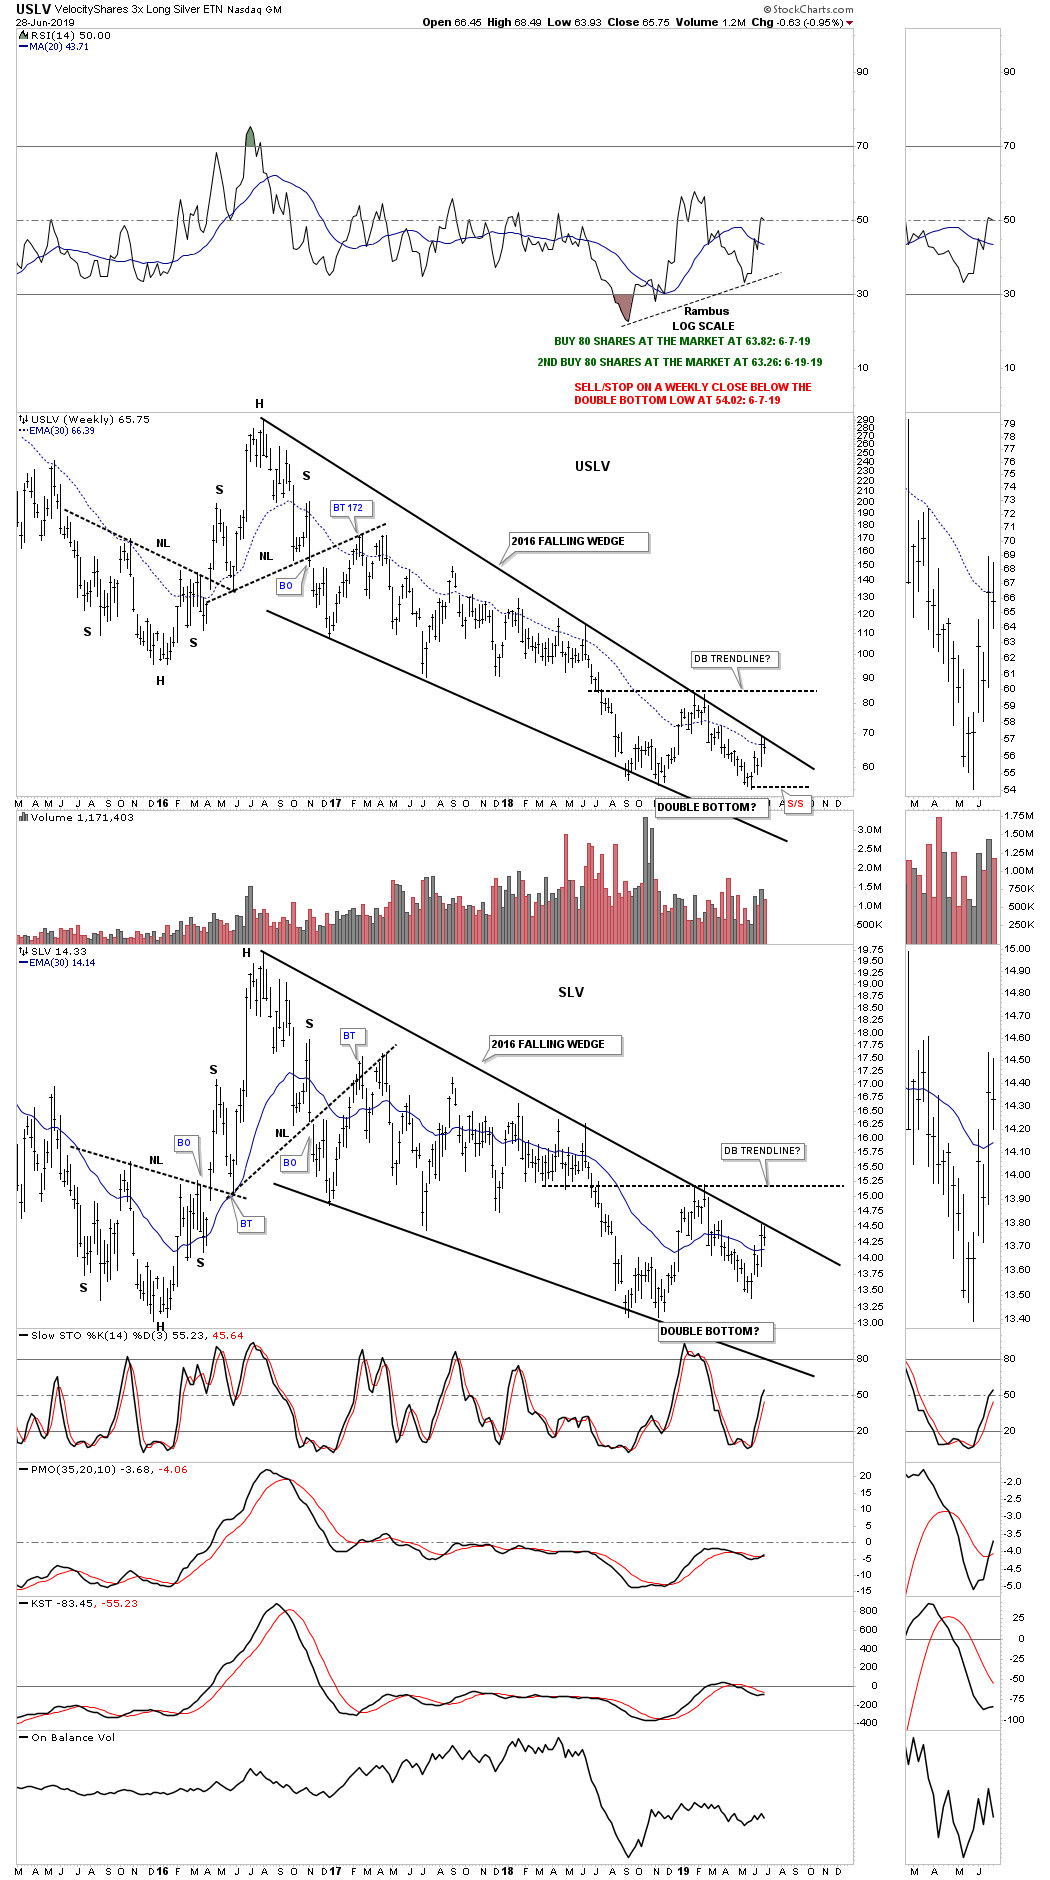
USLV weekly:
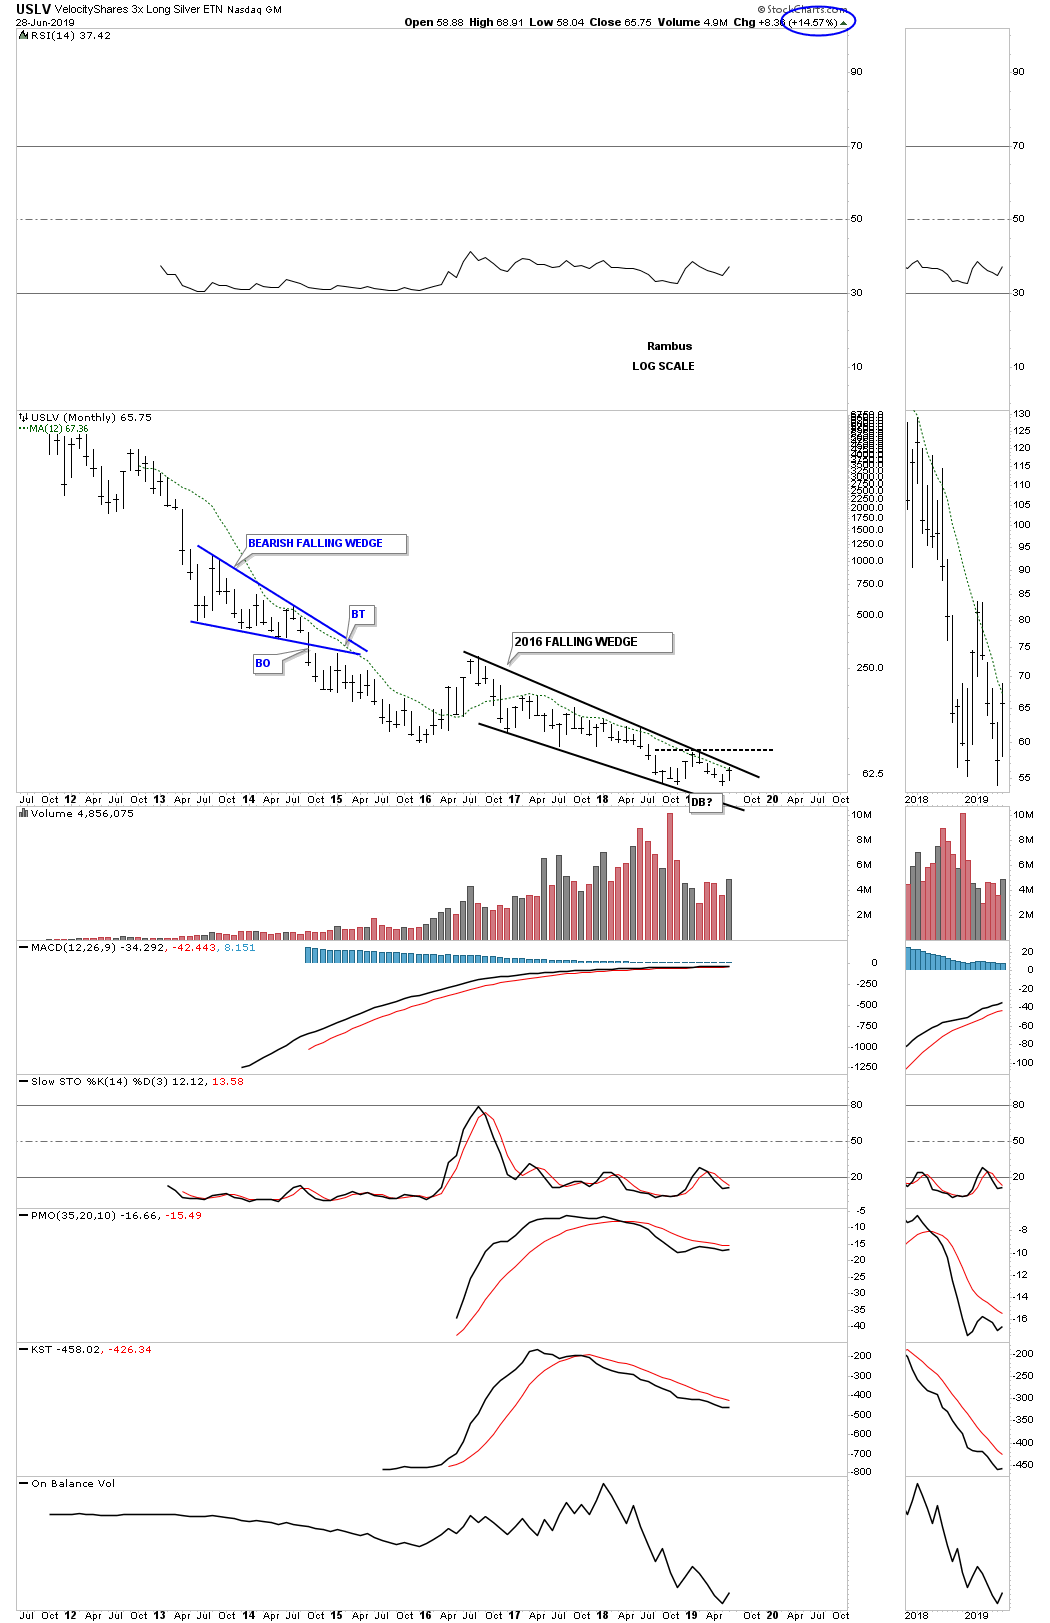
USLV monthly:
Going Forward I will be focusing on the PM Sector , as that is where the greatest potential moves are , following the breakout of many stocks in the PM Complex. Big bases = Big moves.
Of course I may also have a new portfolio of General Market Leveraged positions , as these markets are also on the verge of breakouts.
Interesting and Exciting times for Traders and Investors alike. Stay Tuned.