There is a myth shared by many in the precious metals community that in order to have a bull market the stock markets have to crash and burn. There are times when that may be true but that isn’t always the case. Many times PM complex and the stock markets can rally together for extended periods of time and then there are times when they do run inversely to each other.
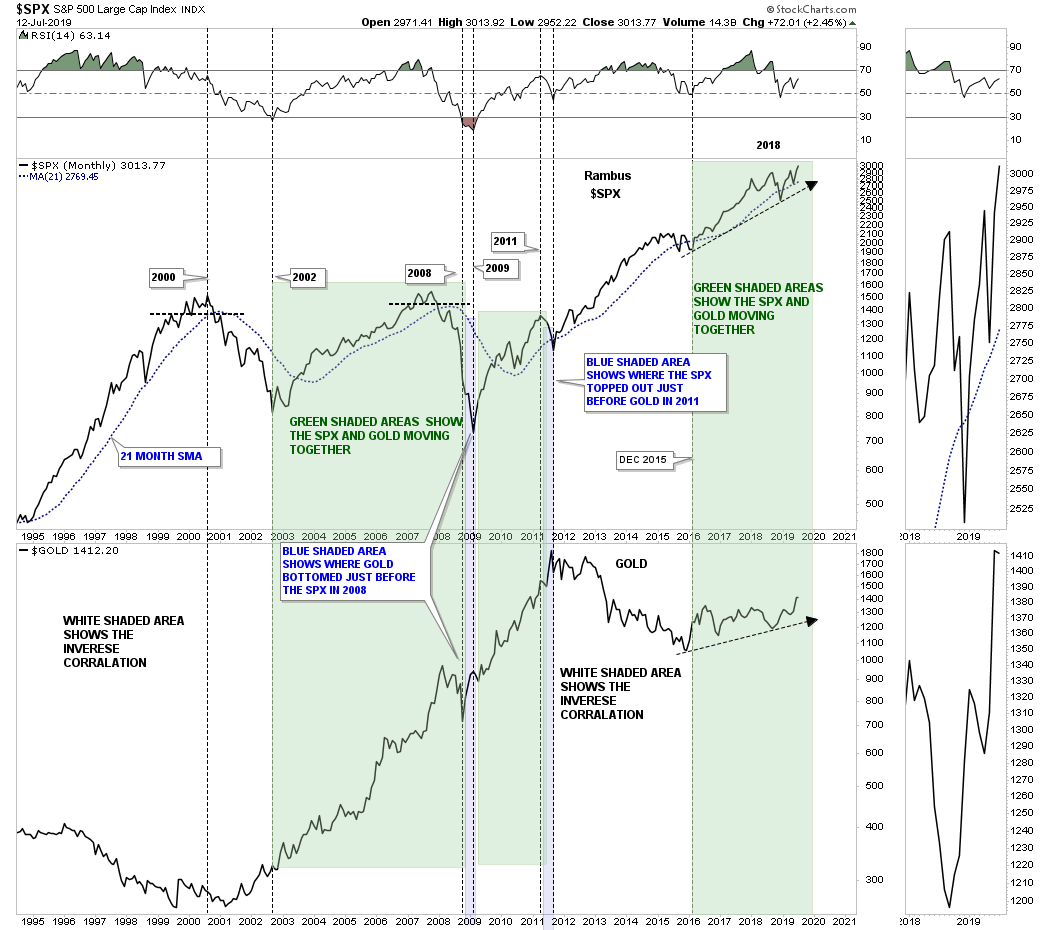
To show you what I mean below is a 25 year combo chart which has the SPX on top with gold on the bottom. The white shaded areas on this combo chart show when the two are running inversely to each other. The green shaded areas shows when the two are moving in the same direction together. From the 2002 low to the 2011 bull market high in gold they both pretty much moved together. Even during the 2008 – 2009 crash in both the SPX and gold they both declined together with gold bottoming just before the SPX as shown by the blue shaded area. They both then rallied together again into golds 2011 high which began another period of inverse correlation with gold going down and the SPX going up.
That went on until December of 2015 when gold put in its bear market low while the SPX was finishing up its 2015 correction which doesn’t look like much on this chart. From that 2015 low for both the SPX and gold they both have been rallying together to this very day going on over three and a half years now. Presently there doesn’t seem anything on this combo chart to suggest the positive correlation is about to change anytime soon. Enjoy the good times as long as they last. Have a great weekend and all the best…Rambus