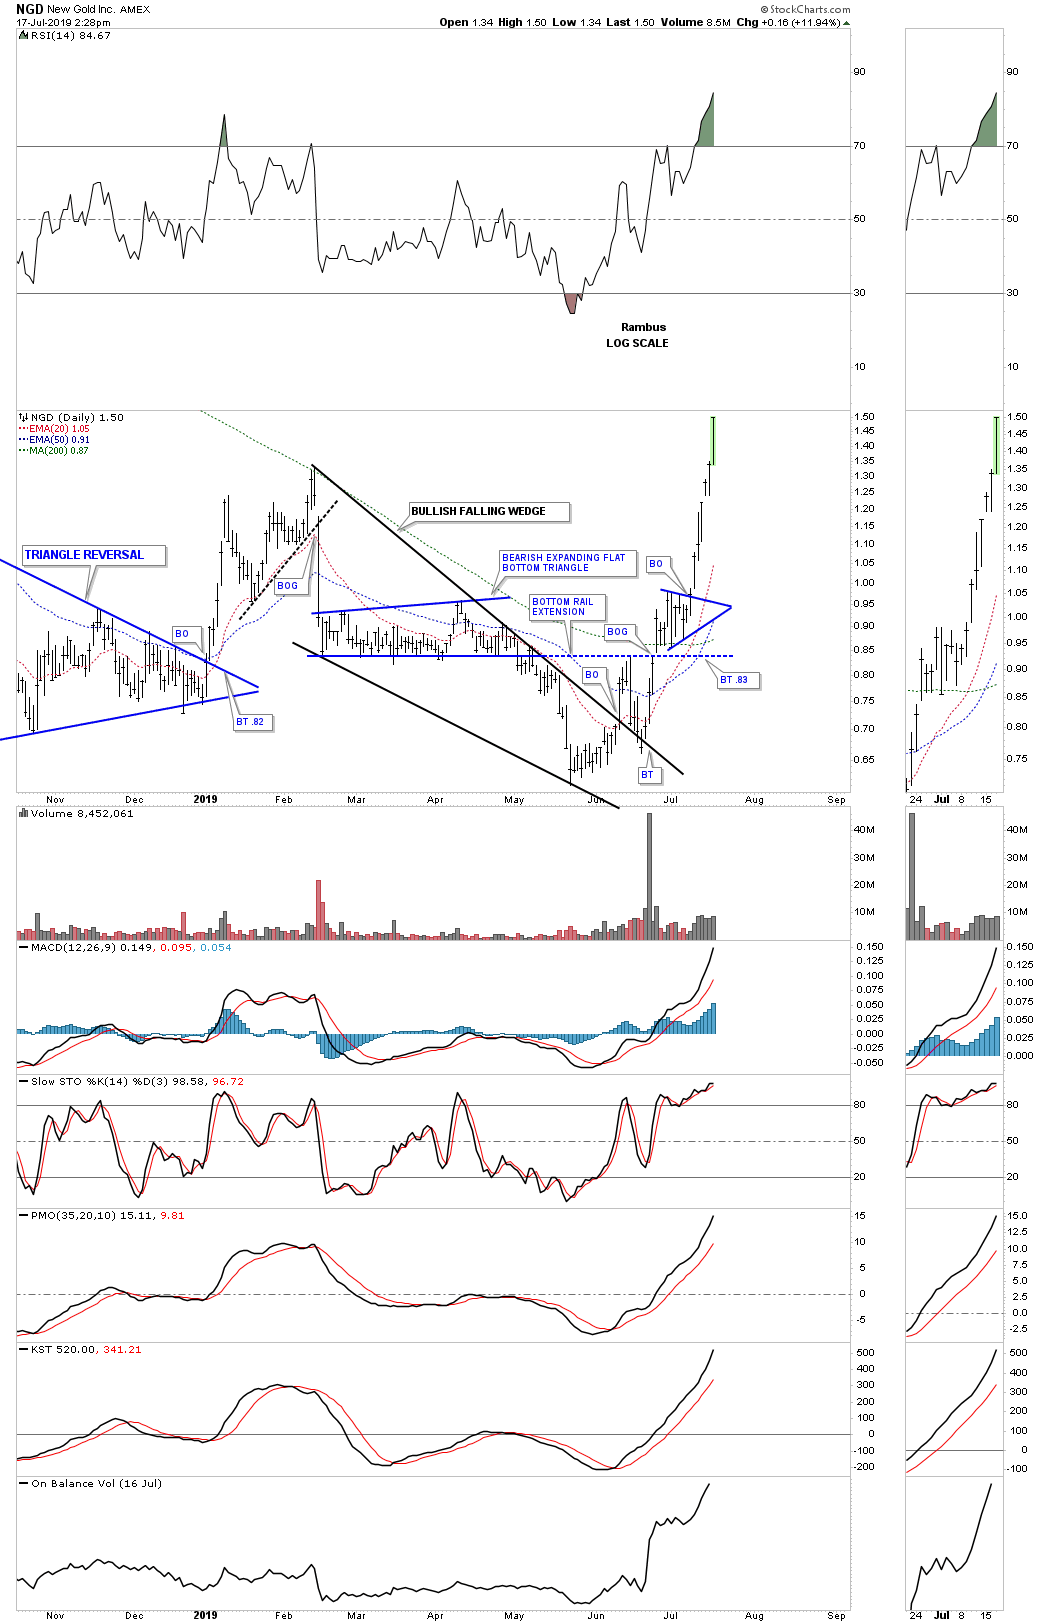
For those that are interested in the NGD trade we have our first 100% winner. This week the price action is breaking out above the double bottom hump which is the first milestone. Because the decline was so vertical the odds are high that we could see some reverse symmetry to the upside as shown by the blue arrows. A backtest to the double bottom hump would come in around the 1.30 area.
The daily chart.
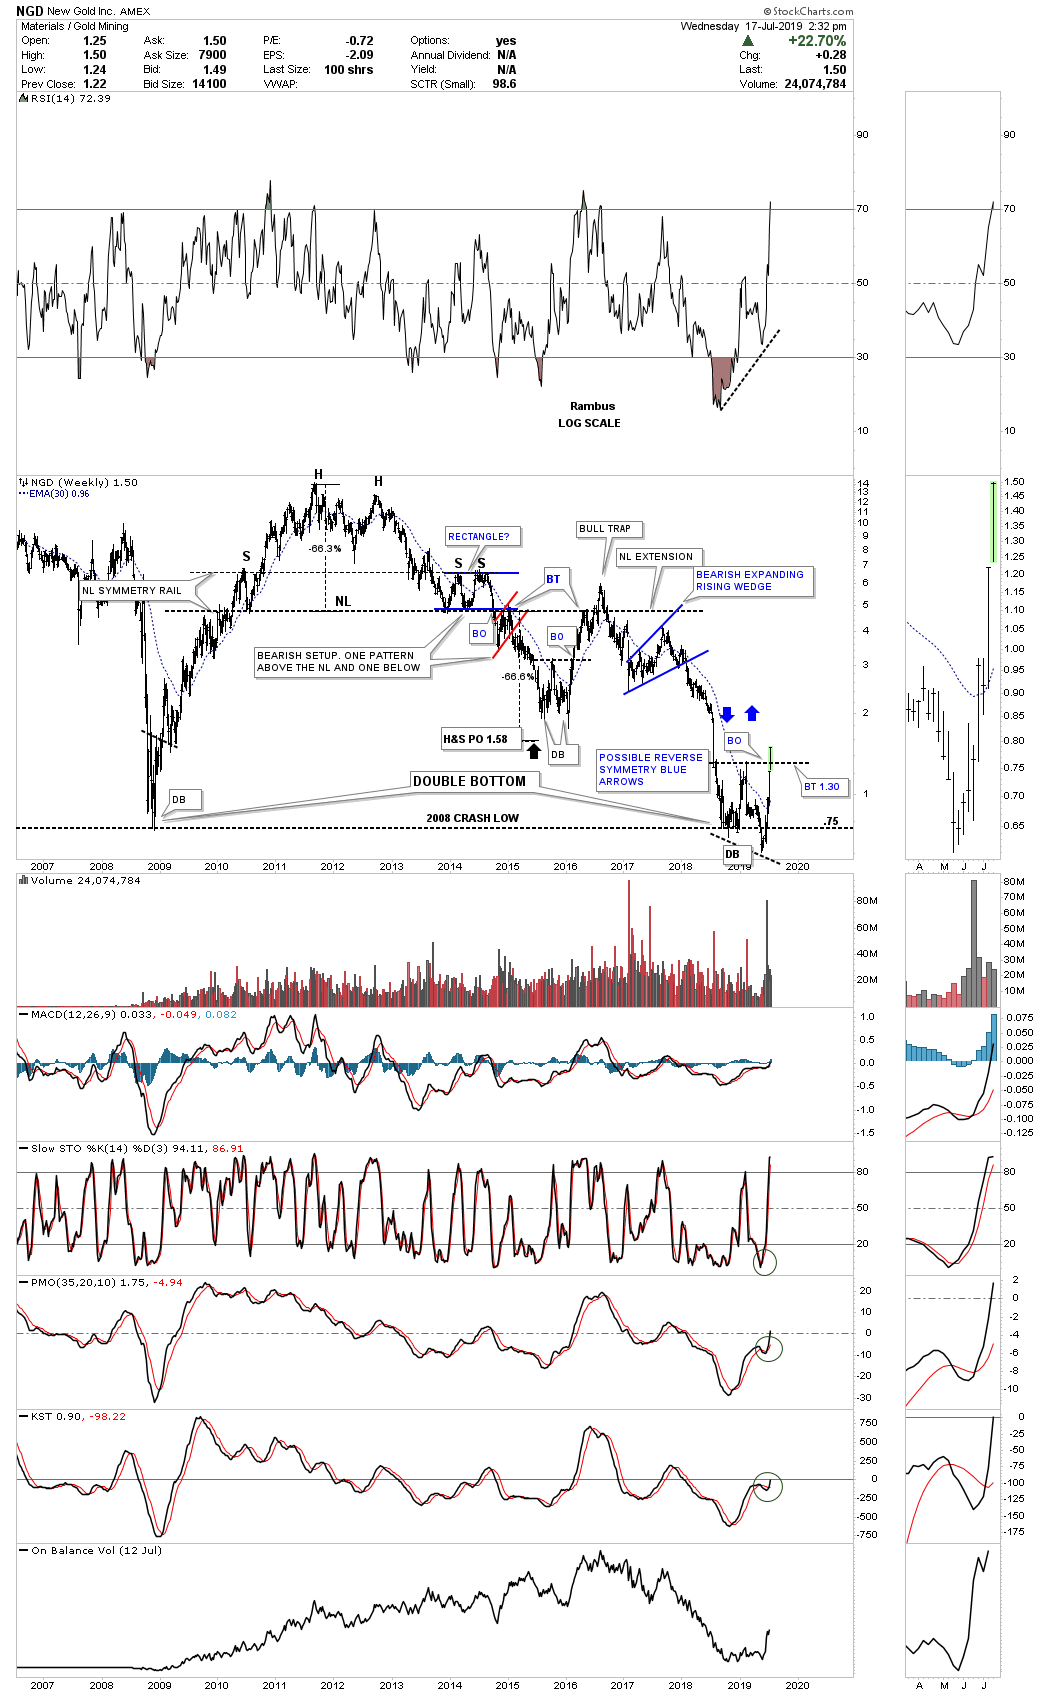
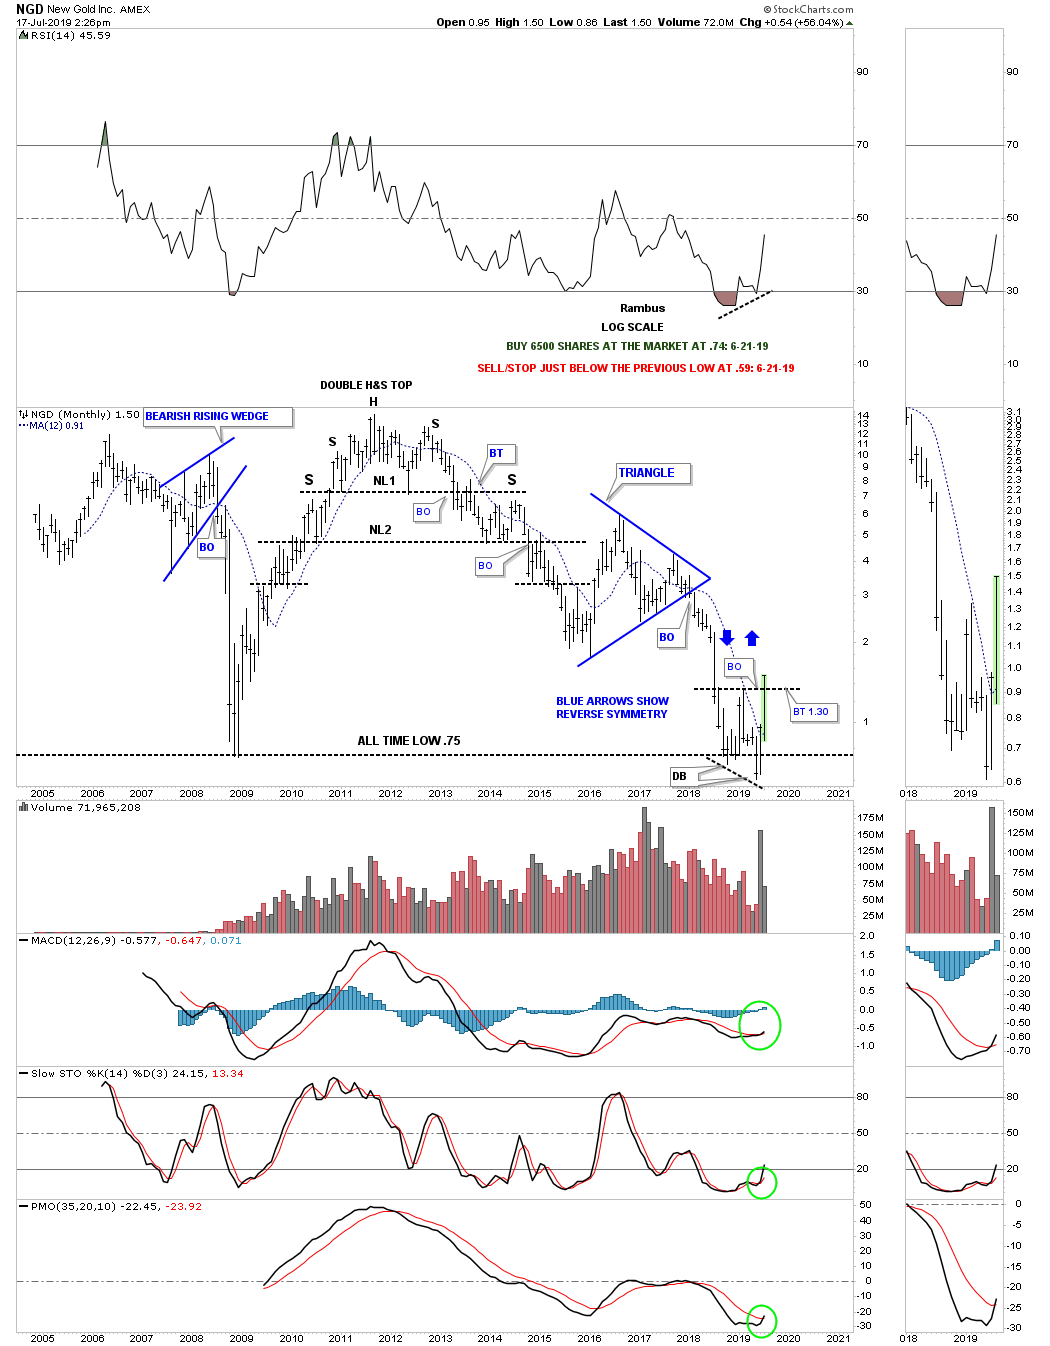
Below is the long term weekly chart which shows why I decided to get positioned where I did at .74, the 2008 crash low, which may be creating a very large double bottom or trading range. Also the vertical move down made this trade attractive if the bottom did materialized we could get some nice reverse symmetry to the upside over the same area on the way down.