I’m going to hold all positions into next week.
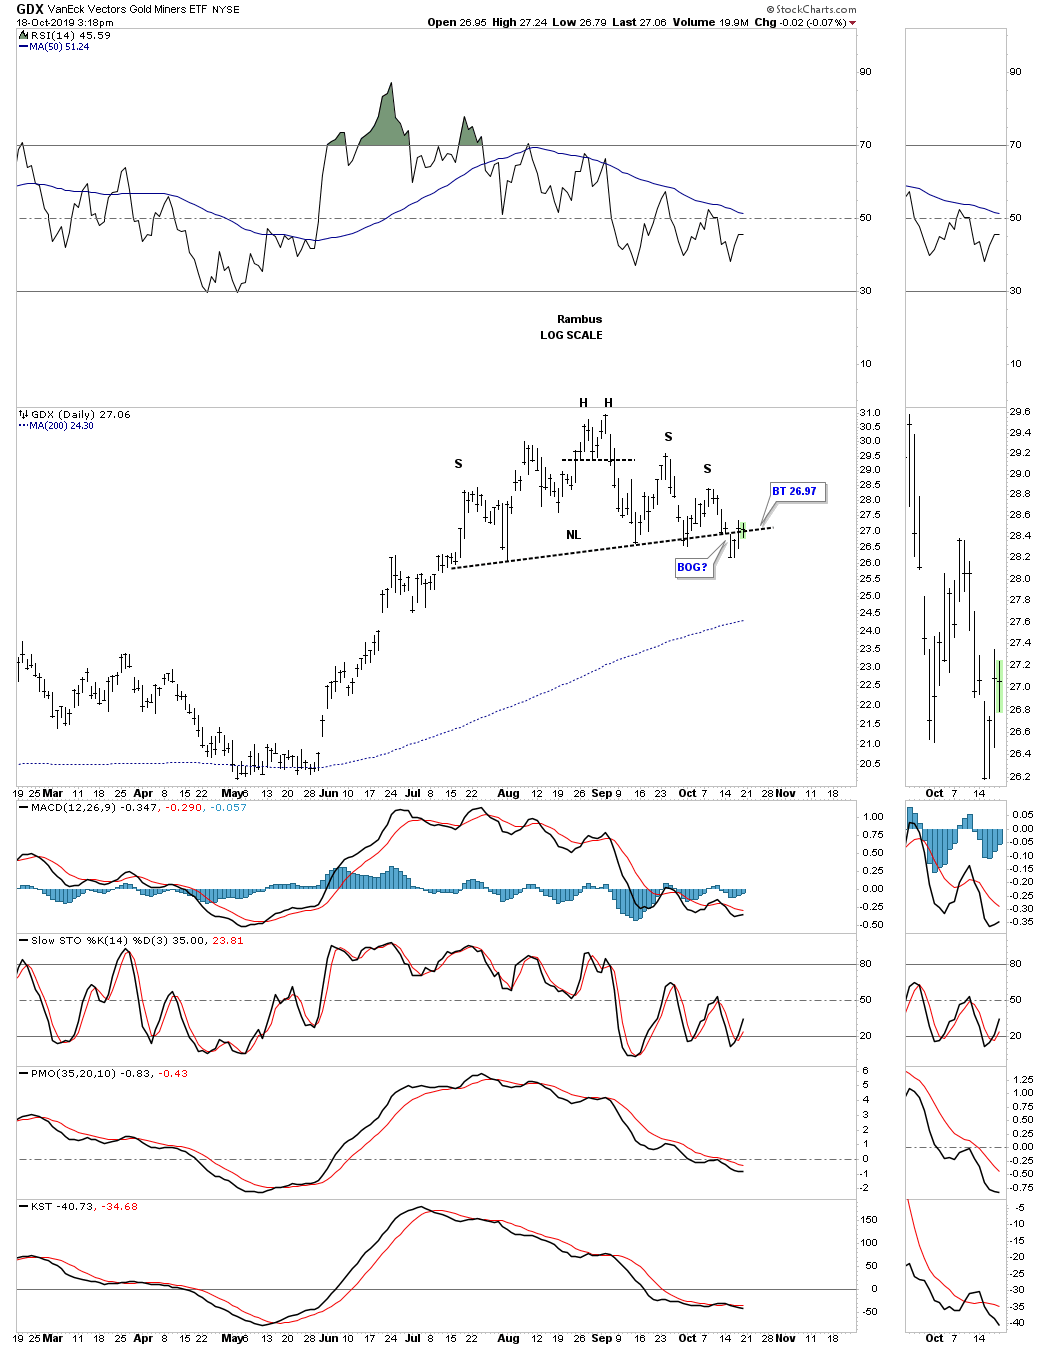
There was little action in the PM complex today which can happen at important inflection points when investors are waiting for direction. This daily chart for the GDX shows today’s price action still trading at the potential neckline.
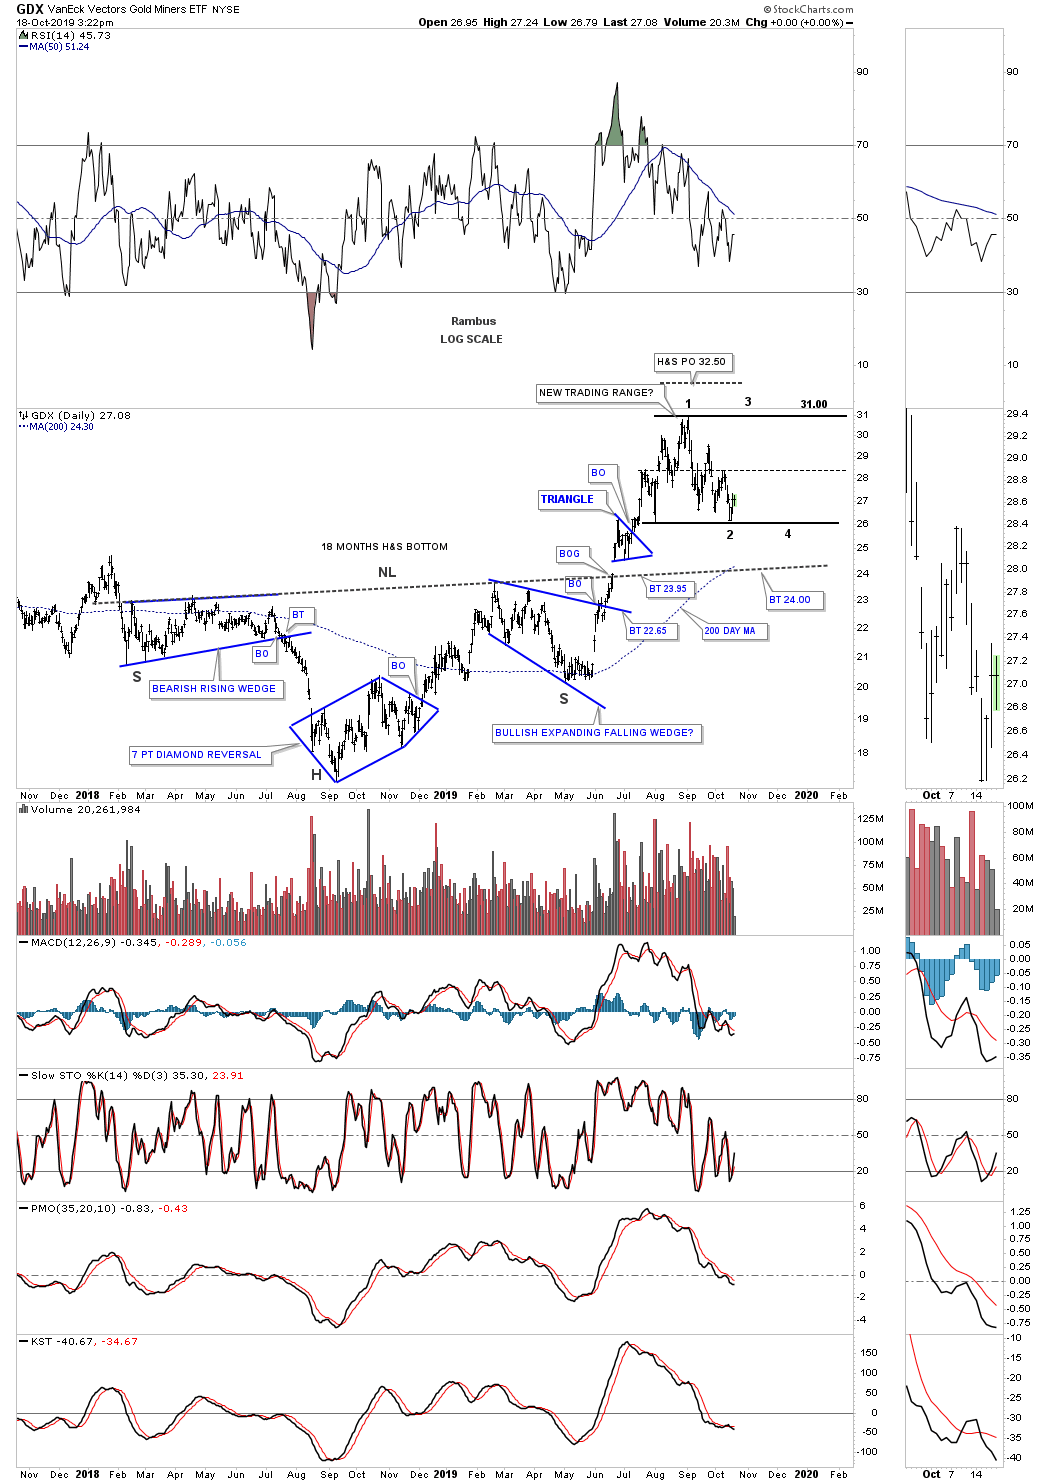
This daily chart shows the potential trading range building out with the GDX trying to establish a low for a rally up toward the top of the trading range.
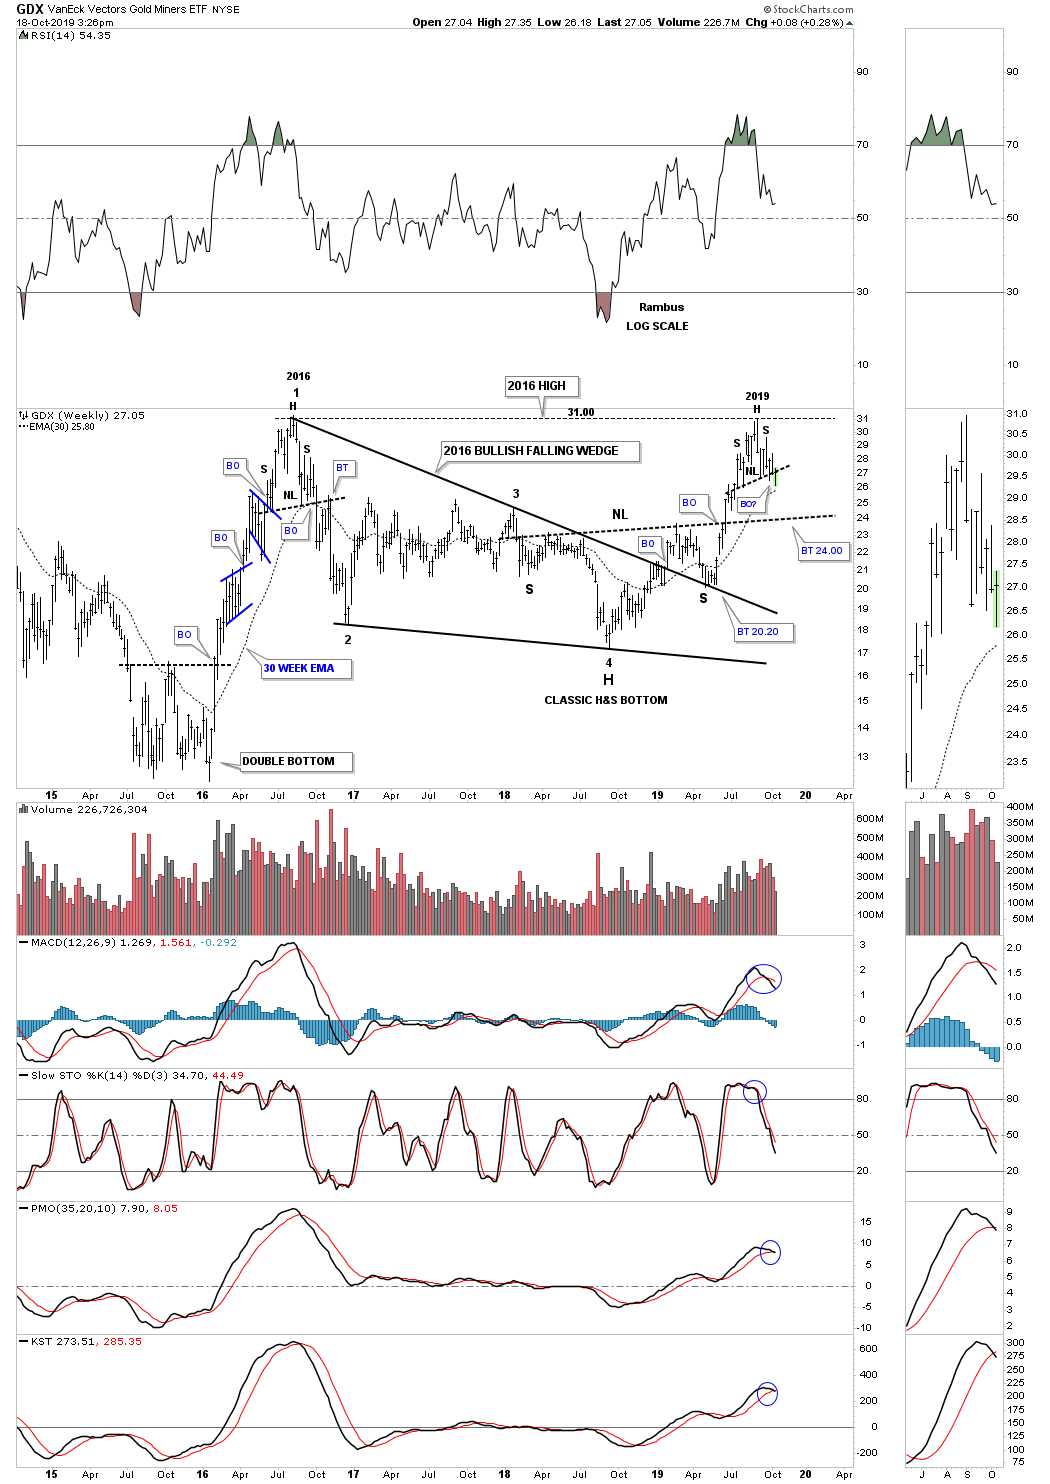
And then we have this weekly chart for the GDX which shows the horizontal resistance line forming between the 2016 and 2019 highs at the 31 area. For now I’m viewing the 2016 – 2019 resistance line as bullish above and bearish below for the long term picture. Short term anything is possible.
I’am well aware of the possible falling wedge that many of the PM stocks and indexes are building out. The real question will be how the falling wedges workout. Will they be a stand alone pattern, meaning they will show up as a bullish falling wedge halfway pattern in the next impulse move up? The other possibility is will they just be the first and second reversal points in a bigger consolidation pattern?
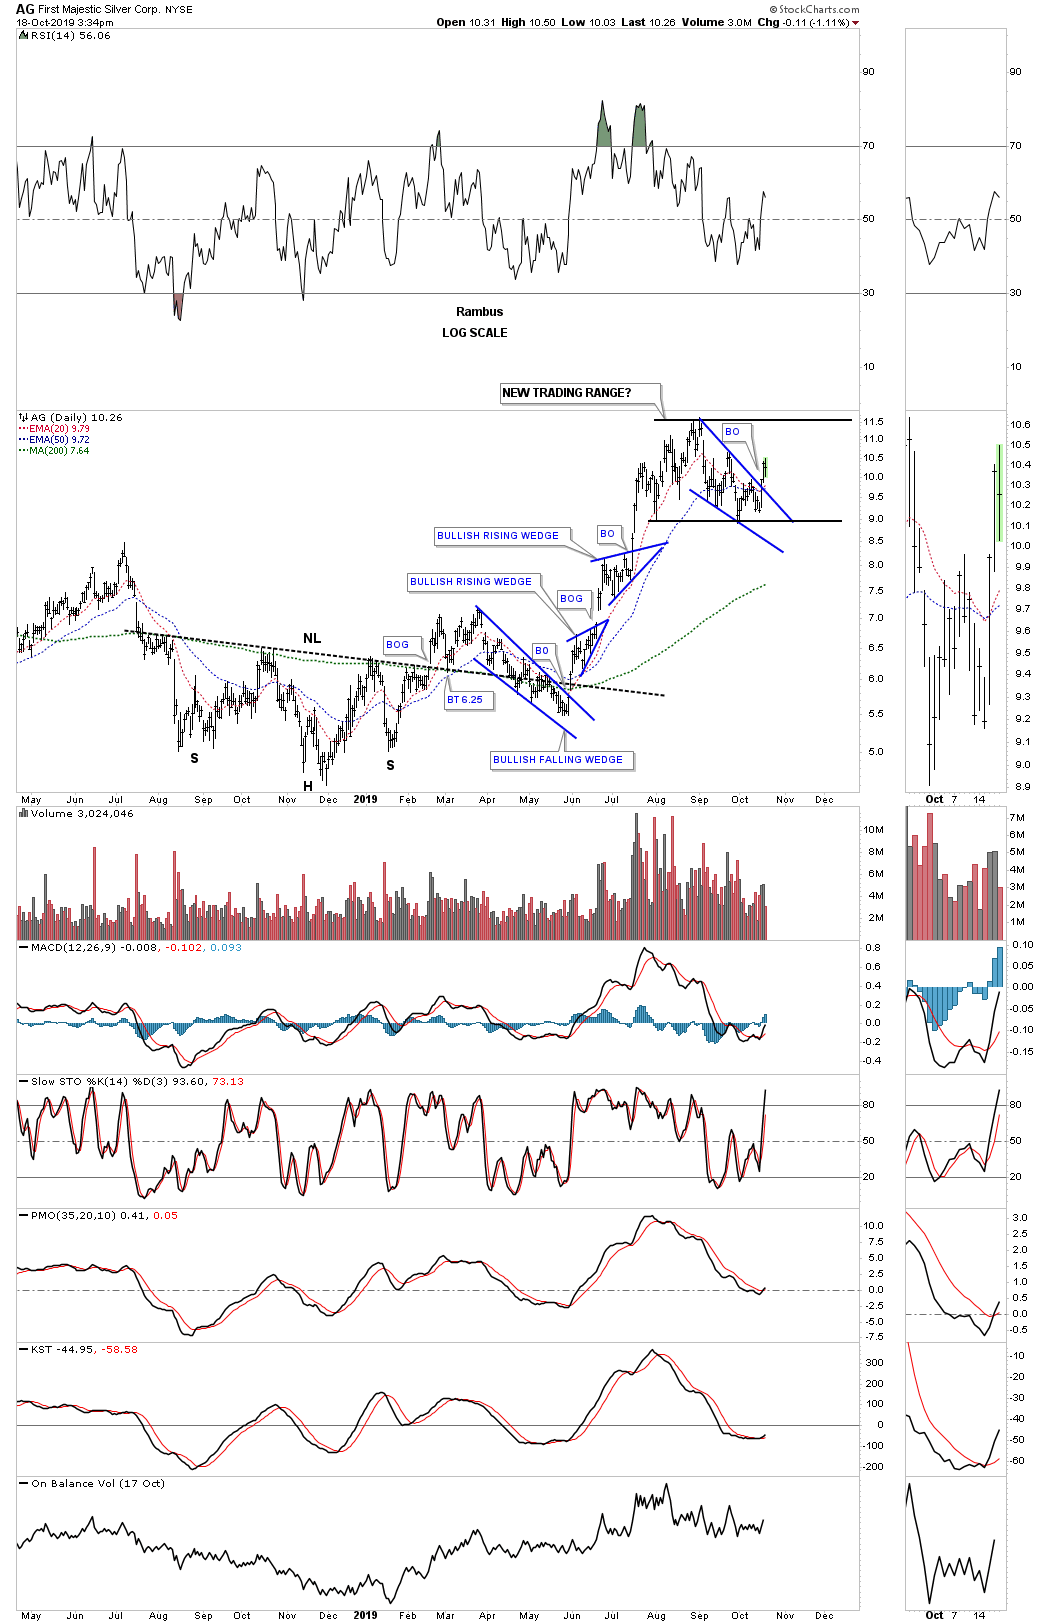
Below is a daily chart for AG which shows the falling wedge as a stand along or part of a bigger consolidation pattern?
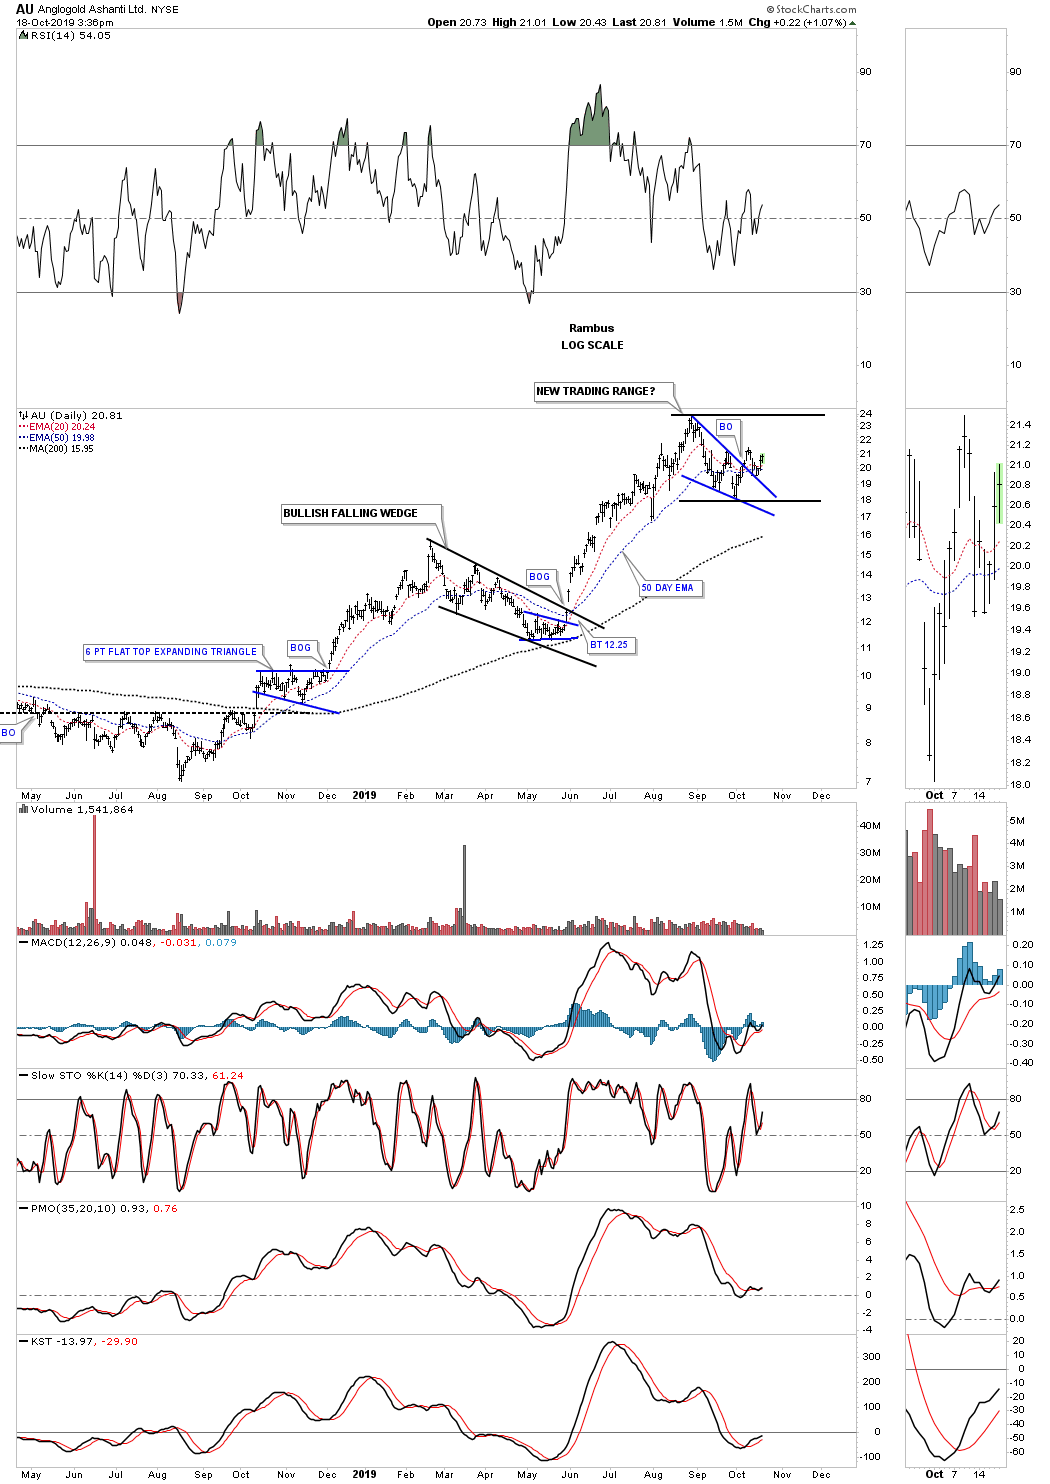
AU shows another example.
As you know I used the 30 week ema as my sell/stops when I had the Gold Stock Portfolio fully invested earlier this year before I went to cash in September. This week I would have had to exit several more of my original positions if I had stayed long. What we are beginning to see is what PM stocks are holding up the best which I’ll be watching very closely when I’m ready to jump back in. For me personally I’m content to be in cash in the PM Stock Portfolio for now. I know there are going to be many more trades that are going to develop over the life of this bull market.
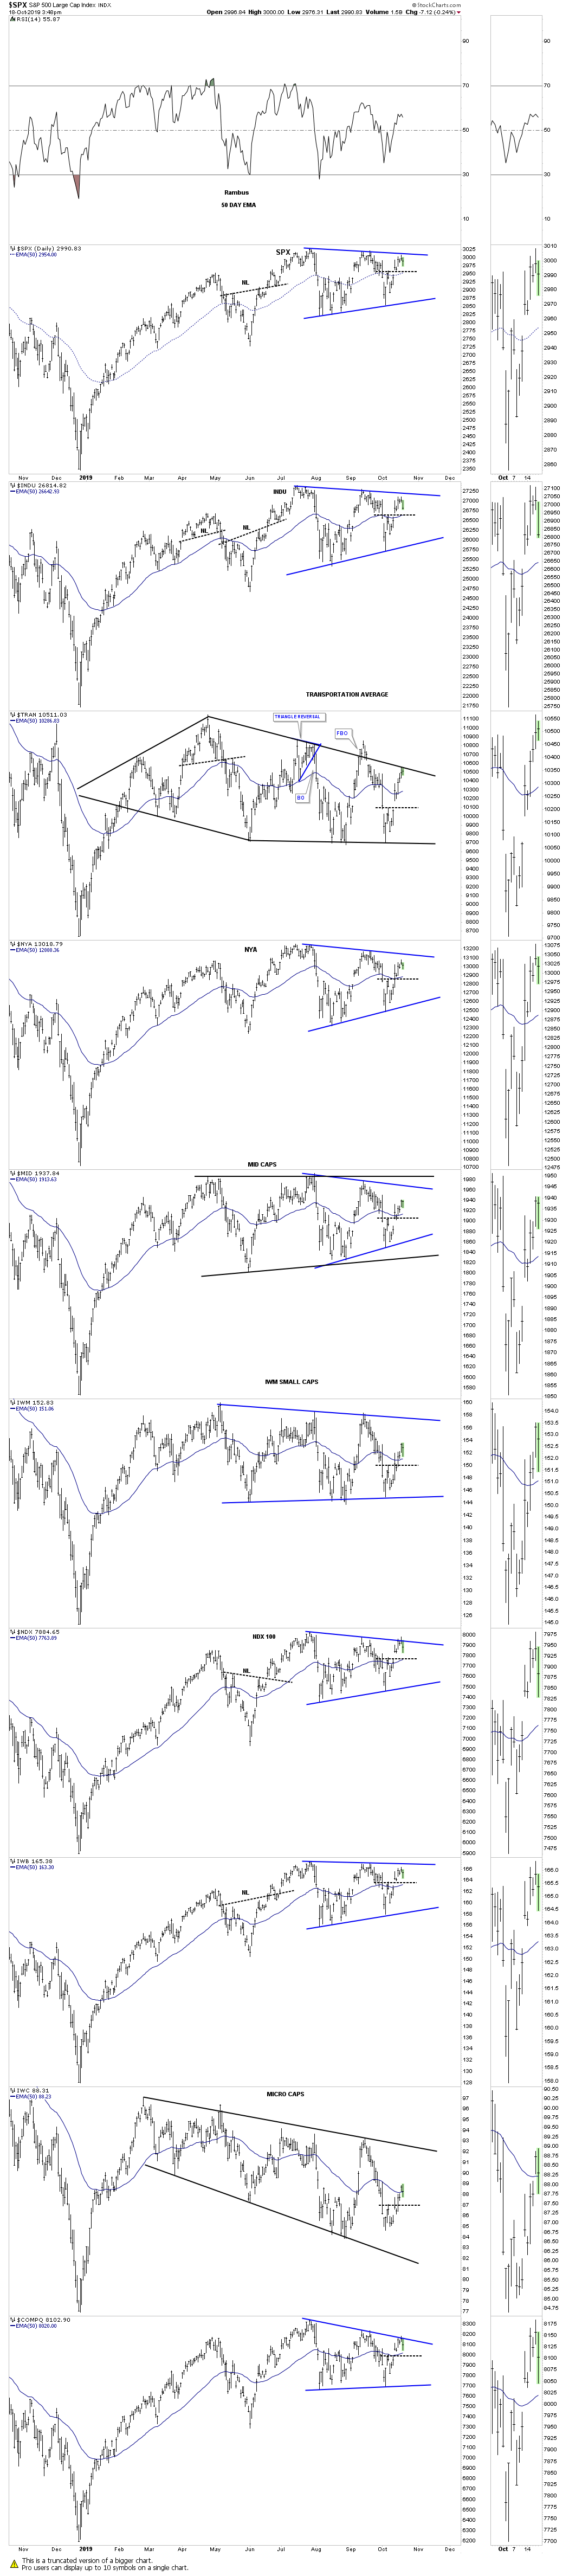
Below is the daily stock market combo chart for the US stock markets which shows most of the indices building out a 3 month trading range. The price action on some of the indexes hit the top rail this week and is backing off which is to be expected on the initial hit. If the bull market is going to play out the first thing we’ll need to see is the top rail of these smaller consolidation patterns, which are part of a bigger consolidation pattern, breakout above their respective top rails.