
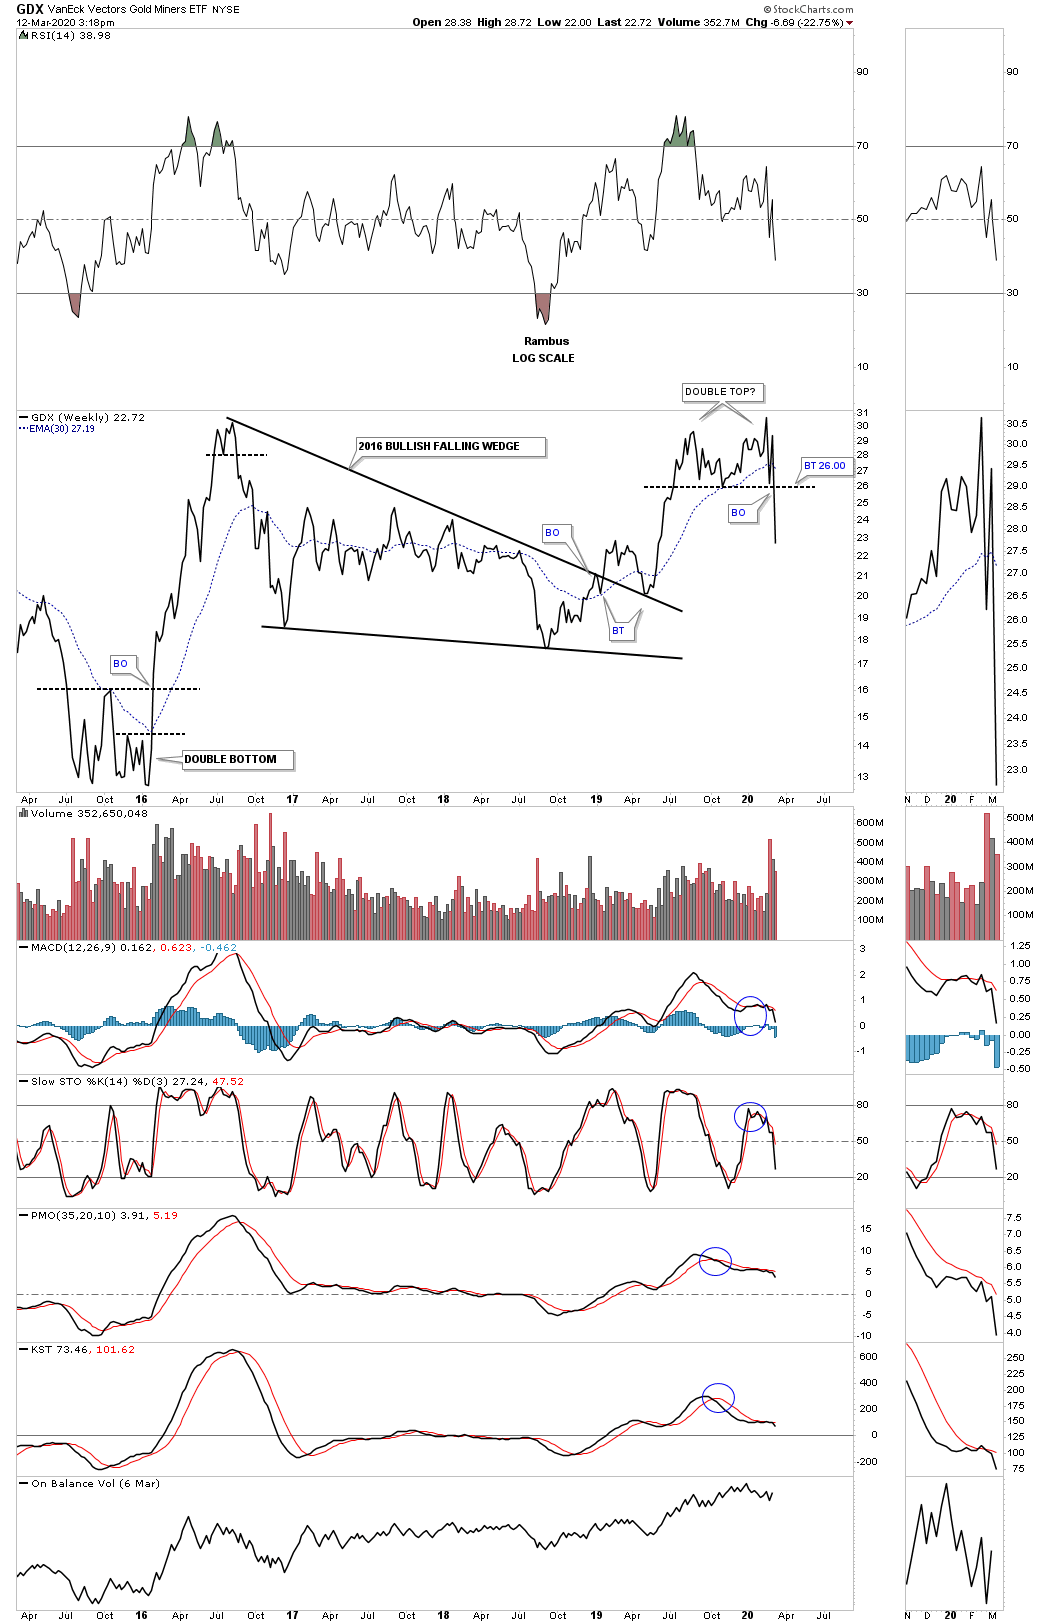
Yesterday I showed you the double top on the PM stock indexes that was just beginning to show itself. Today we got confirmation in no uncertain terms the double top is valid. Below is a weekly line chart which can take out some of the noise a bar chart can make.
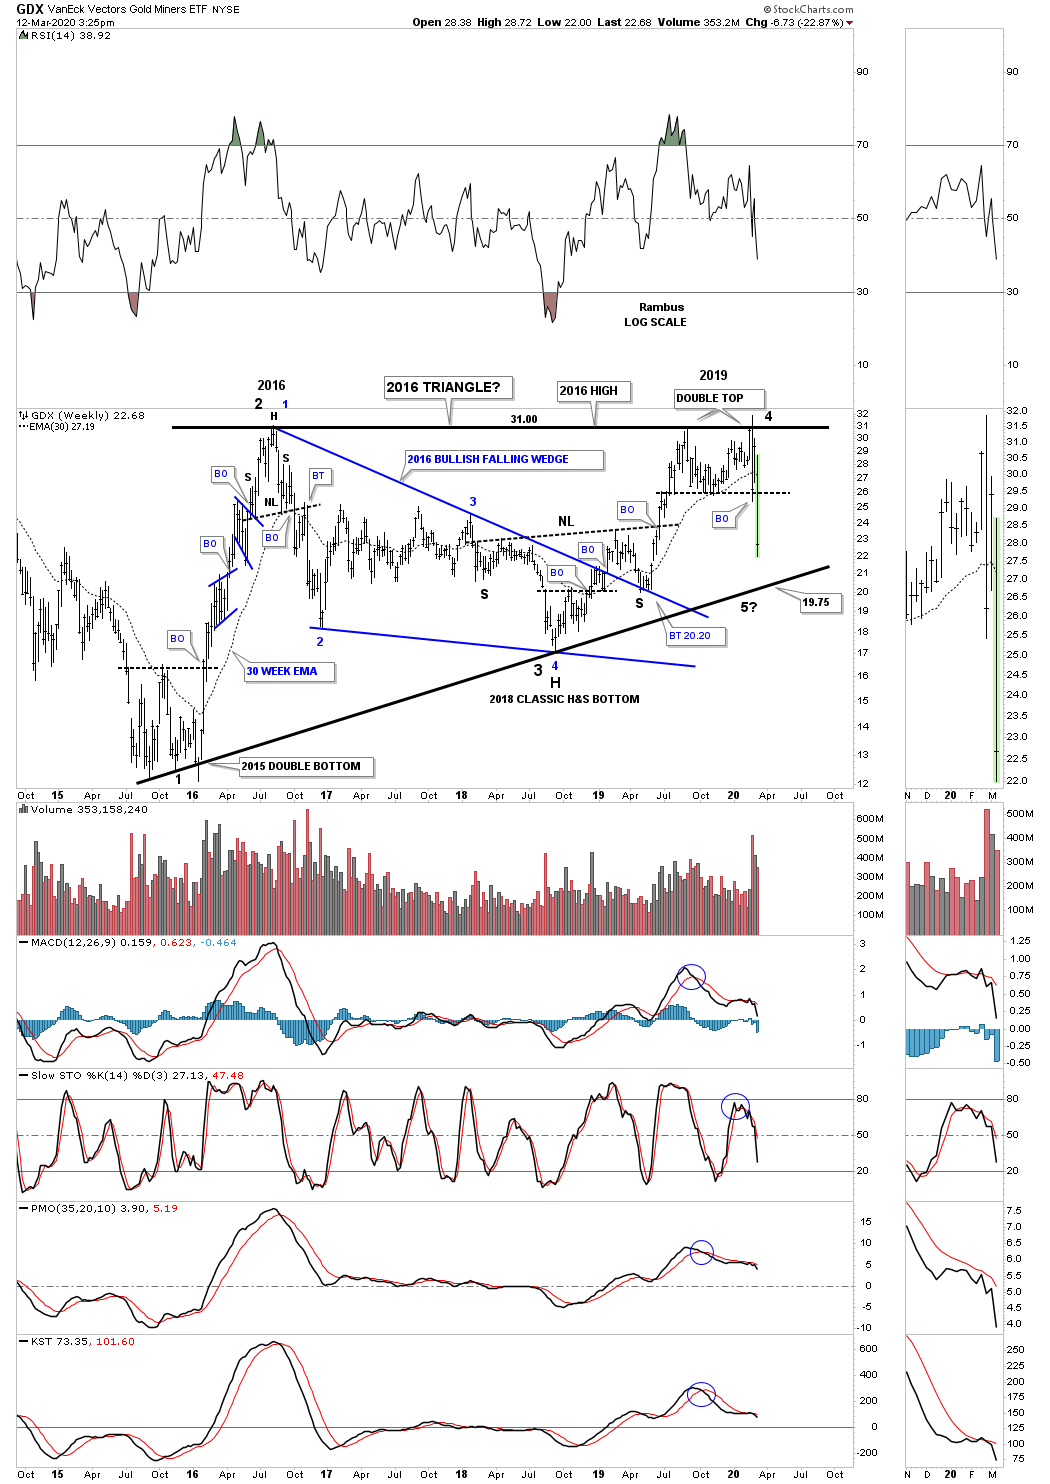
Below is a weekly bar chart for the GDX which is getting close to testing the bottom rail of the 2016 triangle around the 19.75 area. What is so important about the bottom rail at 19.75 is a touch will complete the 4th reversal point putting the triangle into the consolidation pattern to the downside. On the other hand if the bottom rail can hold support at 19.75 then we could see a 5th reversal point form which would be complete when the top rail is hit and then broken.
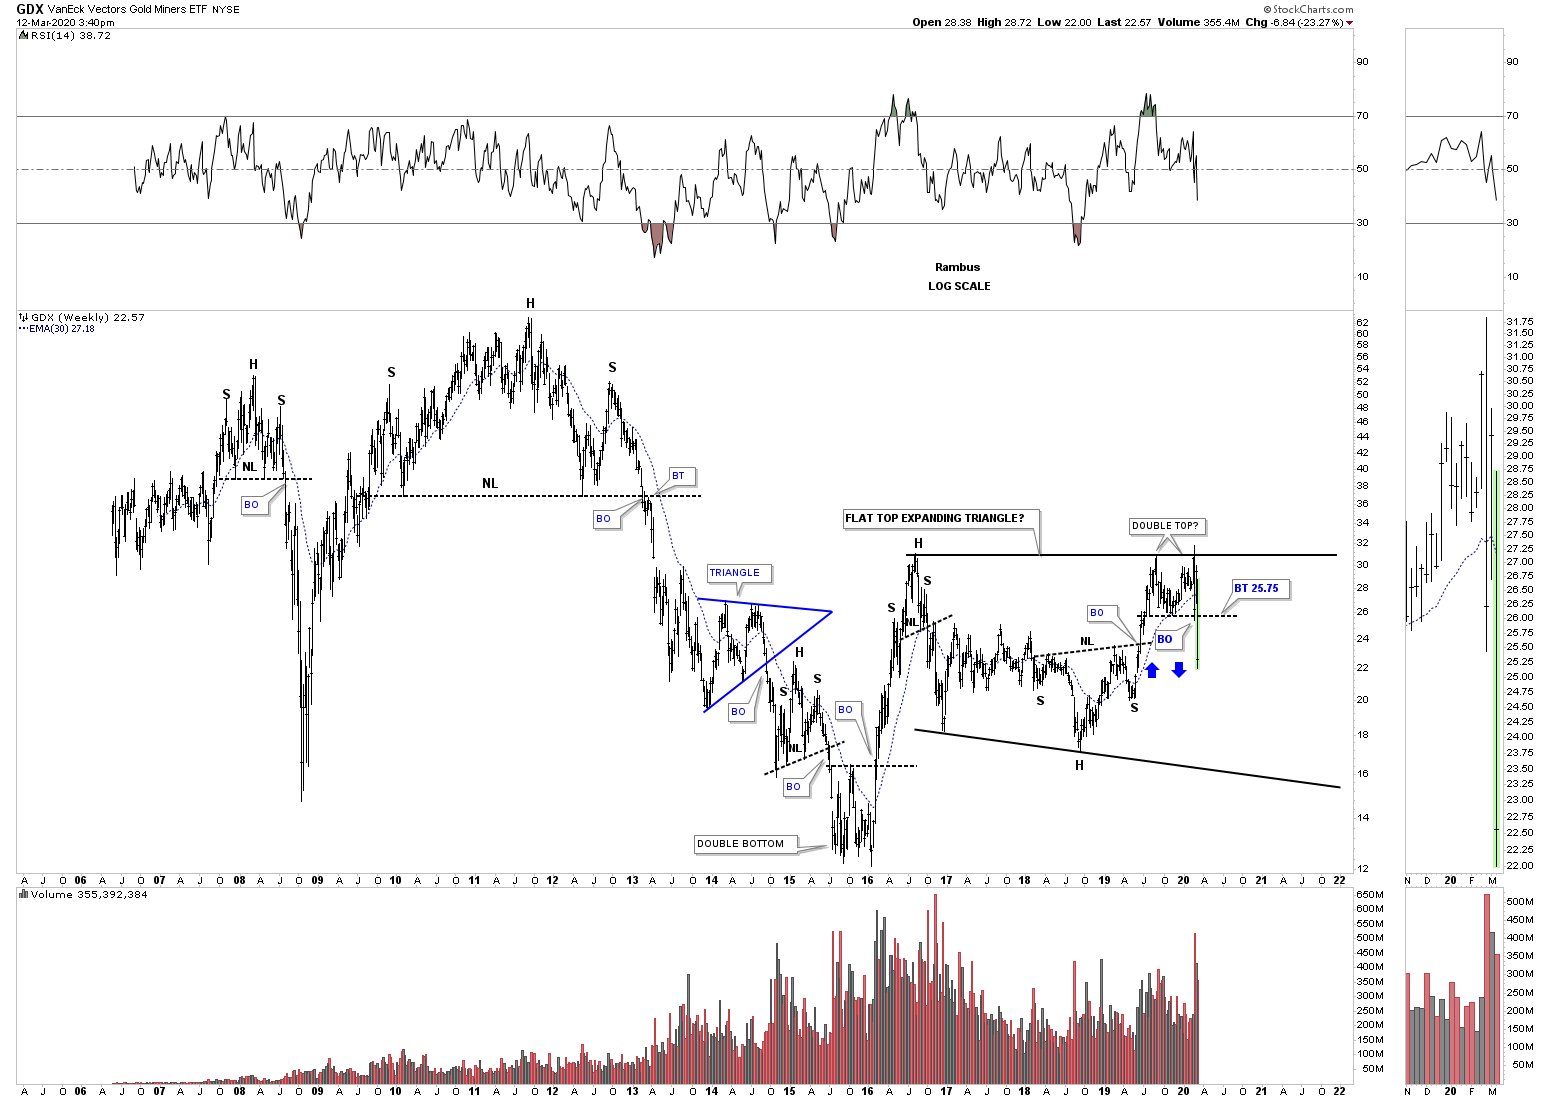
Below is a longer term monthly look at the GDX which shows a potential much more bearish setup than the chart above.
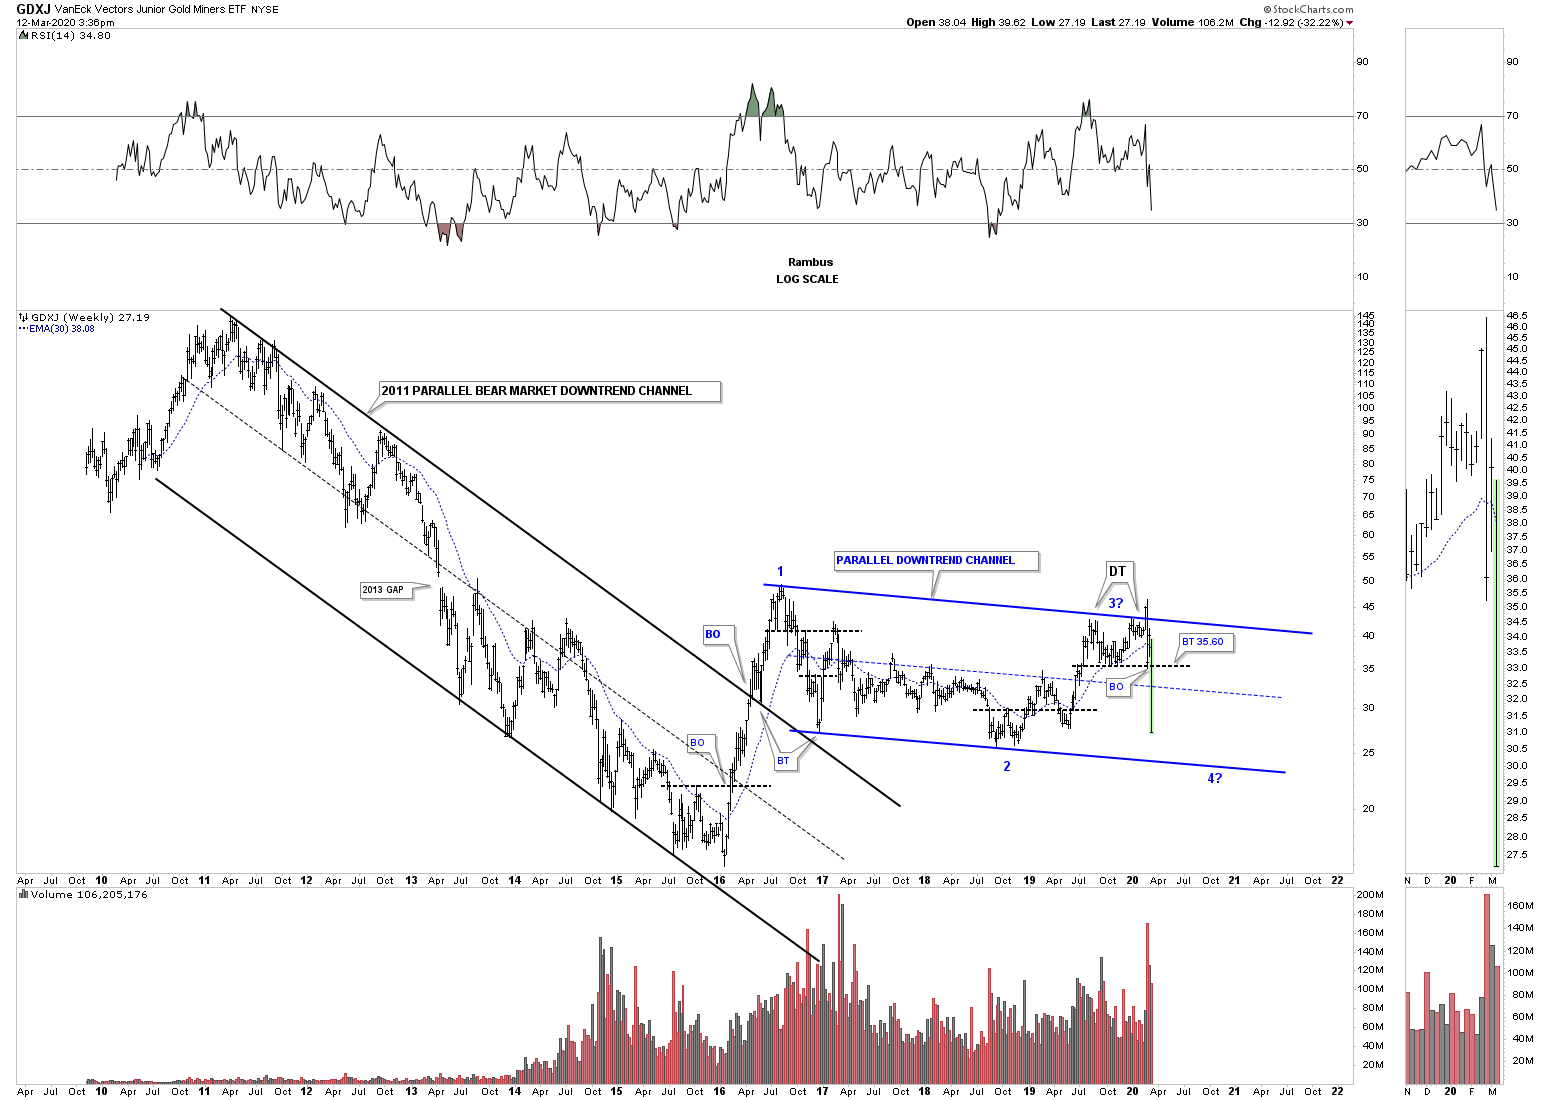
The GDXJ is setup just a bit differently but all the same pieces of the puzzle are still there. Keep a close eye on at the bottom trendline at the possible 4th reversal point.
This last chart is the daily combo chart for the US stock markets we’ve been following for a long time. If you recall this fastest decline in history began with the unsuspecting double top which didn’t look that terrible at the time. The thing about double tops is that they are first a reversal pattern. Form that point there is no way to know how powerful it will end up being. Remember that small double top that formed on the PM stock indexes last August which still hasn’t been broken. I also suggested if this rising wedge plays out the way it is supposed to then we could see a waterfall decline to where the bearish rising wedge began to form which was at the Christmas Eve low on December 24th 2018 at a minimum. As you can see that low is giving way now on many of the indexes.
