
Since the markets are closed today I would like to take a few minutes and go over one of the trades in the, Leveraged Trade Portfolio, that I recommend last fall RETL, a 3 X long retail etf. Compared to biotech, big cap tech stocks or semiconductors the retail sector doesn’t sound that exciting but that was an understatement if you got invested last fall.
Like many of the stock in the Leveraged Trade Portfolio, RETL had some very nice Chartology which was suggesting we could see a strong move. Here is what I wrote on the day of the first buy.
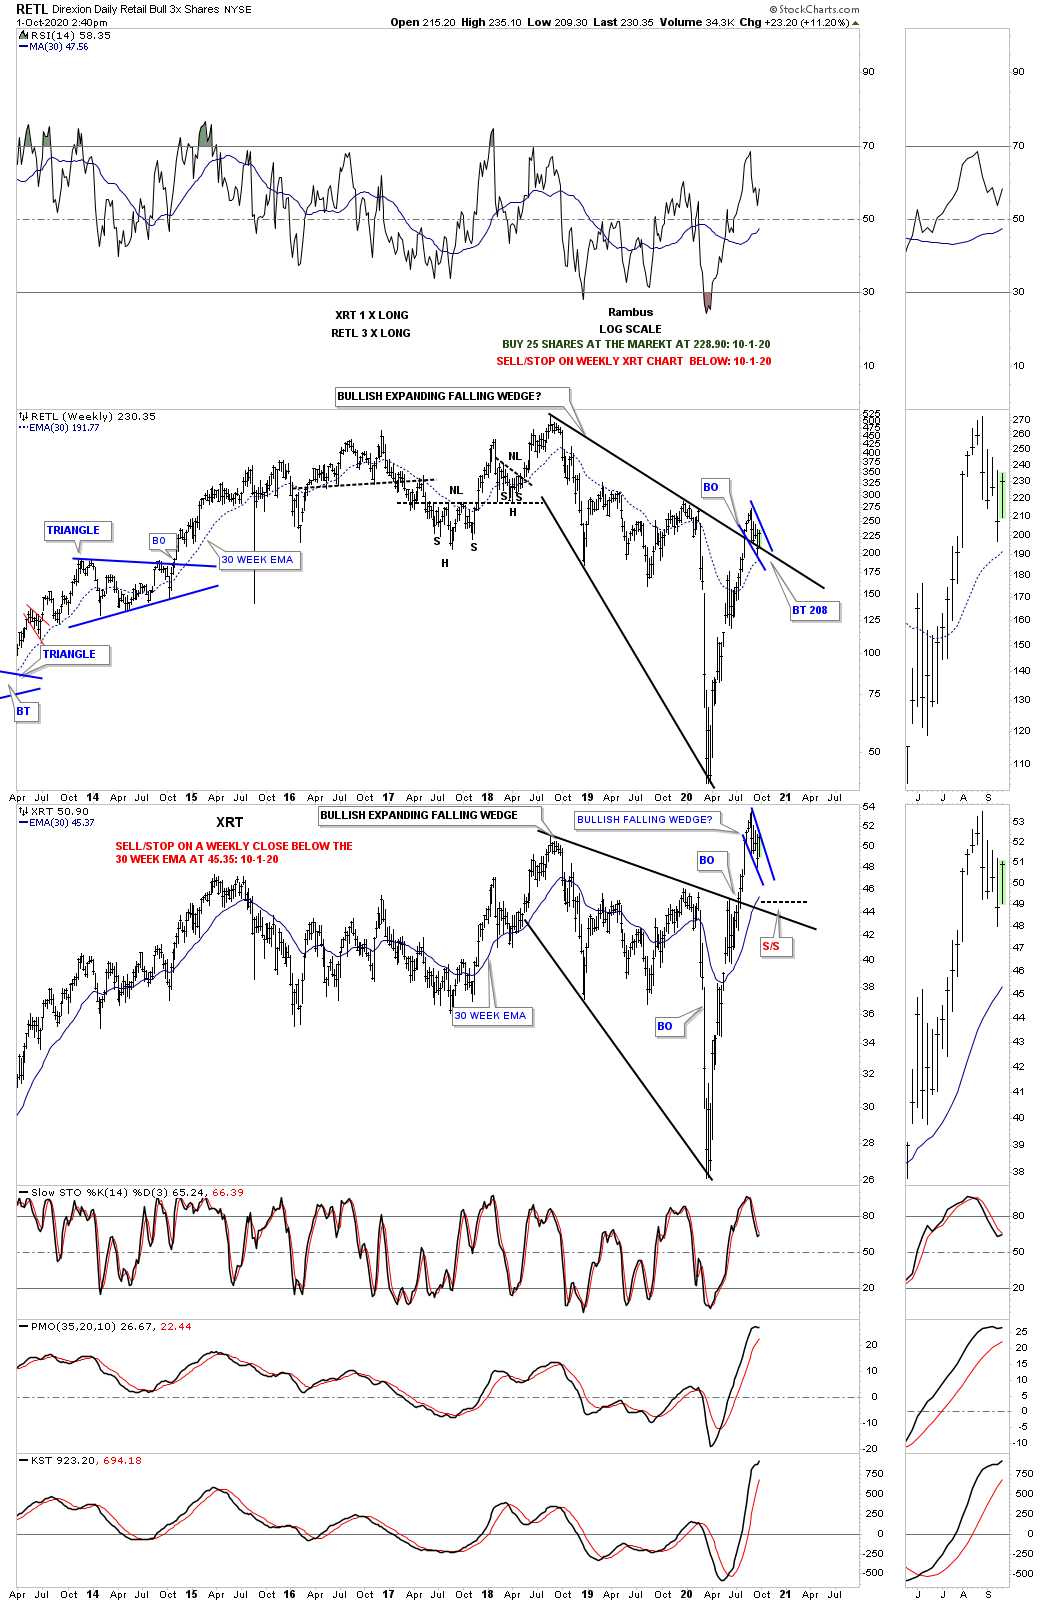
RETL is a 3 x long the retail etf which is attempting to breakout from a small bullish falling wedge today. I’m going to take an initial position and buy 25 shares at the market at 228.90 with the sell/stop just below the 30 week ema on the XRT. If you don’t want the leverage you can buy XRT.
This was the first chart I posted with the buy and sell/stop which was based on the breakout of the RETL that formed the small bull flag as the backtest. This weekly combo chart also shows the XRT which is the index the RETL is based on. Keep in mind that etf’s have a small margin of depreciation but nothing like options or Kamikaze stock for instance.
Another thing we’ve discussed many times is that one of the toughest patterns to spot in real time is a bullish expanding falling wedge. The reason this pattern is so hard to spot in real time is the fact that the last low is usually very low which shakes everyone out of the trade. In turn when everyone is shaken out of the trade it only leaves buyers left which can lead to very powerful rallies. Below is what the weekly combo chart looked like on the first day of the trade on October 1, 2020.
Six days later on October 6th I took the 2nd position when it looked like the small blue bullish falling wedge was beginning to breakout after backtesting the top rail of the black expanding falling wedge on the RETL chart. From that point it was all about setting the sell/stop to the 30 week ema and letting RETL do its thing.

Then on October 30th I posted this long term monthly combo chart with the RETL on top and the XRT on the bottom. One of the main reasons I took this trade in the first place was based on that massive 2015 black expanding triangle on the XRT chart. As you can see the price action hit the top rail of the black expanding triangle for the 3rd month in a row and began backing off again telling us the top rail was still hot. Also note how the RETL had another backtest to the top rail of its bullish expanding falling wedge still not being able to break the grip of that large consolidation pattern. If you could go back to that day on October 30th 2020, the RETL was in backtest mode once again and the XRT was failing to break through over head resistance and was backing off. If one didn’t understand what was going on they would have been very frustrated and probably ready to give up on the trade even though nothing was broke except for their frame of mind.

Then just one month later on November 30th, when I update the sell/stops at the end of each month, a totally different picture was emerging which was what I was looking for on the front end of this trade. The 2nd backtest to the top rail on the RETL chart held support and began its new impulse move up at the same time the top rail on that 2015 expanding triangle finally gave way for the very first time. The blue circle at the top right hand corner of the chart shows RETL up 74% for the month of November. One month you fear the trade may fail and the next month your plan comes together. Welcome to trading the markets.

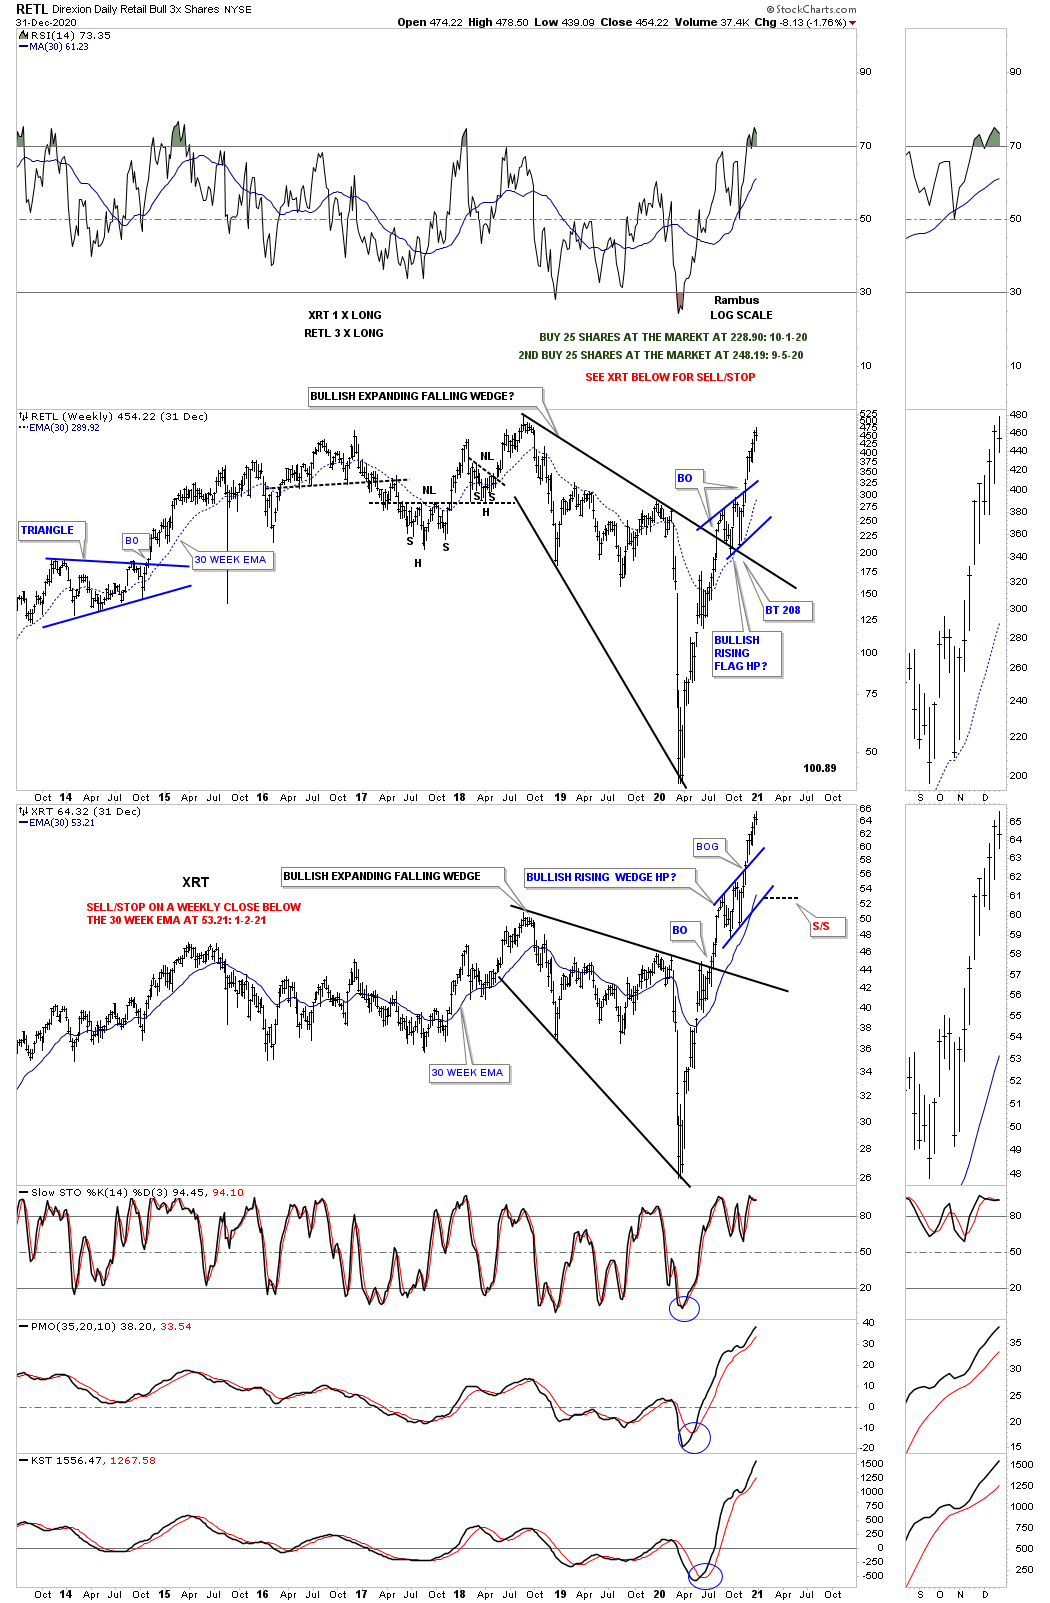
There is still a lot of history left that you can see on the blue URL below but I’m going to skip ahead toward the end of this trade to show you how the Chartology played out. First, remember the breaking out and the backtesting process that occurred when the RETL had its 2nd backtest to the bullish expanding falling wedge? That ended up creating the blue bullish rising flag that I called a halfway pattern on this end of the month sell/stops update on December 31st.
This last chart shows the price objective for that blue bullish rising flag halfway pattern as shown by the blue arrows. As you can see I got out just a bit early but after a 400% move in just under 4 months greed can be a killer. The price objective was hit the very next day and then all hell broke loose to the downside. A hesitation of a few hours or a day can cost you dearly when a stock is going vertical.
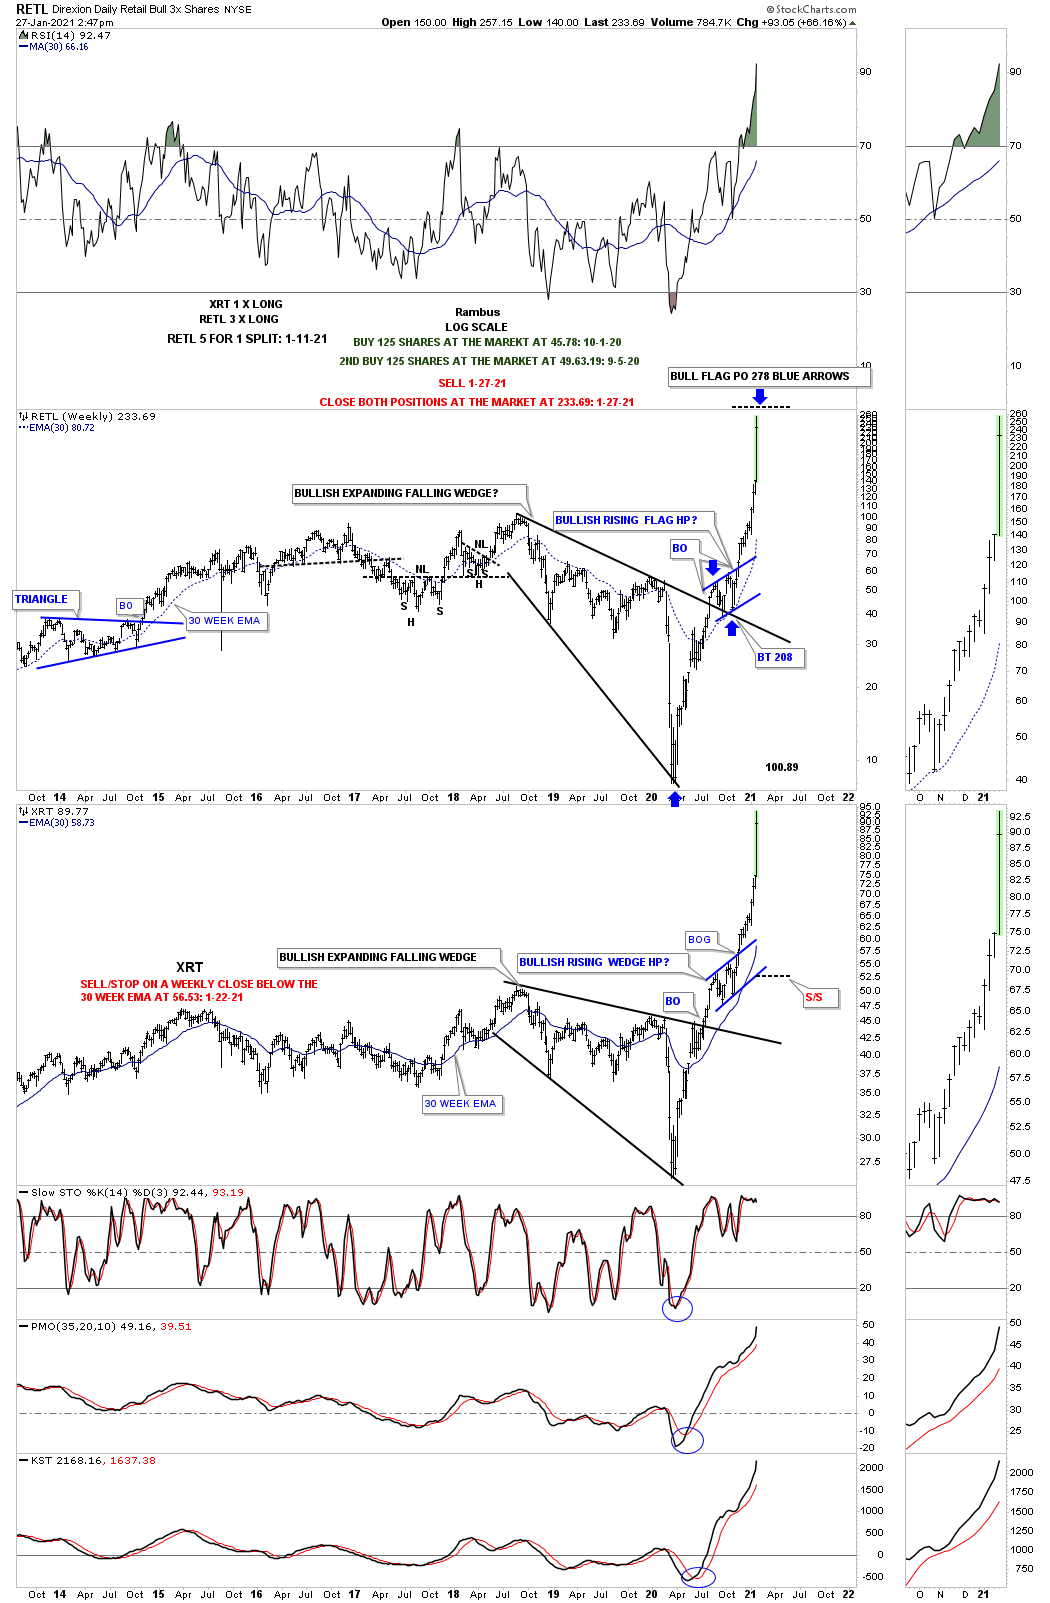
The real reason I’m showing this trade setup is to show you how everything is in the Chartology from a fundamental perspective. There was a twist to this trade that I nor anyone else could have seen at the time I took my first position back on October 1st of 2020. I showed you from a Chartology perspective why I got positioned when I did on the charts above.
There is a stock with the symbol GME, GameStock, that is one of the stocks in the RETL index. Indirectly I was involved with that crazy trade and the volatility it caused. I don’t have to tell you how crazy that short period of time was but it was crazy volatile. How did the Chartology know when I first got positioned back in October what the outcome would be? Even with all the volatility in GME note the price objective on the RETL chart above. Some might call it just plain dumb luck that the bullish rising flag could produce a price objective up to 278 almost the exact high. You know what I believe.
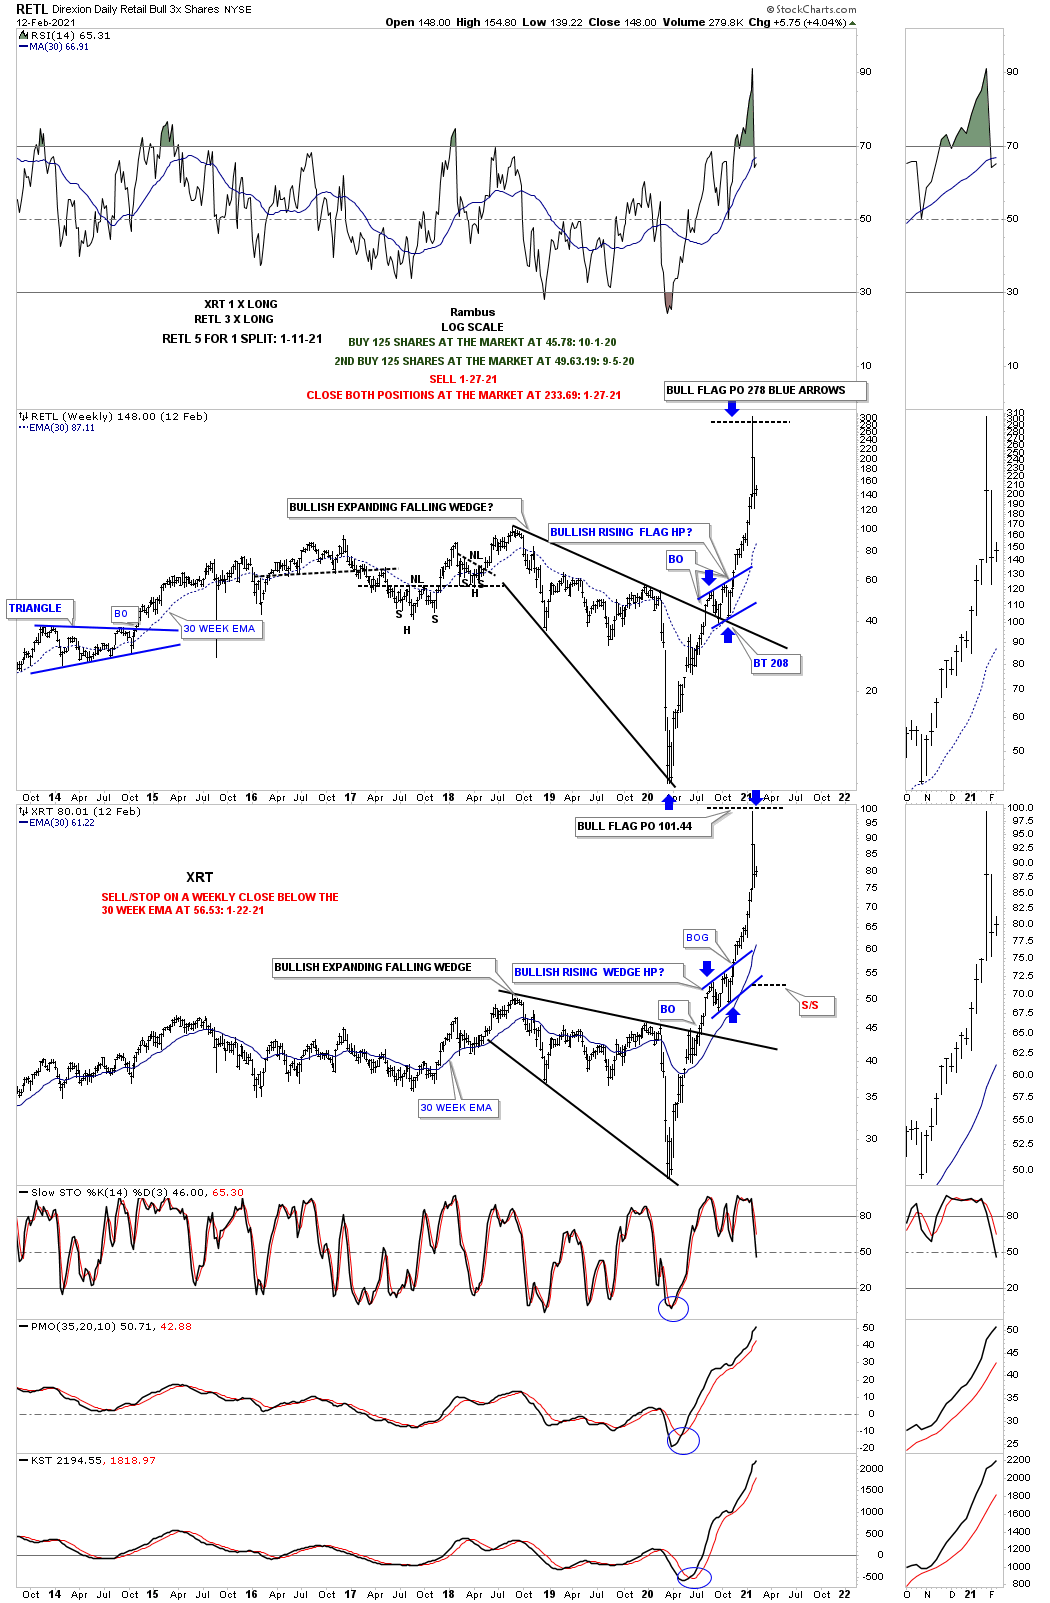
Below is the updated version of the weekly combo chart we used for this 400% trade and what happened. Not all trades go like this but with Chartology on our side we at least have a chance to be successful.
This is the long term monthly combo chart which shows the breakout of the 2015 expanding triangle being helped along by GME. Again, is it just a coincidence that the massive breakout occurred when it did based on everything above or just random noise?

Below is the complete history for the RETL trade. The best way to view this trade is to first scroll all the way down to the bottom and then work your way up to see how the trade evolved. All the best…Rambus