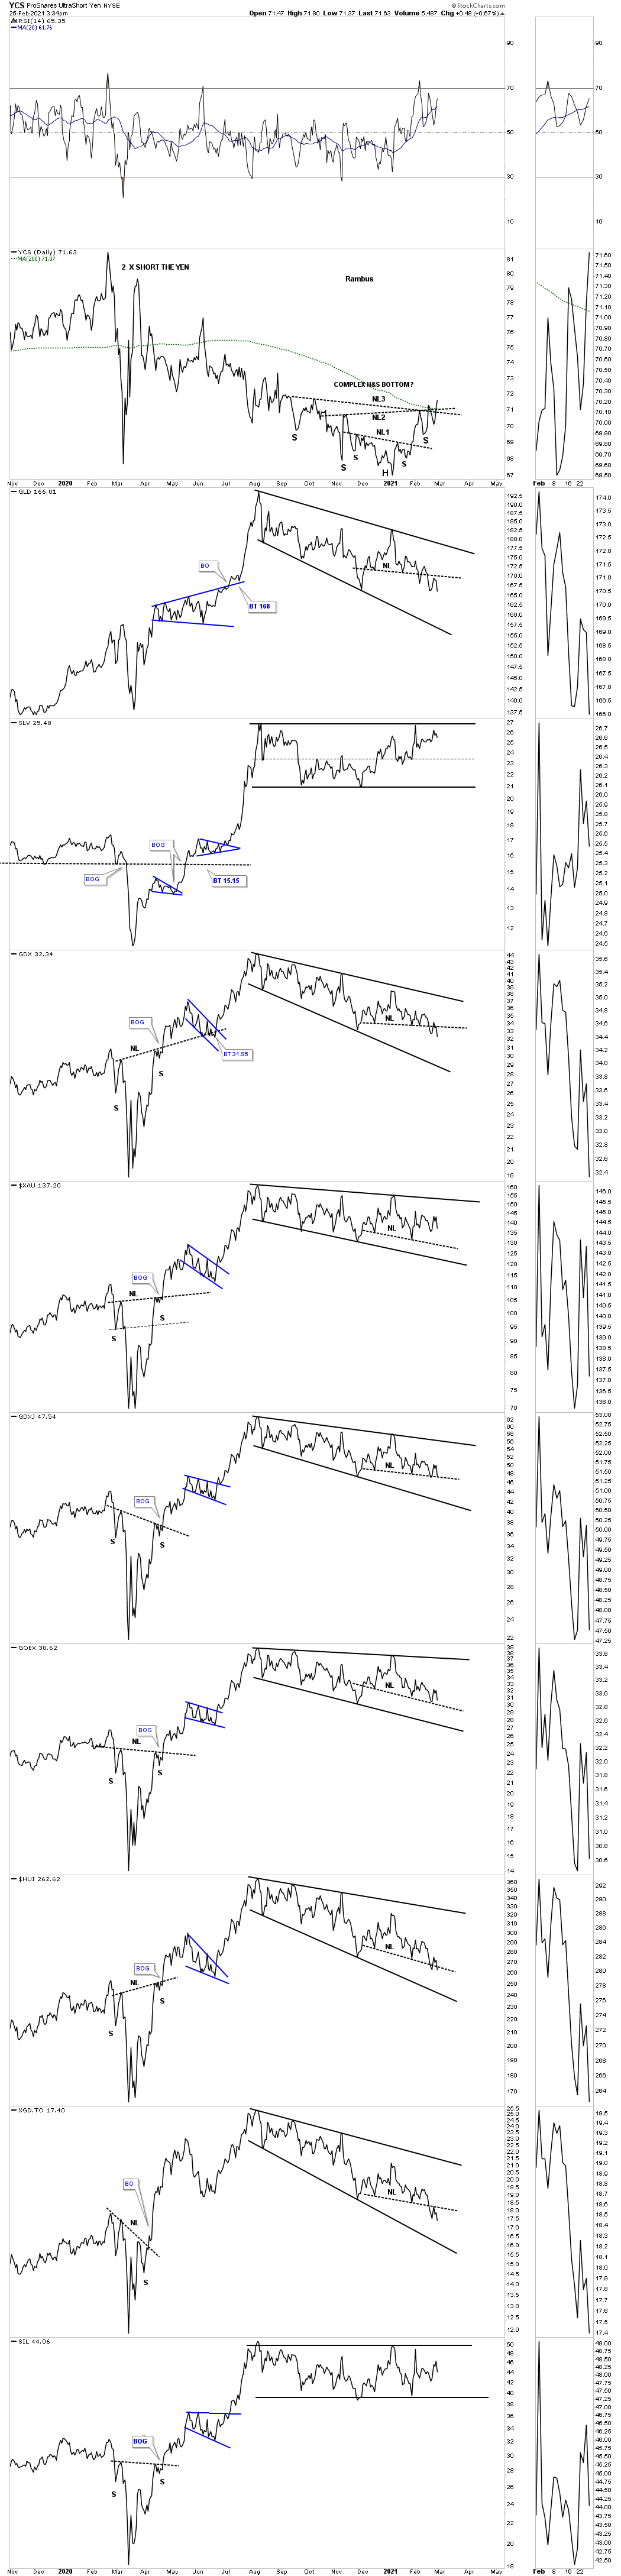
Today the potential H&S tops on this daily line combo charts we’ve been following look a little more formidable.
Below is a daily line combo chart which shows the August trading ranges. The smaller H&S tops forming at the last reversal point would be the right shoulder on the daily line chart above.
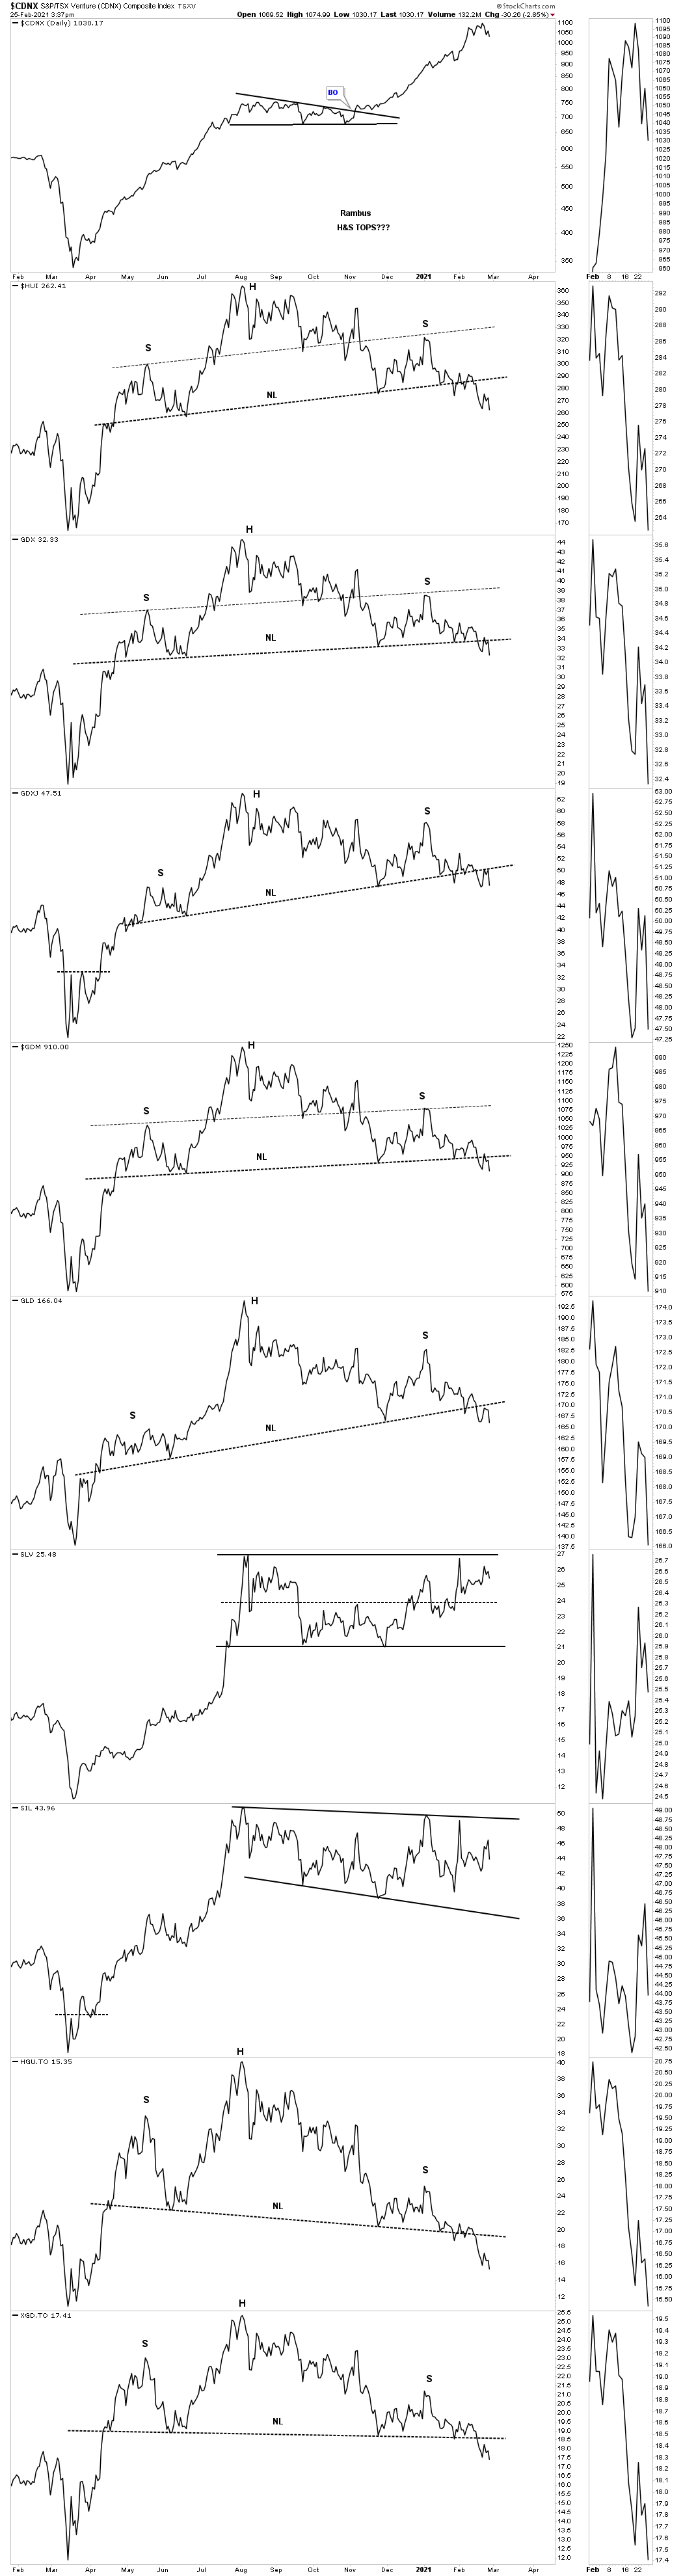
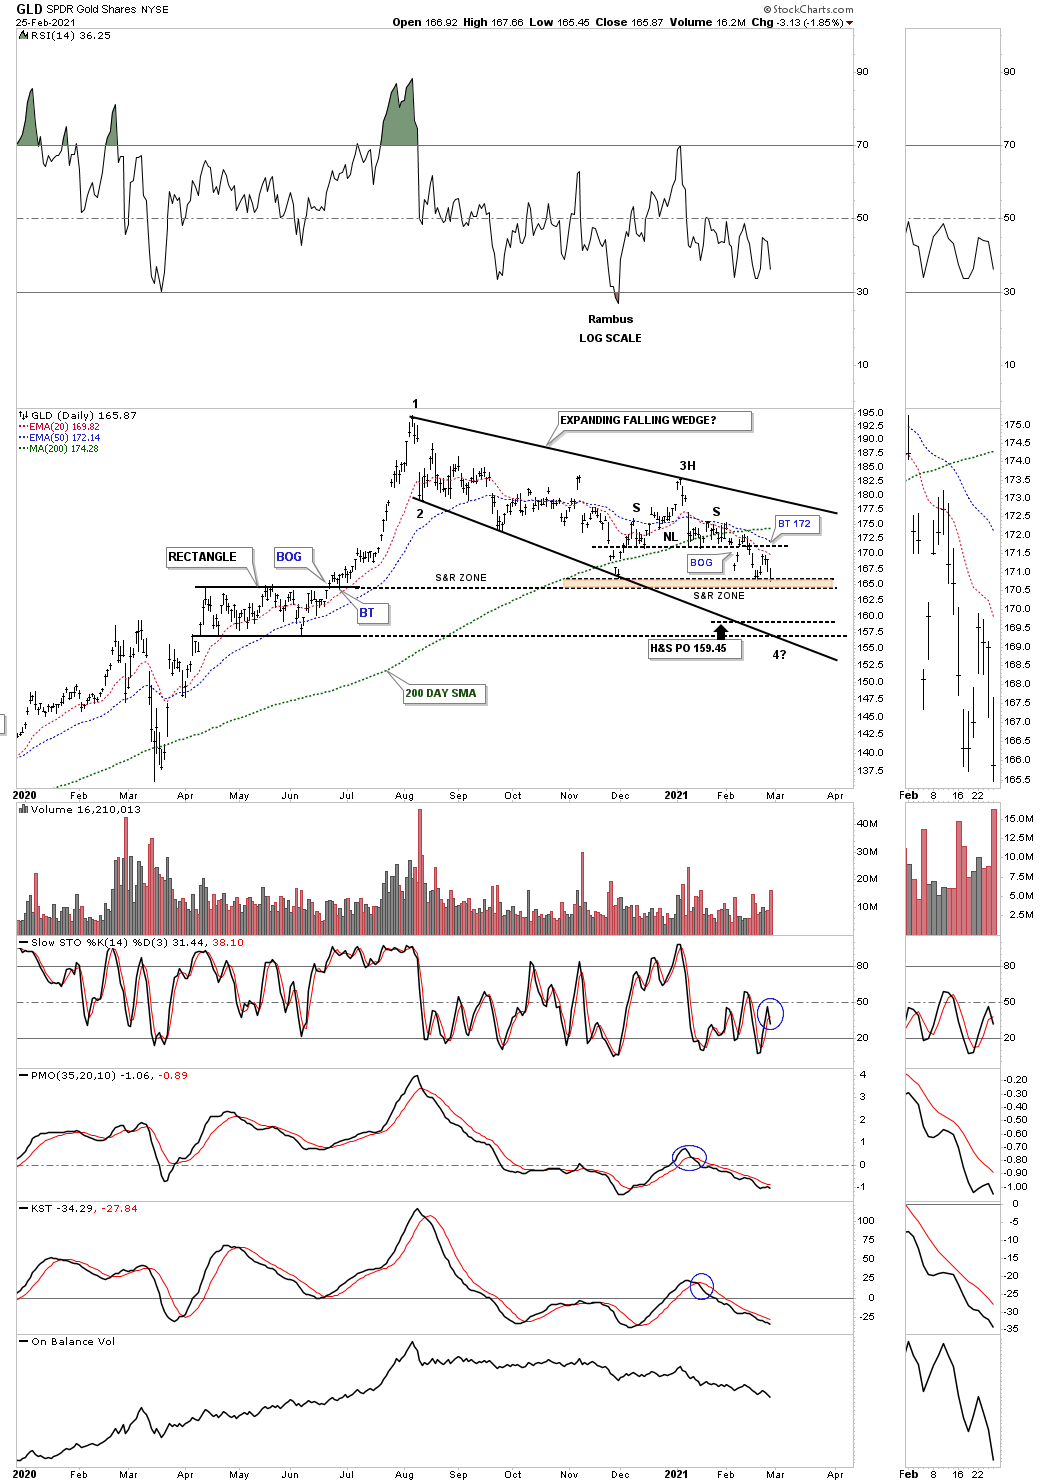
Below is the daily bar chart for the PM complex showing the potential H&S tops stretching back almost a year or so.
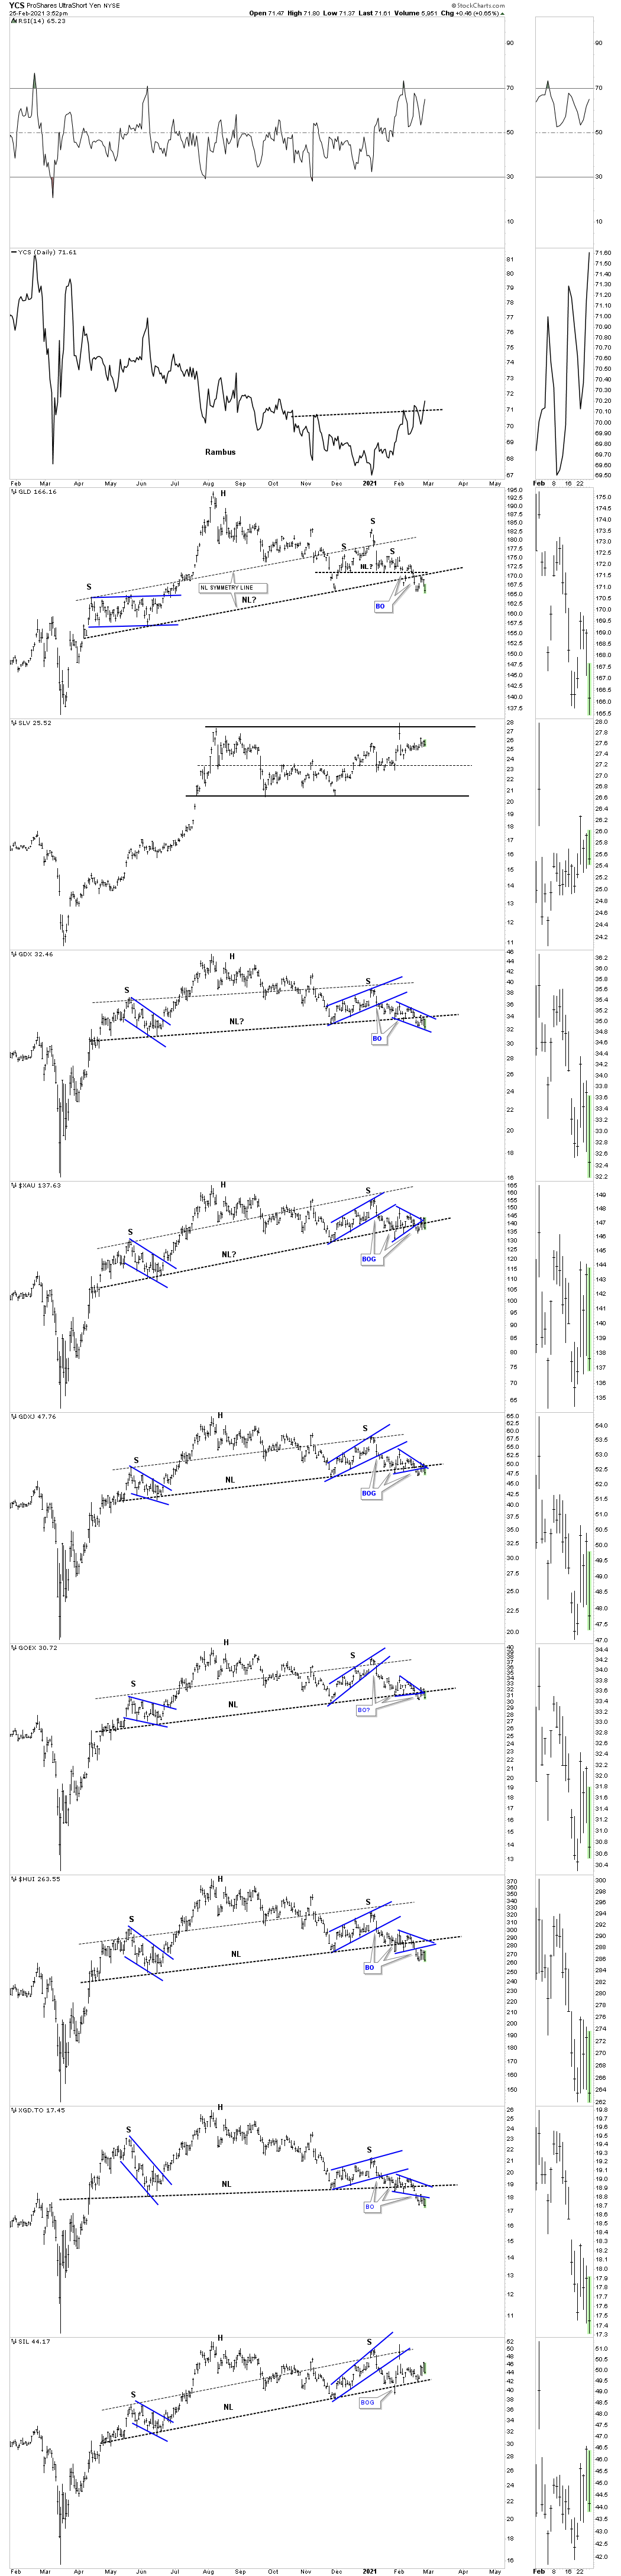
Next is the daily bar chart for the PM complex which shows the August trading range. From this perspective it looks like just another day of consolidation.

GLD is currently testing critical support at the brown shaded S&R zone. The bottom of the S&R zone is taken from the top of the rectangle that formed last last spring while the top of the brown shaded S&R zone is taken from the lows made since the correction began.
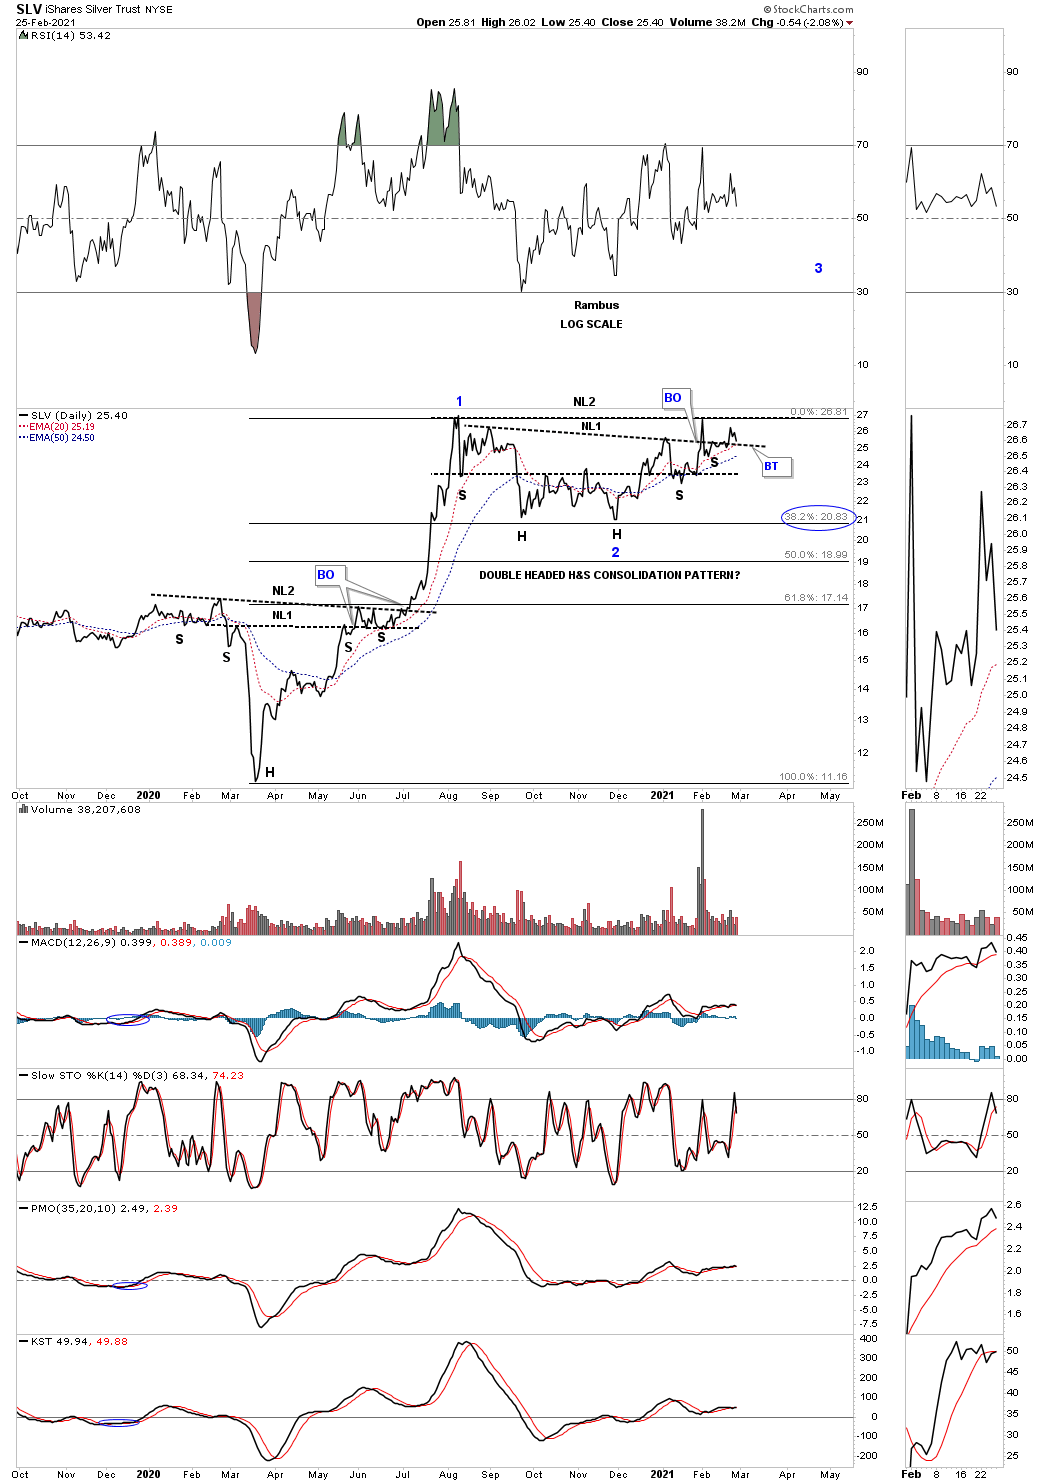
This next chart is a new chart for SLV that I haven’t shown you yet. The reversal pattern that launched the first impulse move up was a double H&S bottom with 2 necklines. Once neckline #2 gave way the impulse began in full swing until the high was reached in August of last year. Since that high SLV has been building out a possible 2nd double H&S bottom which has 2 heads. Generally the symmetry isn’t as pretty on a double H&S pattern. If this possible double H&S bottom is going to play out NL1 should hold support as the backtest. If neckline #1 fails to hold support then I would expect another leg down to the bottom of the August trading range.
The possible double H&S bottom is why I decided to pick up some silver stocks over the last several days. I know it doesn’t feel like it but if you look at the price action beginning at the 2020 March crash low to the August high that was one heck of an impulse move. The price action we see since the August high is nothing more than a consolidation phase consolidating that first impulse move up. An Elliot Waver might call the March to August rally a wave 1 with the August trading range a wave 2. If, and we don’t know the answer yet, but if the August trading range is a wave 2 correction then wave 3 should be next which is usually the longest of the 5 waves. The fib retrace of the entire first impulse leg up has been 38% which is right in line with this type of correction.
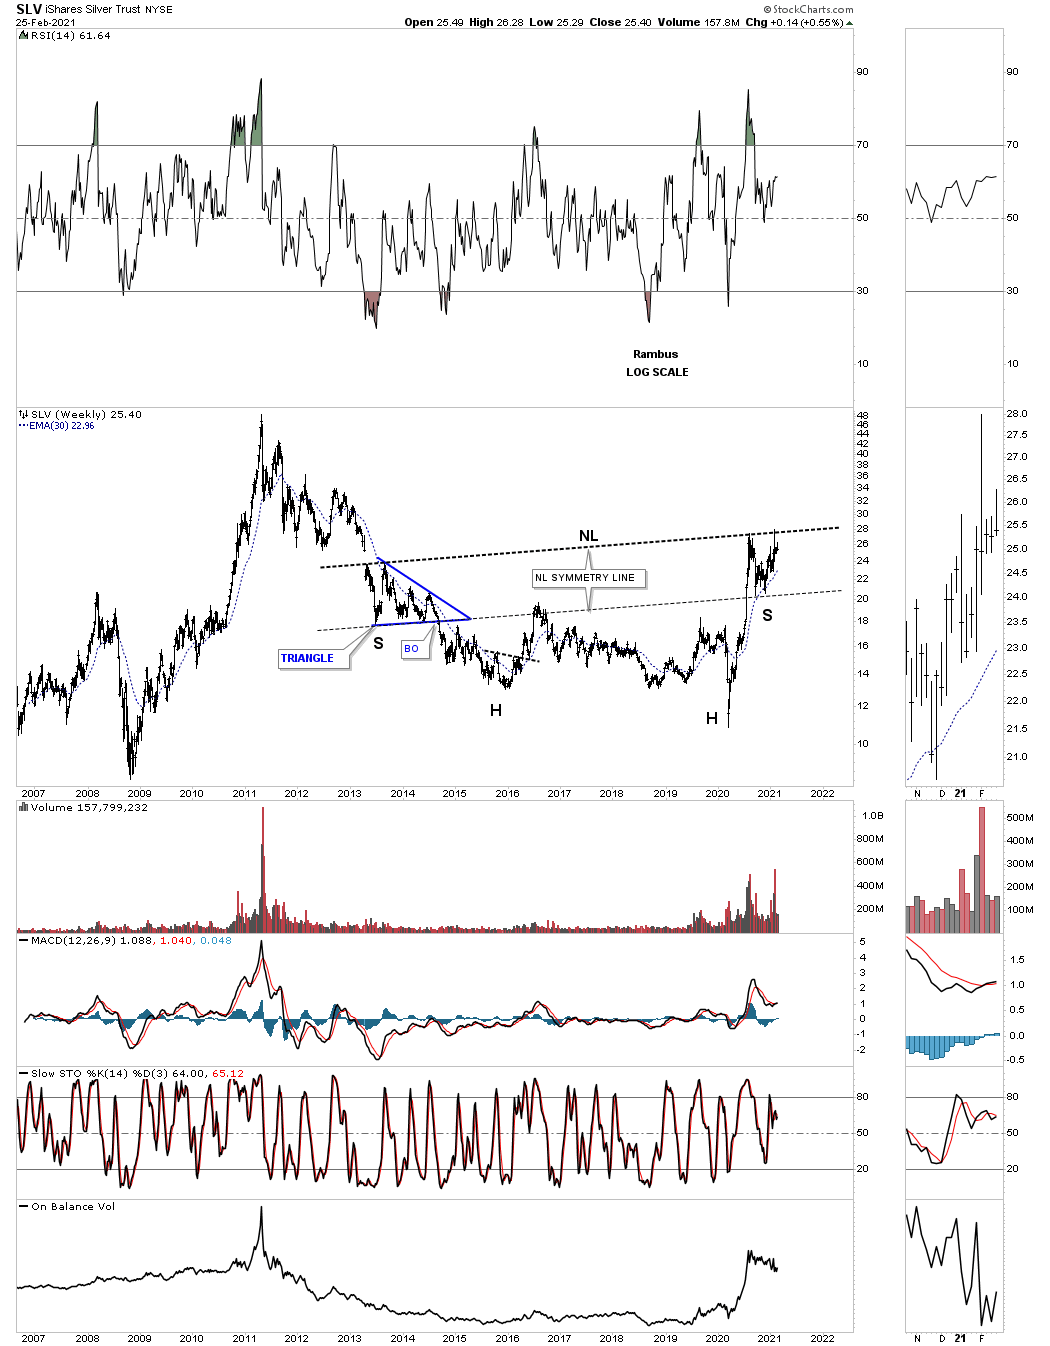
This last chart for today is another new chart I haven’t shown you yet for SLV which is a weekly bar chart. SLV could be building out a massive double headed 8 year H&S bottom. Note how the neckline symmetry line has shown us the low for the right shoulder which is the August trading range. The left shoulder formed the blue triangle with 6 reversal points. So the million dollar question is, what type of consolidation pattern is going to form the right shoulder, the H&S consolidation pattern on the daily chart above or will we see another move back down to the bottom of the August trading range and the neckline symmetry line. All the best…Rambus