When one just focuses on an index it can be misleading at times. Depending on what index one is looking at there are a number of individual stocks that make up that index. In a strong impulse move most of the individual stocks will shows bullish characteristics with a few that are lagging and some of the weaker ones not participating at all.
When an index itself is showing you a mixed bag it then pays to look under the hood to see what the individual stocks that make up that index look like. Not always, but many times some of the stronger stocks that led that particular index higher can be the first to start building a reversal pattern undercover of some of the marginal stocks taking up the slack giving the index a false sense of bullishness.
Tonight I would like to look under the hood for the HUI and several other PM stocks to see what they look like compared to the HUI in general. Keep in mind when you look at these PM stocks that they have been in correction mode for exactly one year now. When looking at these PM stocks to follow ask yourself, does this correction look finished or is there more room to the downside?
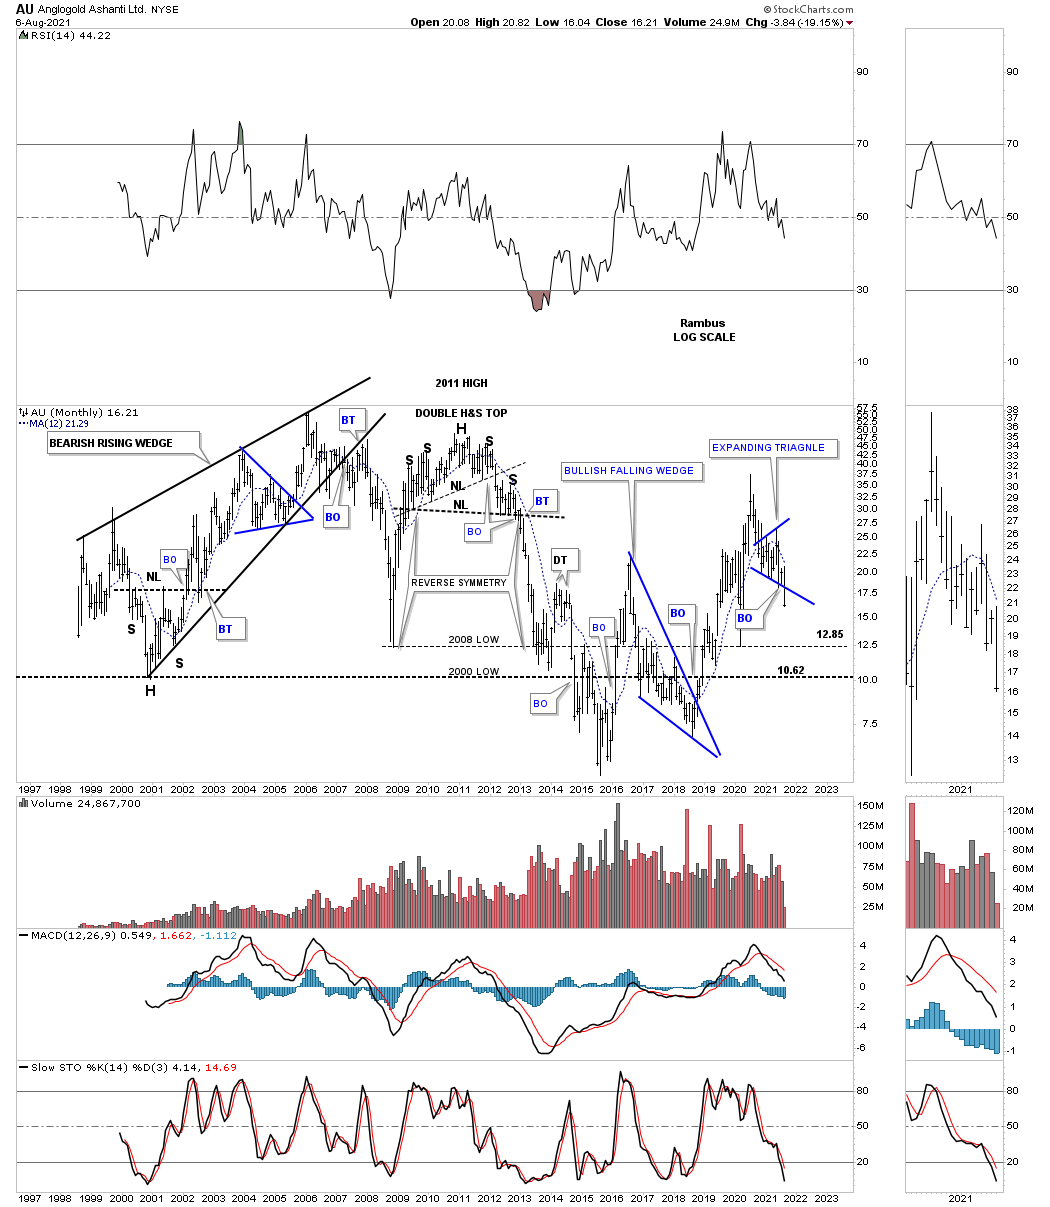
Lets start with the AU which has broken down from the blue expanding triangle this month.
AXU MONTHLY: I’ve been showing you on the daily chart for the AXU that it had broken down from a 5 point rectangle reversal pattern. To negate the breakout or any breakout for that matter, once the price action trades back into the pattern the breakout is negated for the time being.

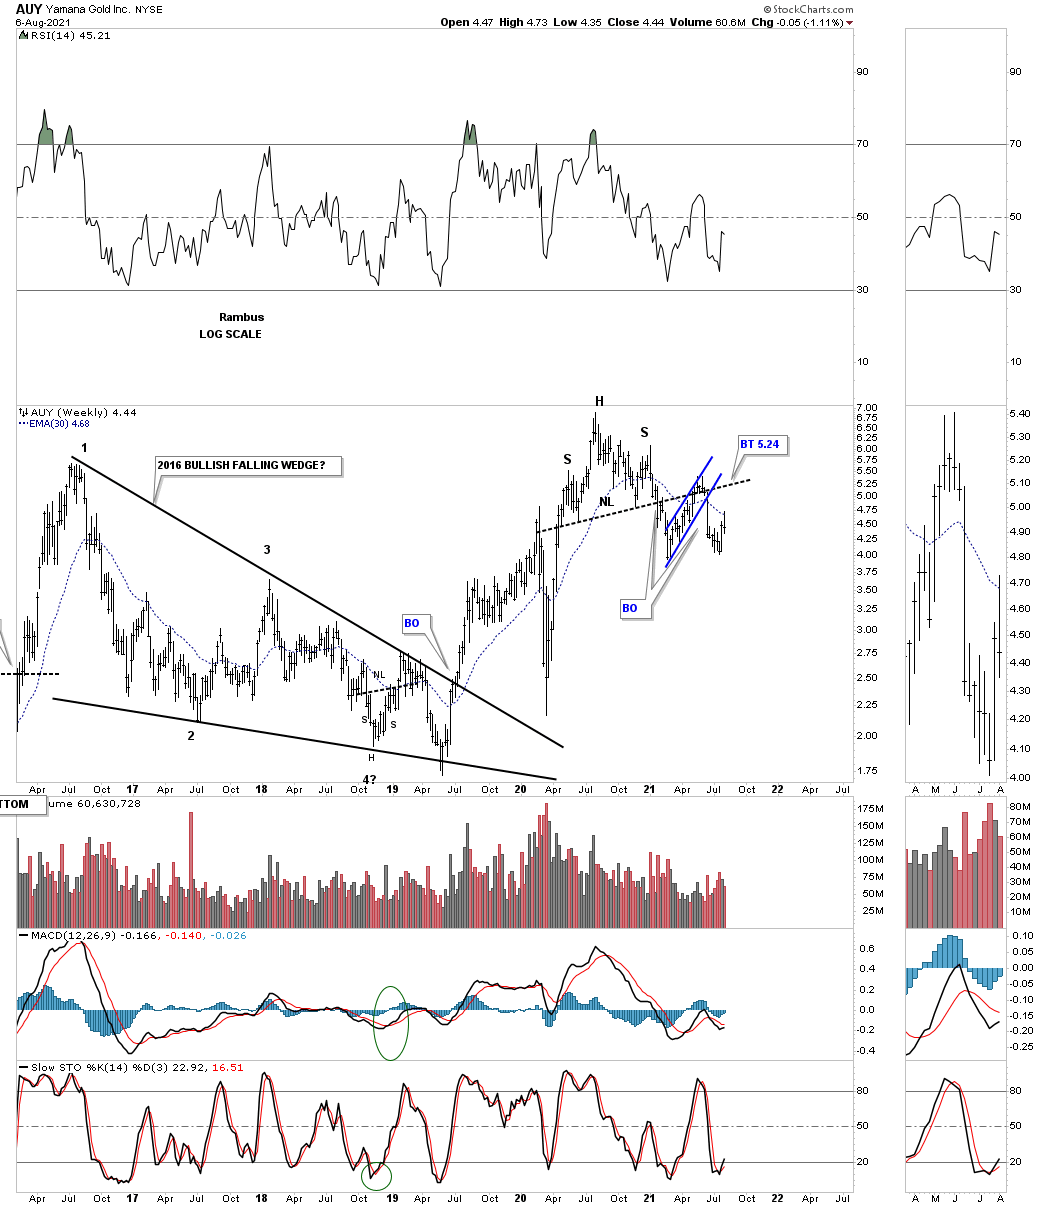
AUY WEEKLY: H&S top with breakout and backtest complete.
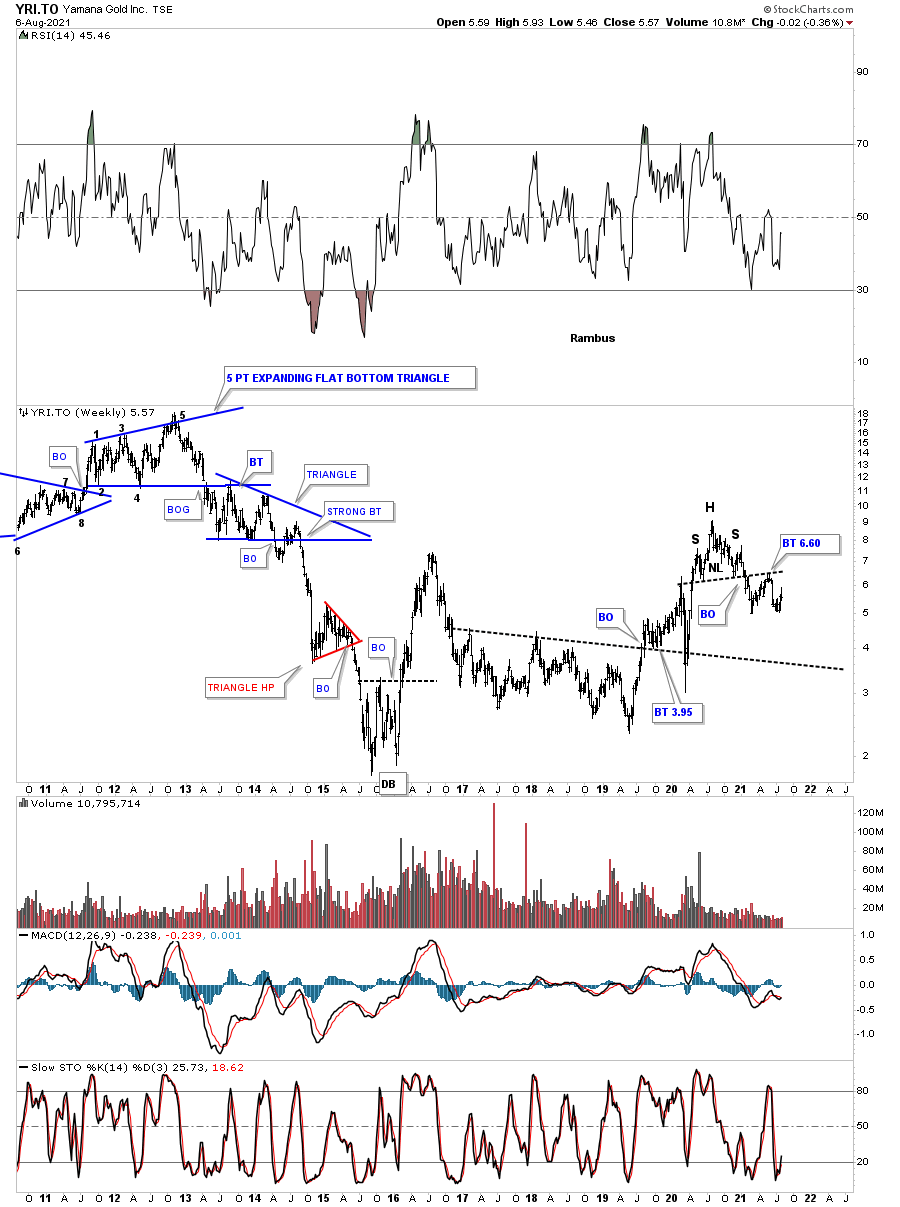
YIR.TO MONTHLY the Canadian version:
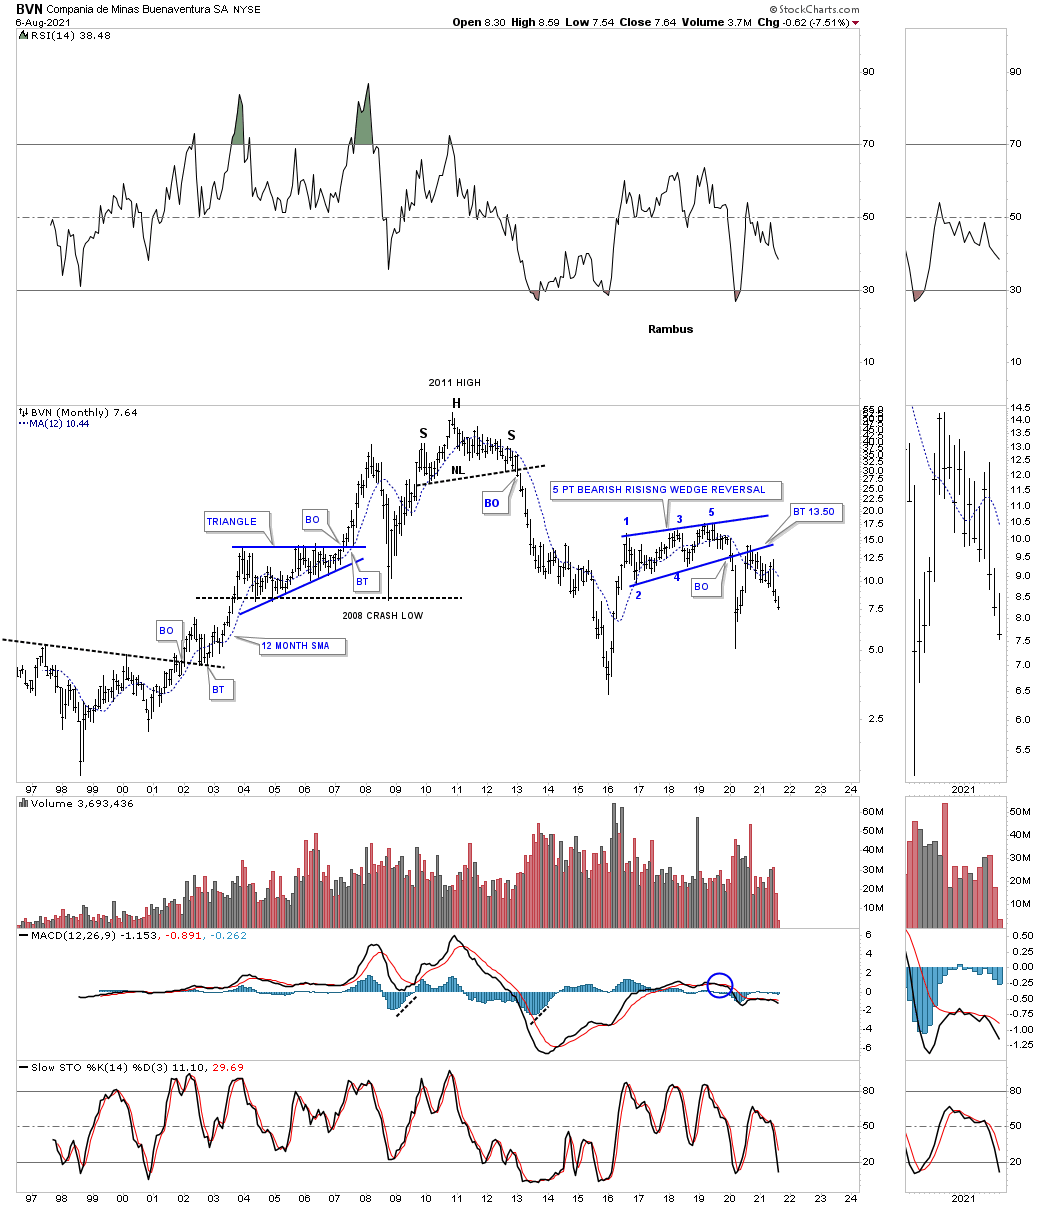
BVN MONTHLY: Five point bearish rising wedge reversal pattern.
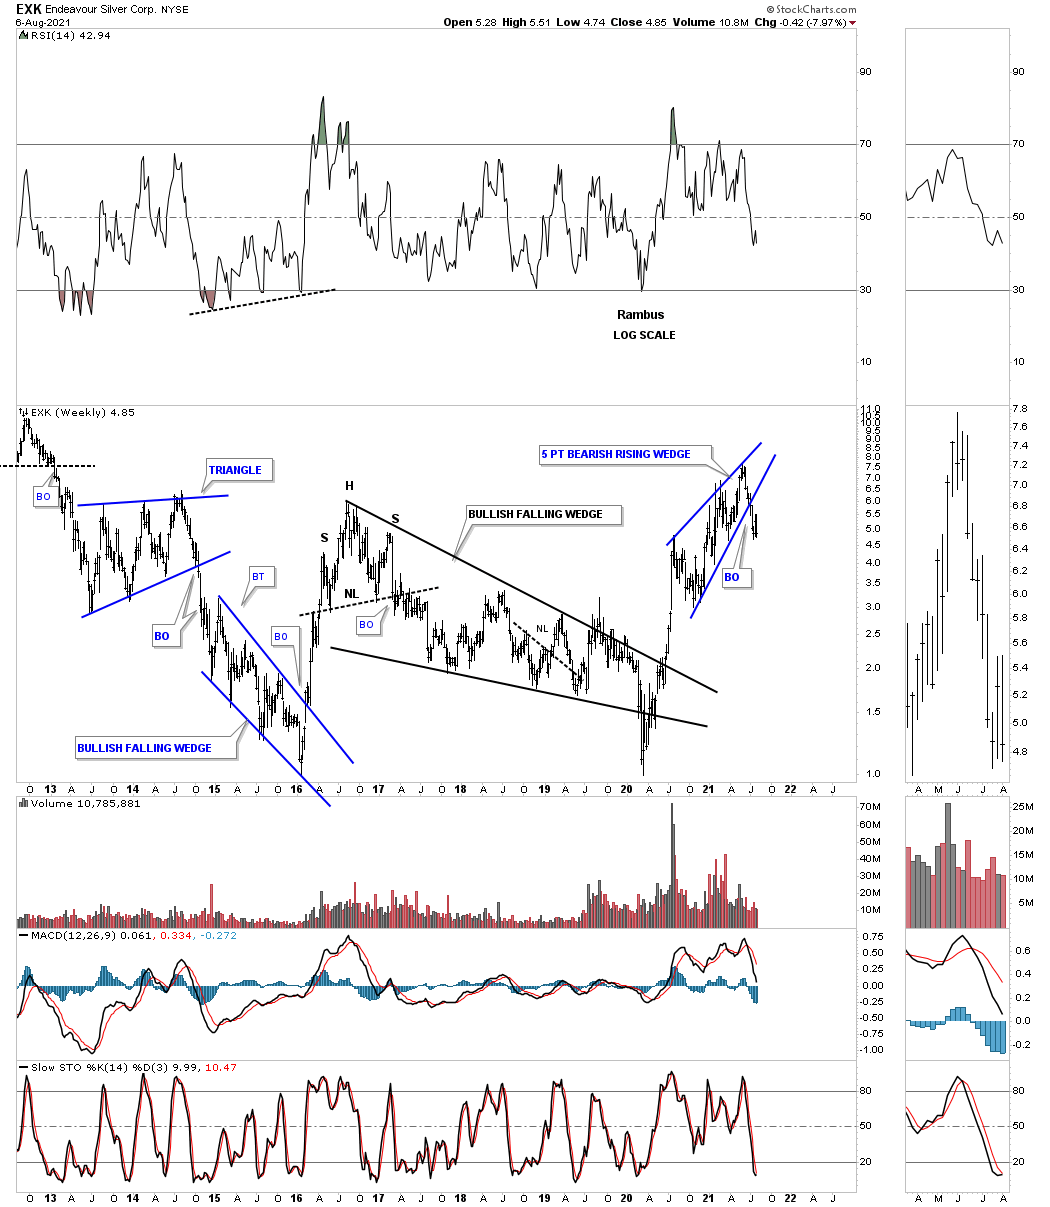
EXK WEEKLY: Five point bearish rising wedge reversal pattern.
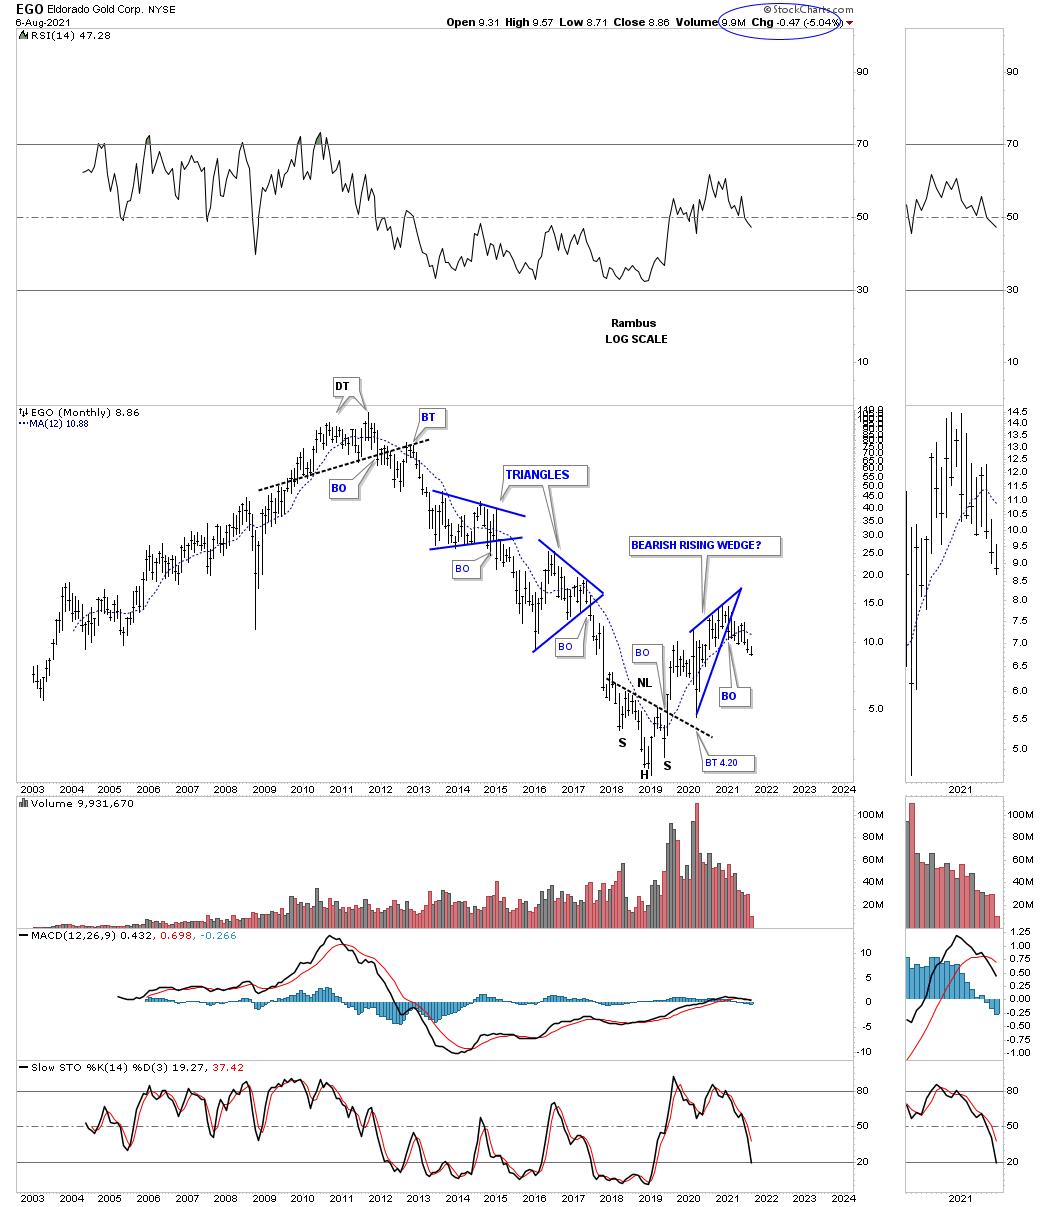
EGO MONTHLY: Five point bearish rising wedge reversal pattern.
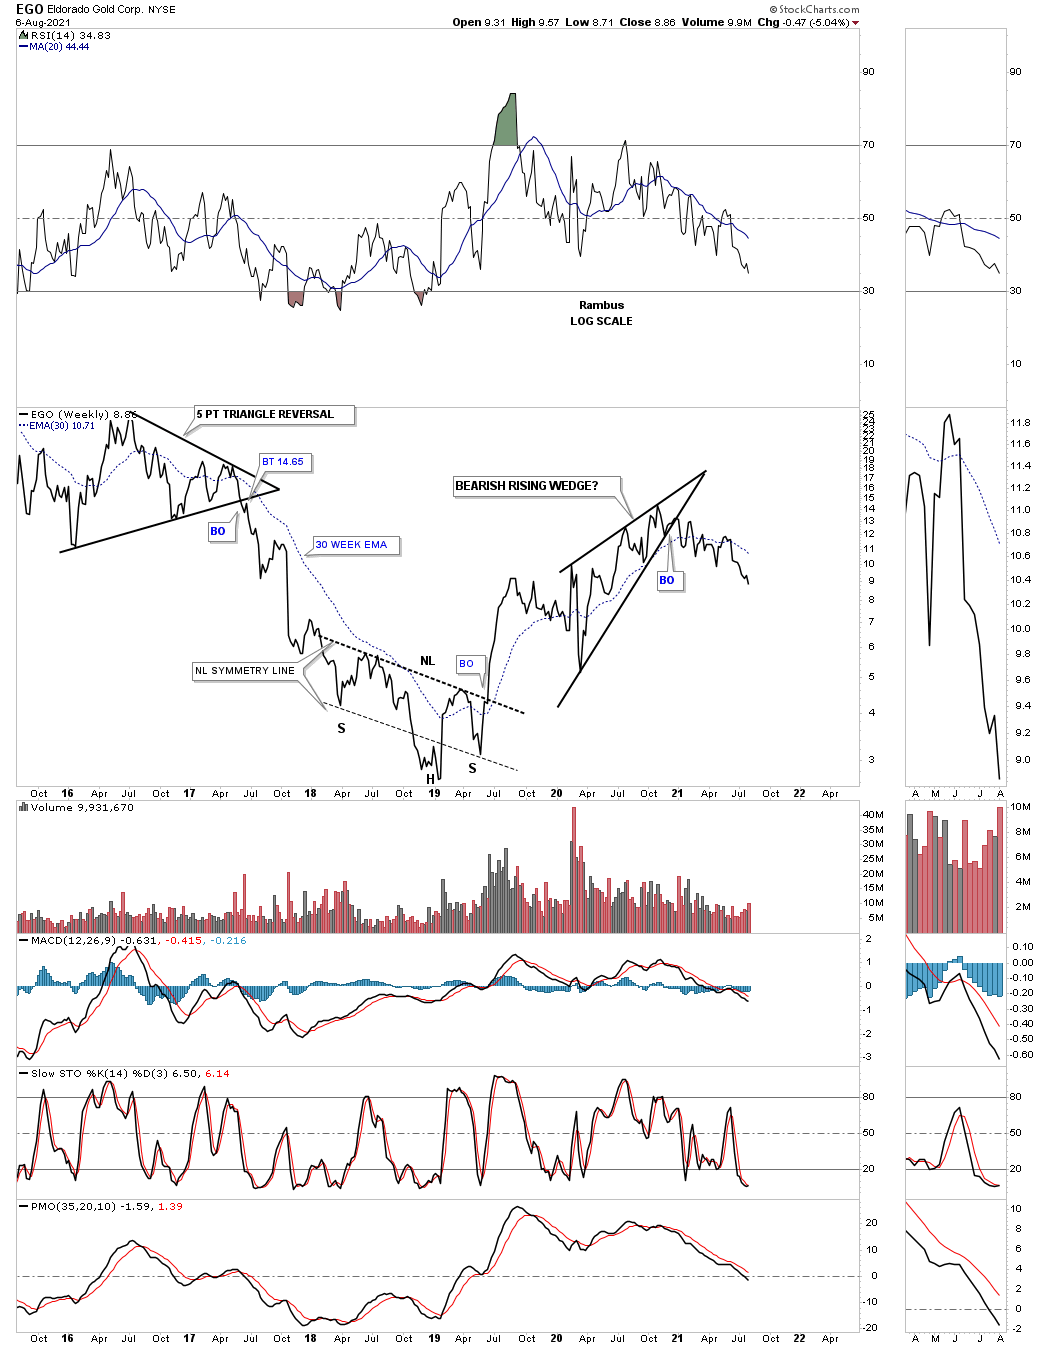
EGO WEEKLY LINE CHART:
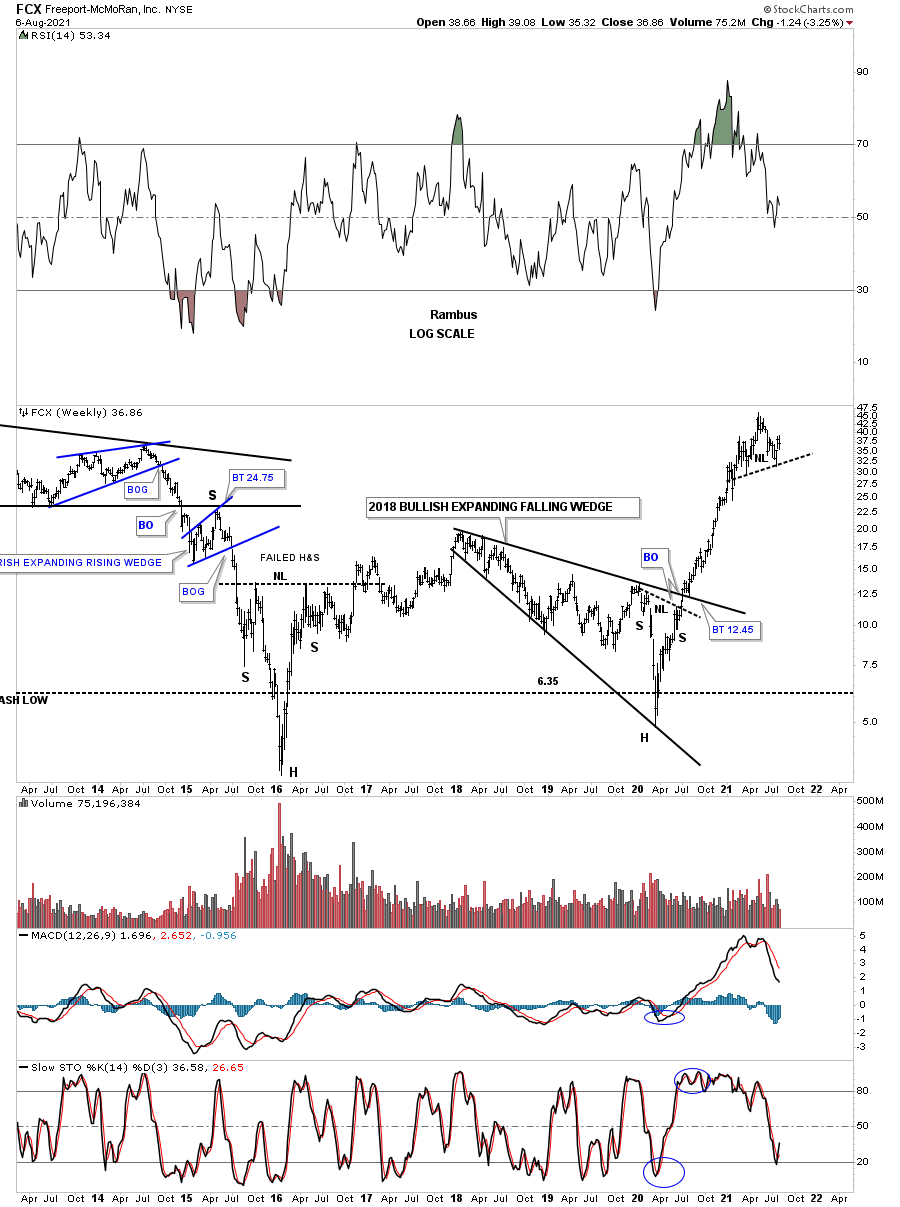
FCX WEEKLY: Possible H&S top?
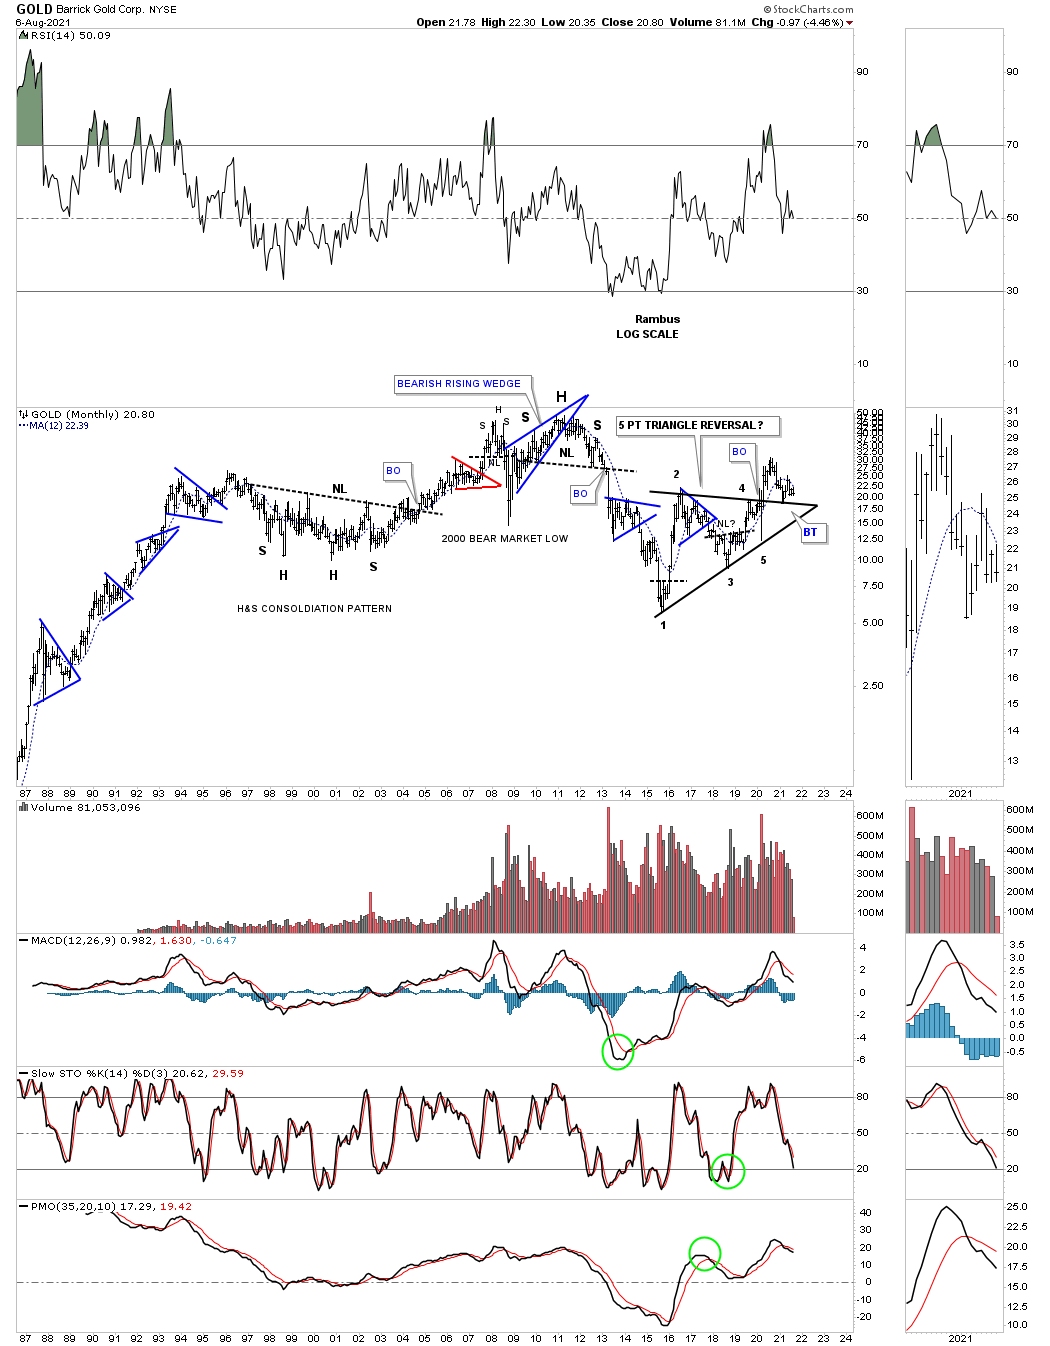
ABX MONTHLY: Critical backtest in progress.
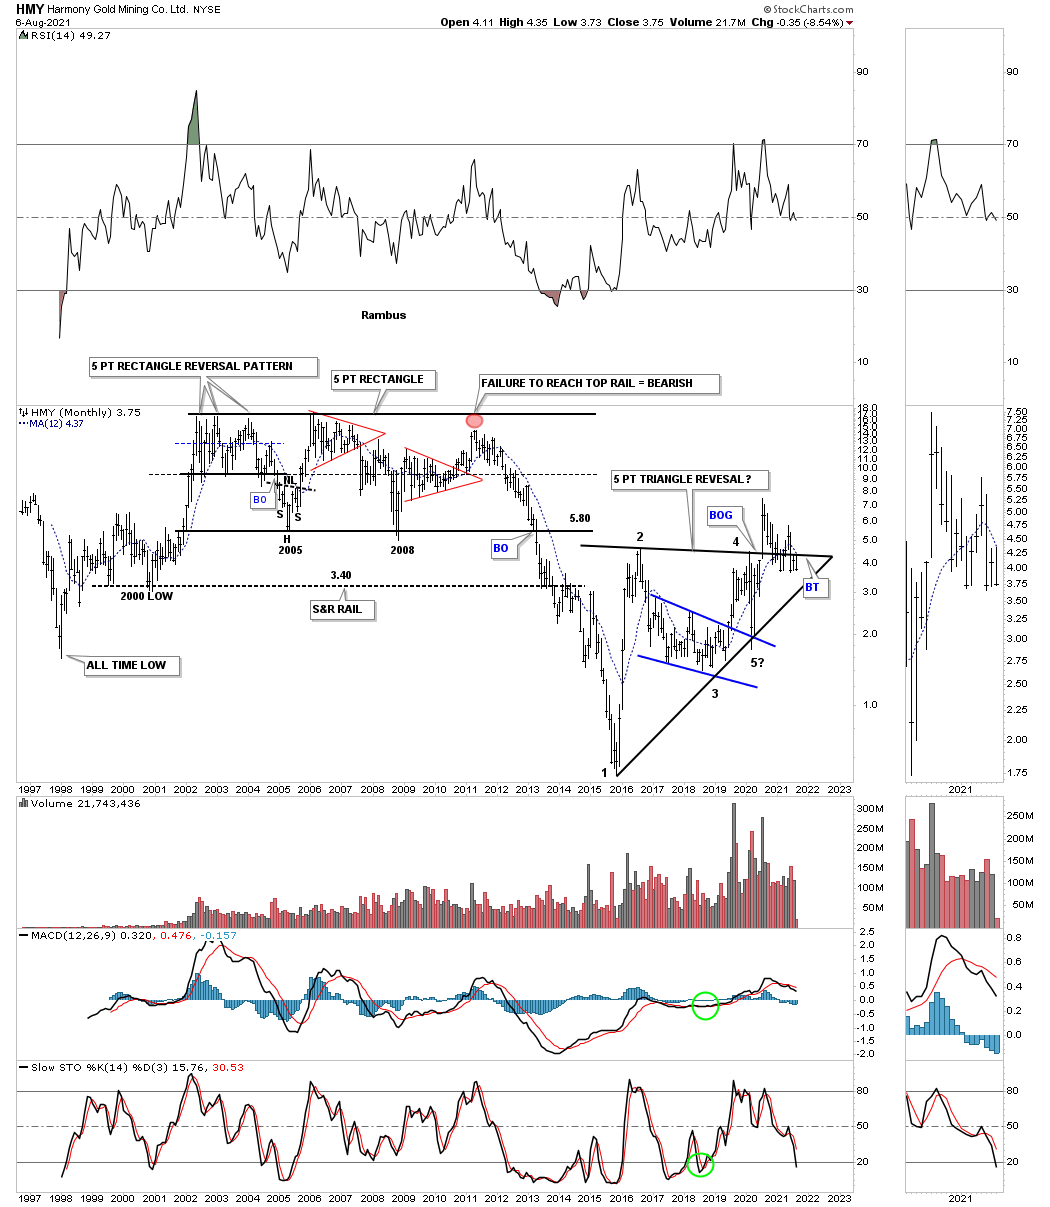
HMY MONTHLY: Top rail of the 2016 five point triangle starting to fail.
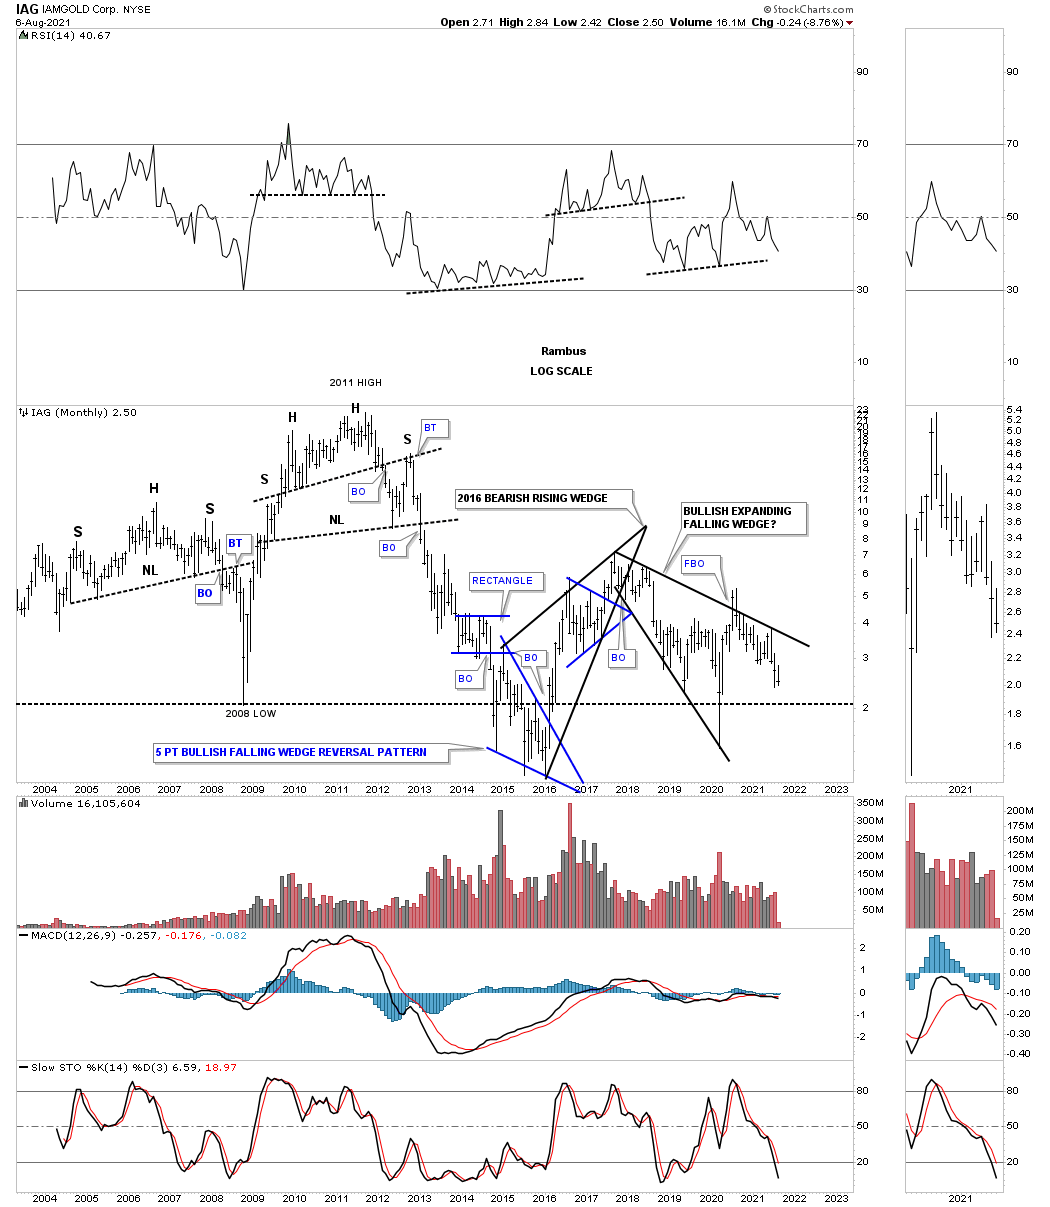
IAG MONTHLY:
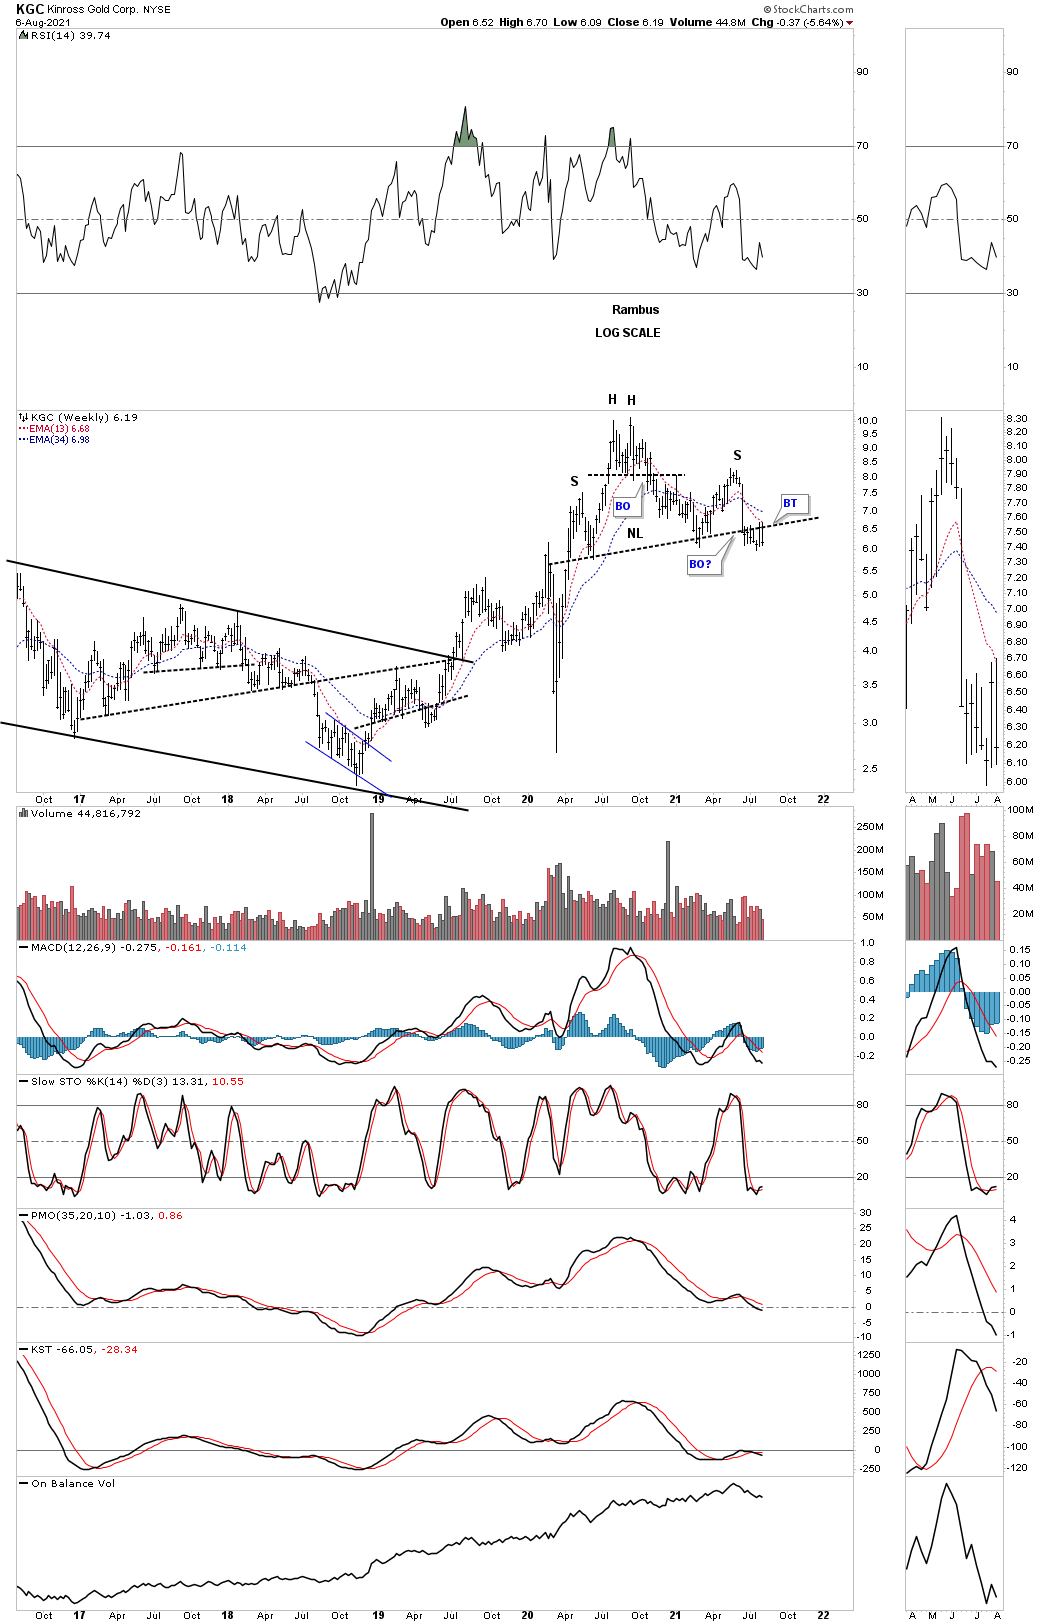
KGC WEEKLY: H&S top with a backtest in progress?
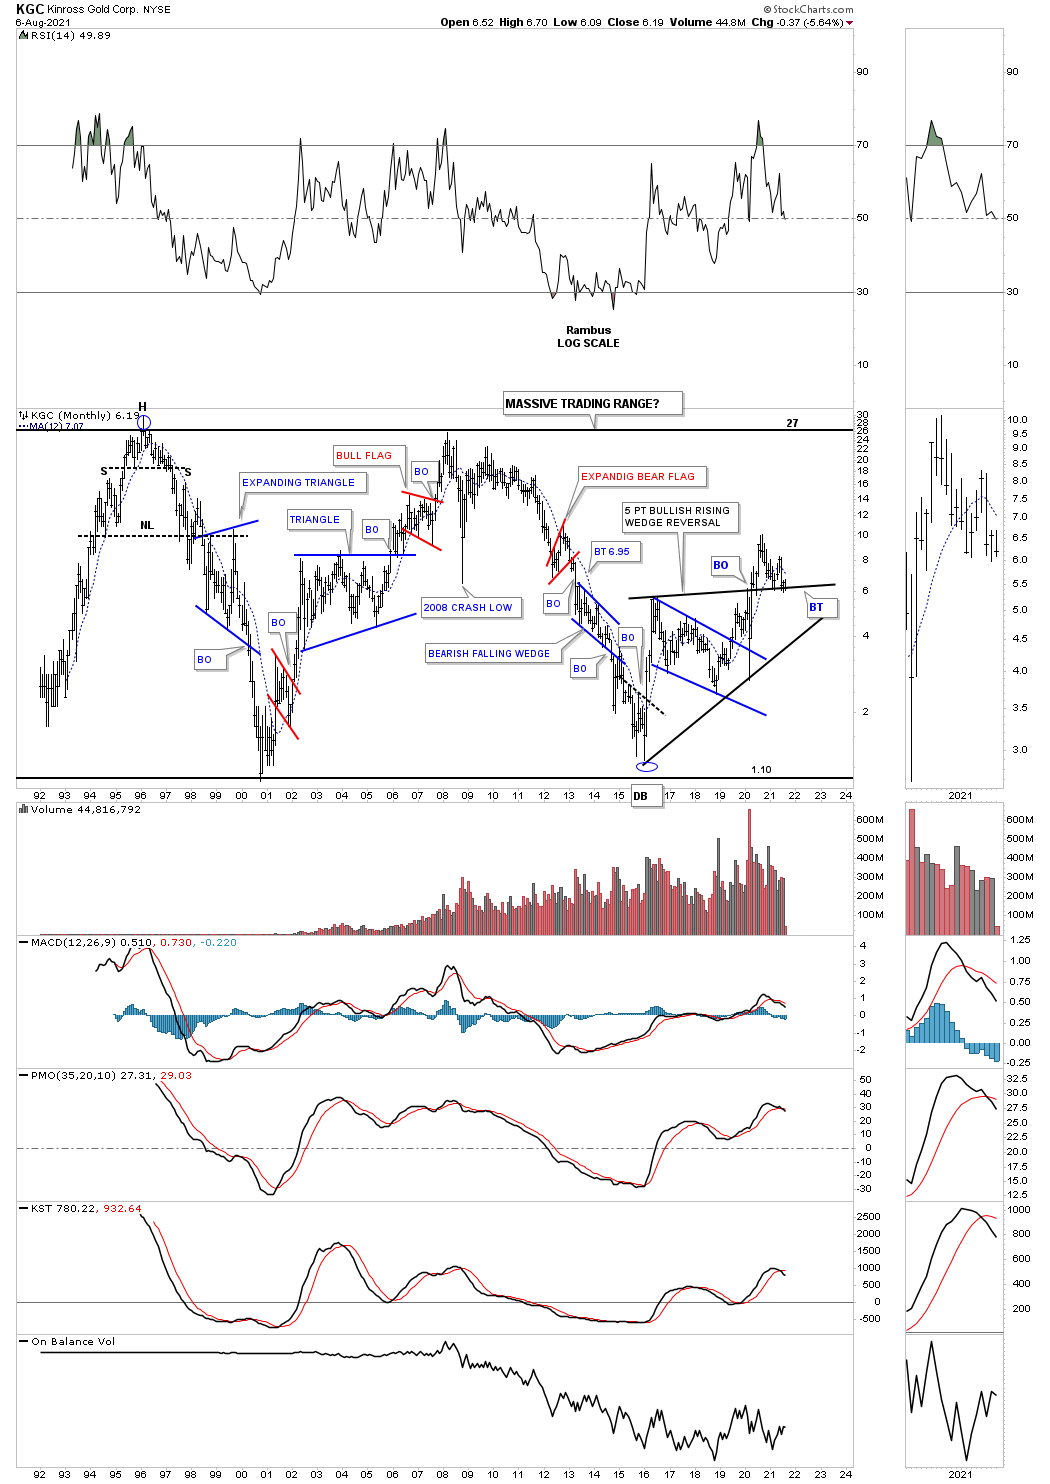
KGC MONTHLY: Critical backtest underway.
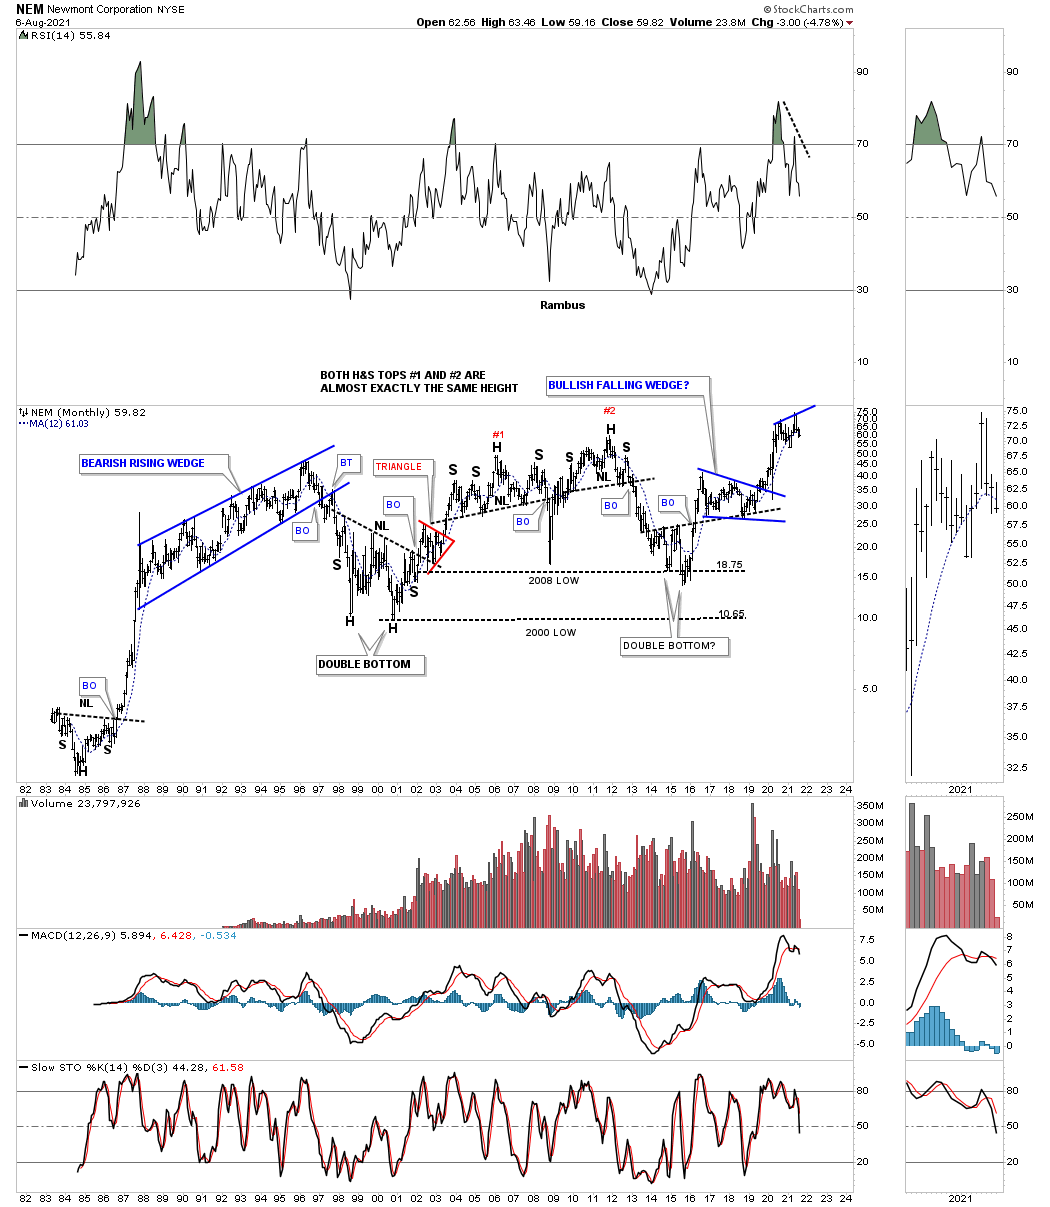
NEM WEEKLY: This is one of the leaders and whichever direction the breakout takes place should tell us a lot about the next important direction for the PM stocks.

NEM MONTHLY: After hitting a new all time high recently is NEM going to consolidate its gains or form some type of reversal pattern?
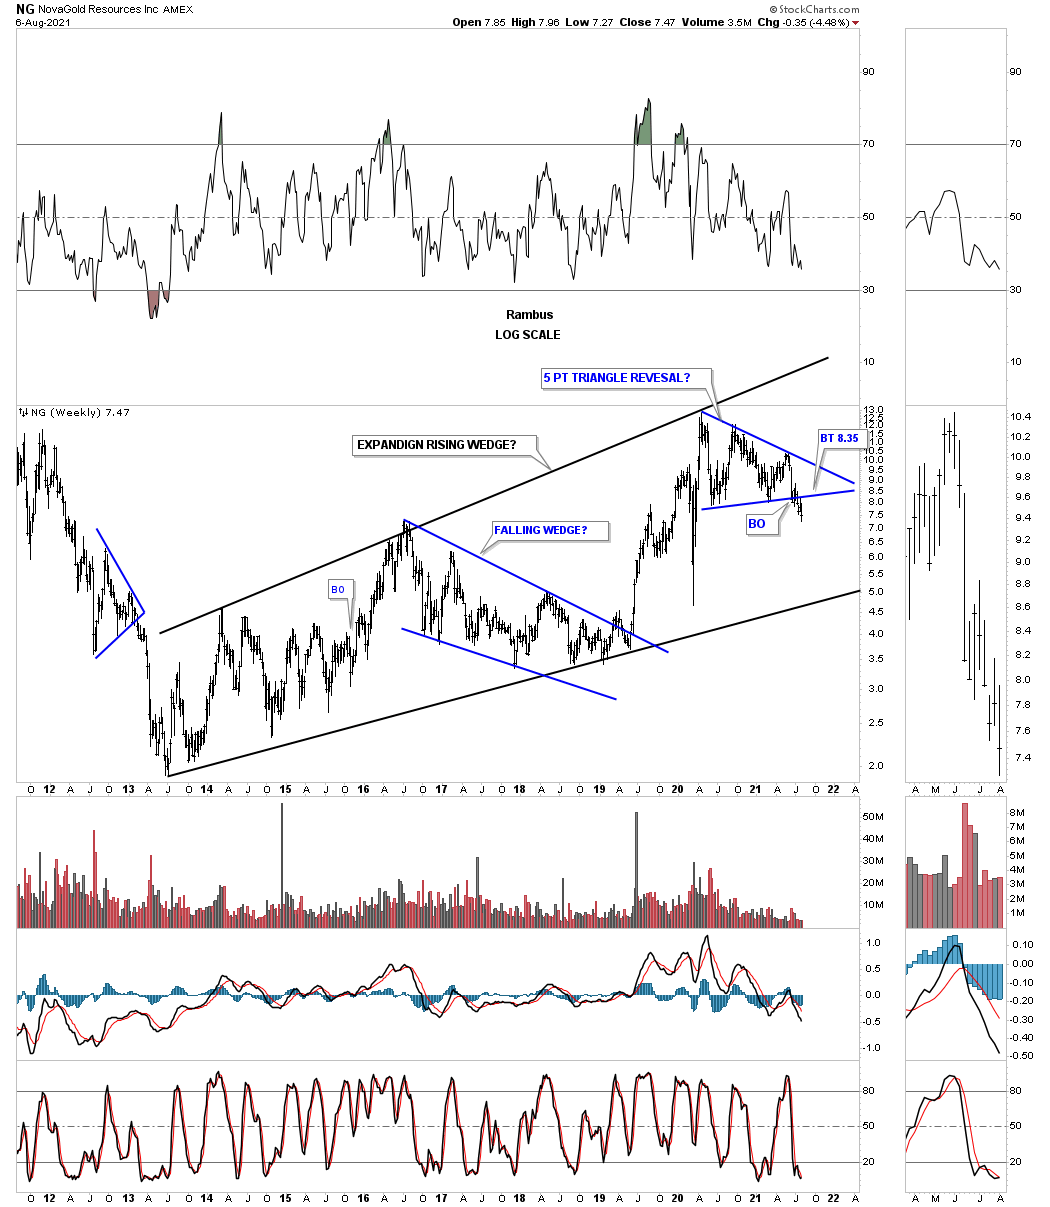
NG WEEKLY: Breakout and backtest underway.
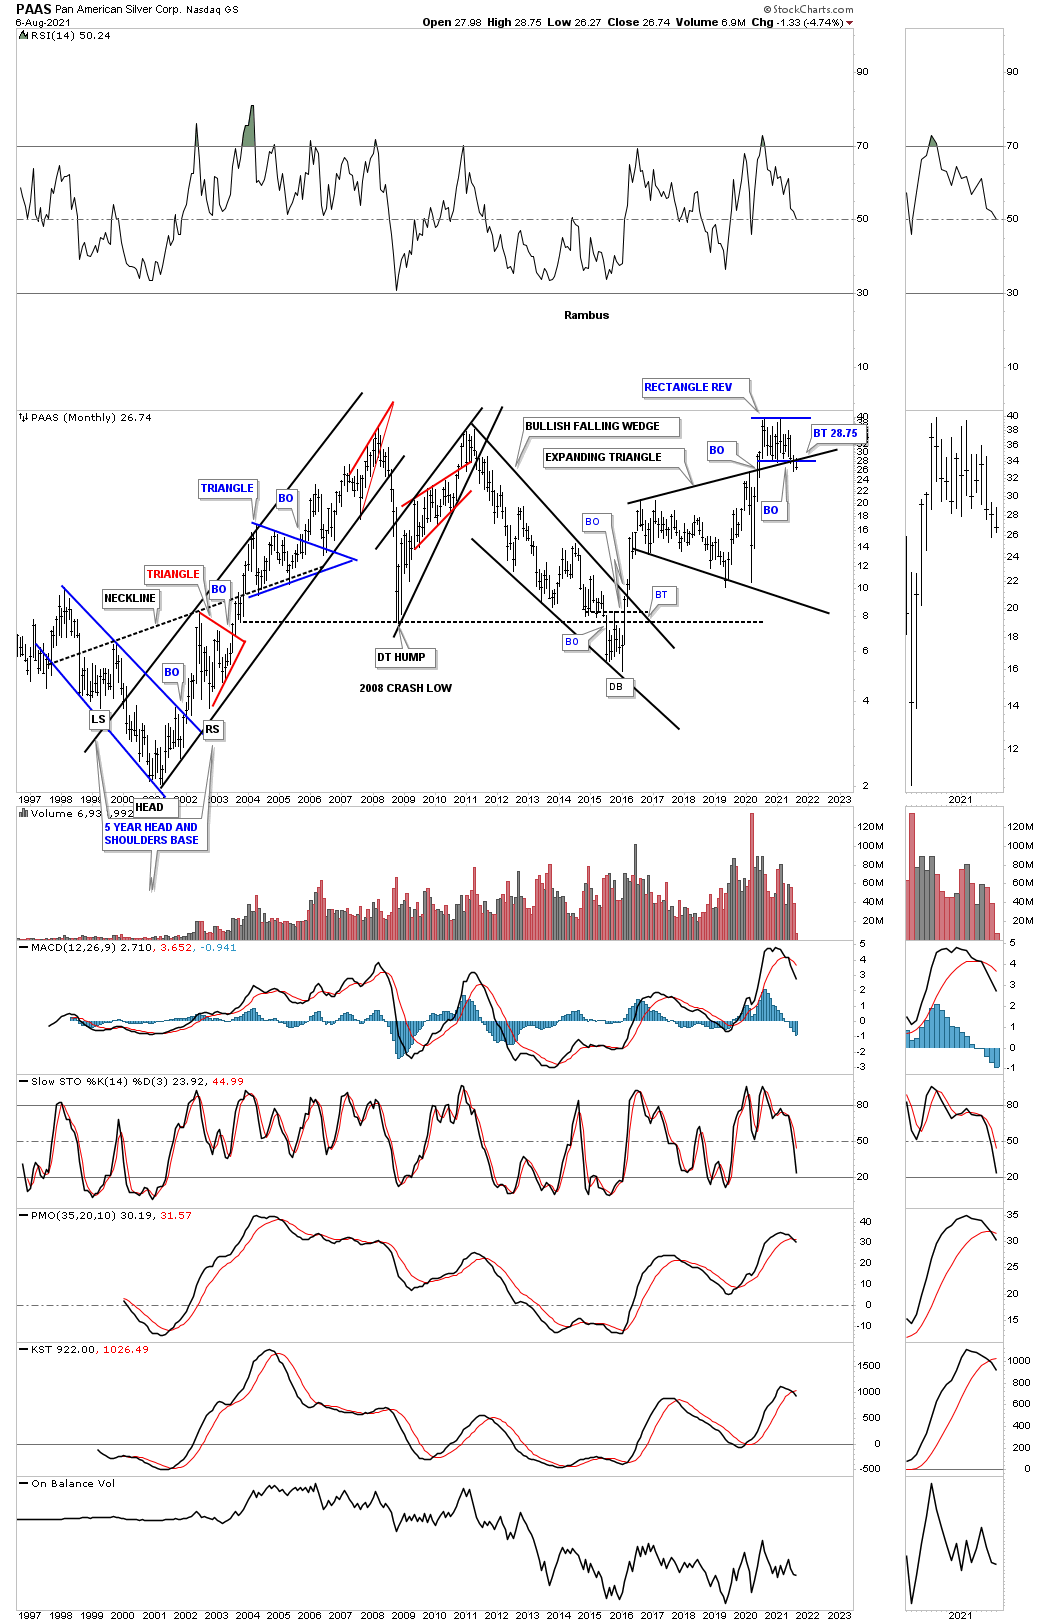
PAAS MONTHLY: Another rectangle reversal pattern forming on top of the 2016 expanding triangle. Last month the price action broke below both the bottom rail of the blue rectangle and the top rail of the black expanding triangle. This is not what you want to see in a strong impulse move, a consolidation pattern yes that breaks out to the upside but not to the downside.
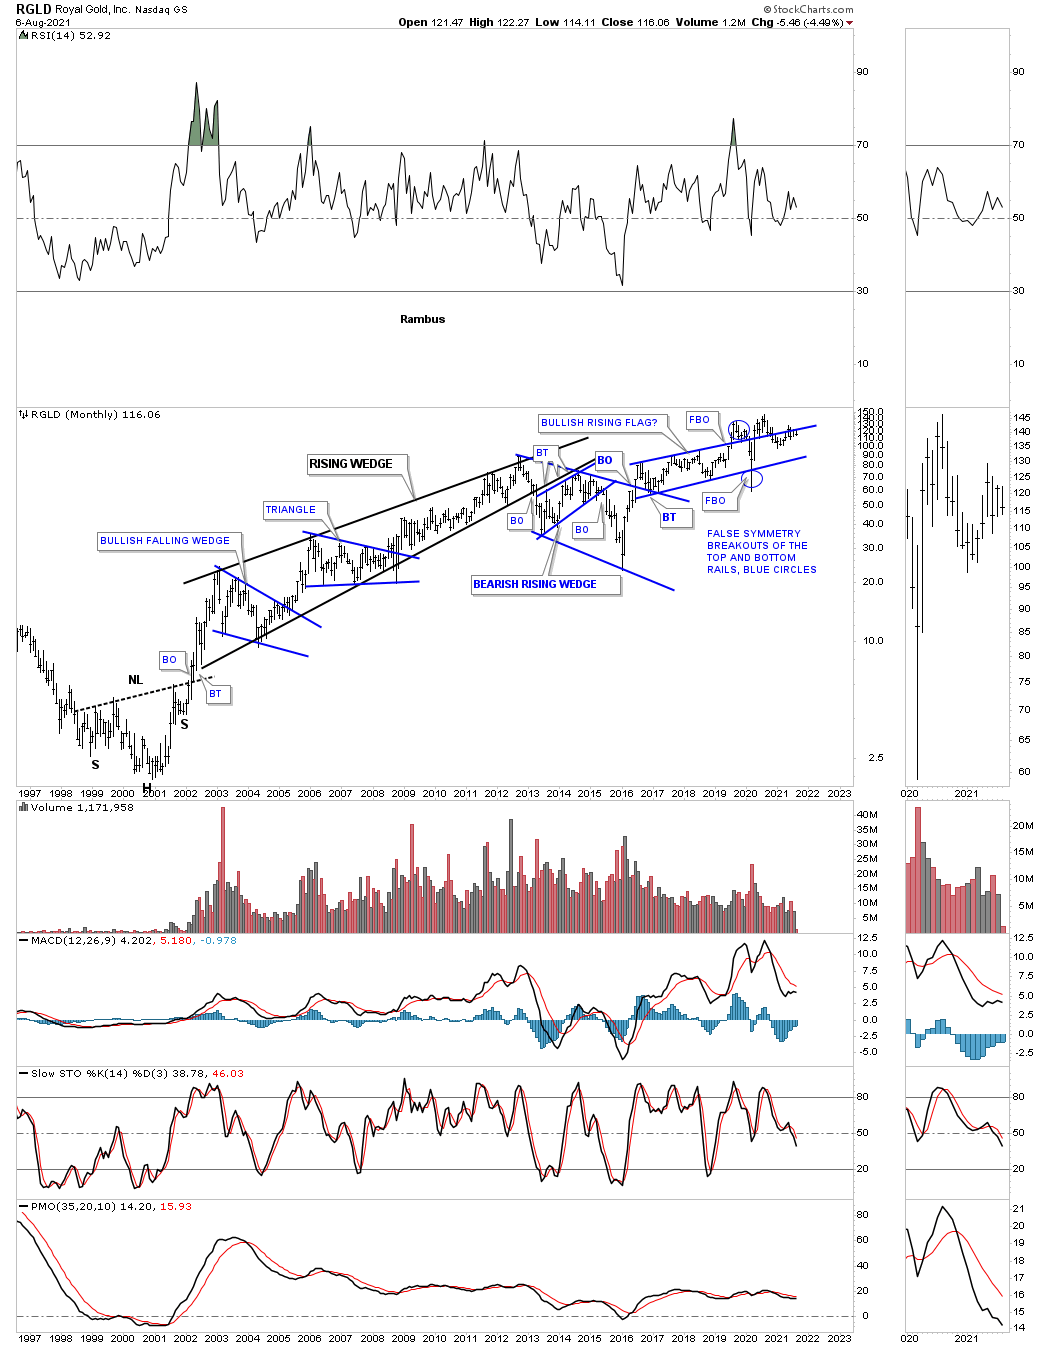
RGLD MONTHLY: Some ugly price action.
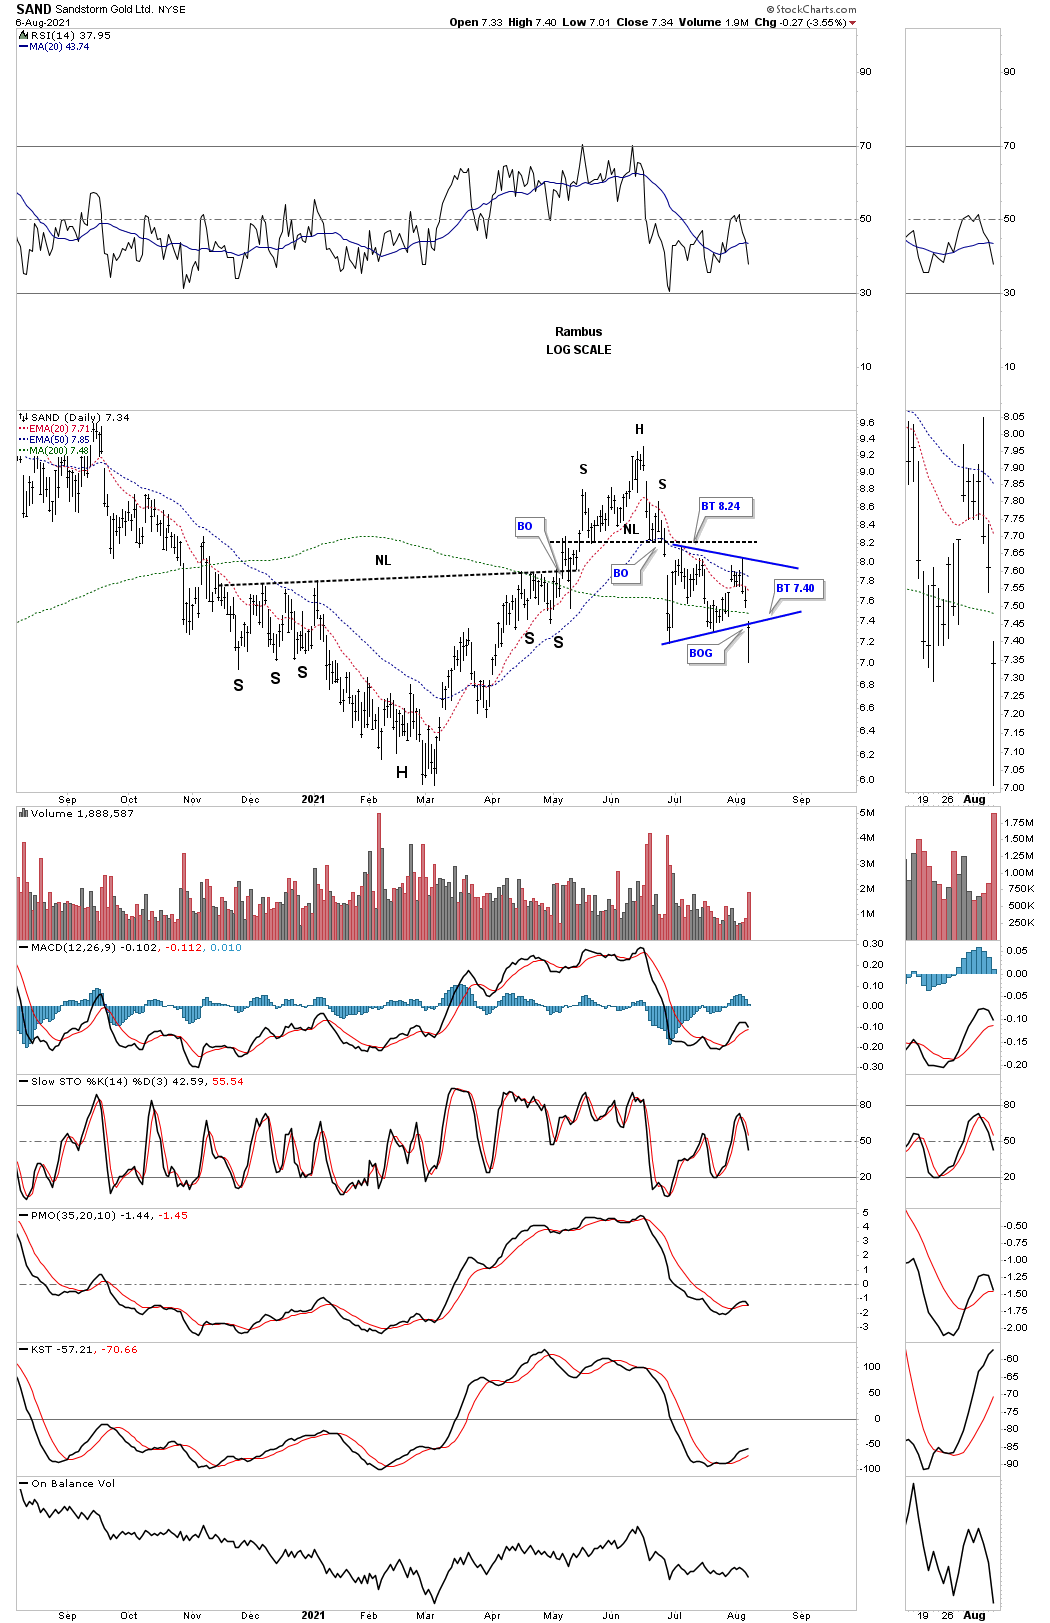
SAND DAILY: After breaking down from its H&S top SAND then formed the blue triangle consolidation pattern as the backtest. Last Friday the price action produced a breakout gap to the downside.
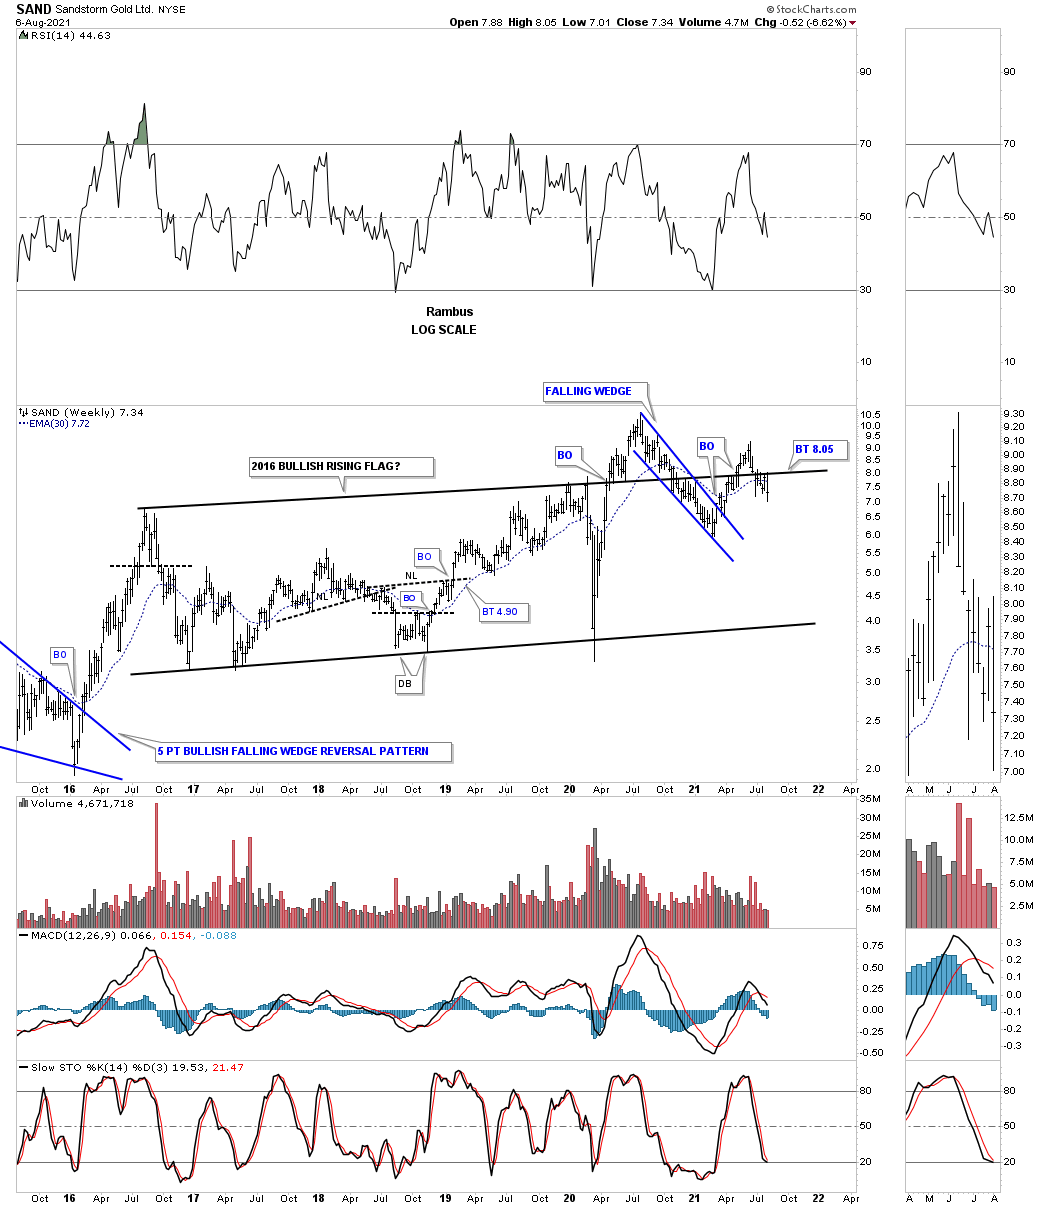
SAND WEEKLY: The top rail of the 2016 rising wedge formation is failing to hold support. That can be negated if the price action can trade back above the top rail.
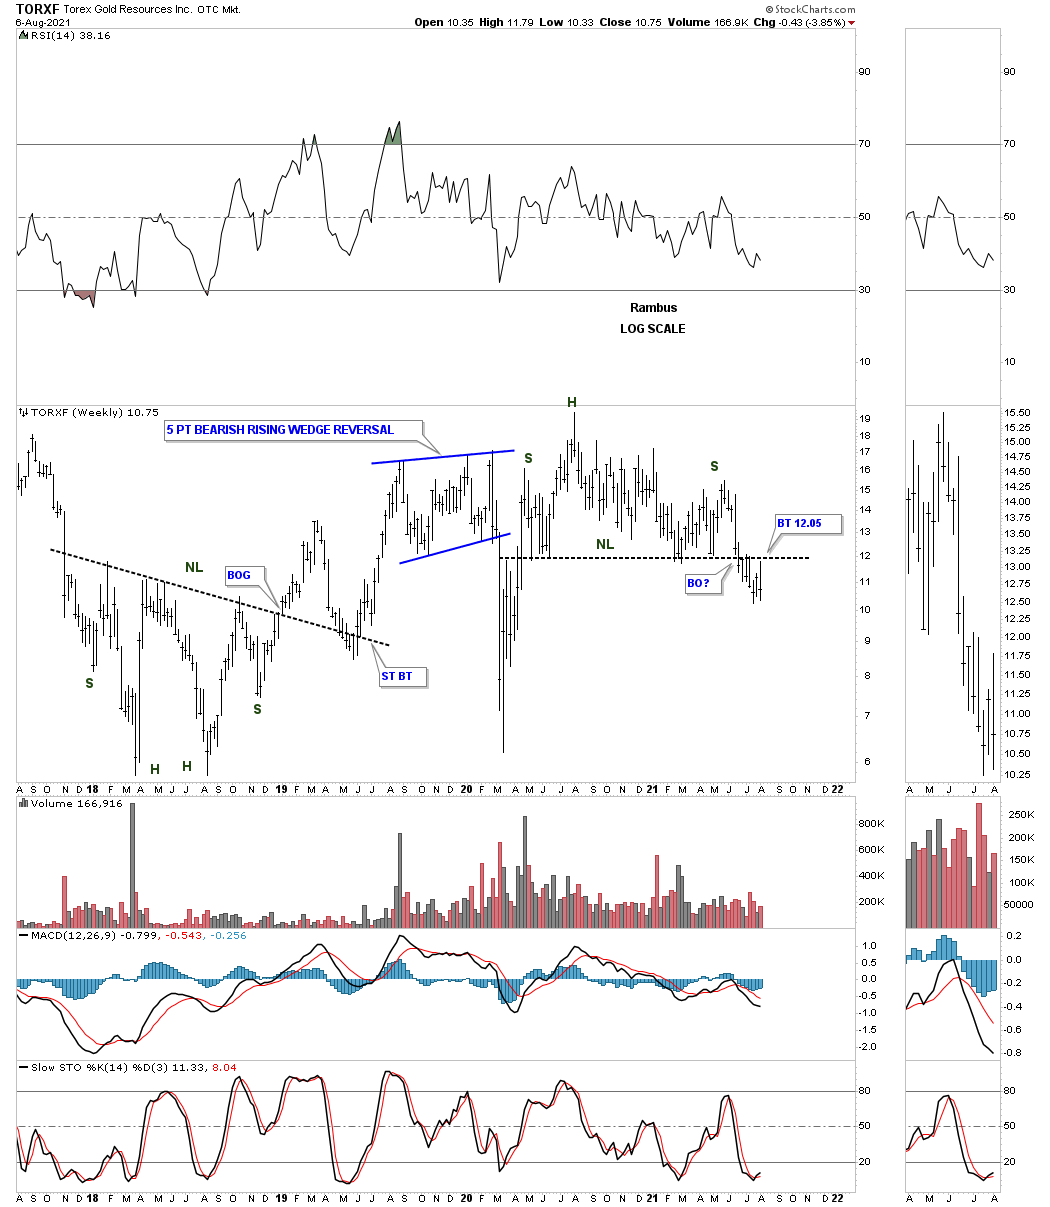
TORXF MONTHLY: H&S top with the breakout and backtesting process underway.
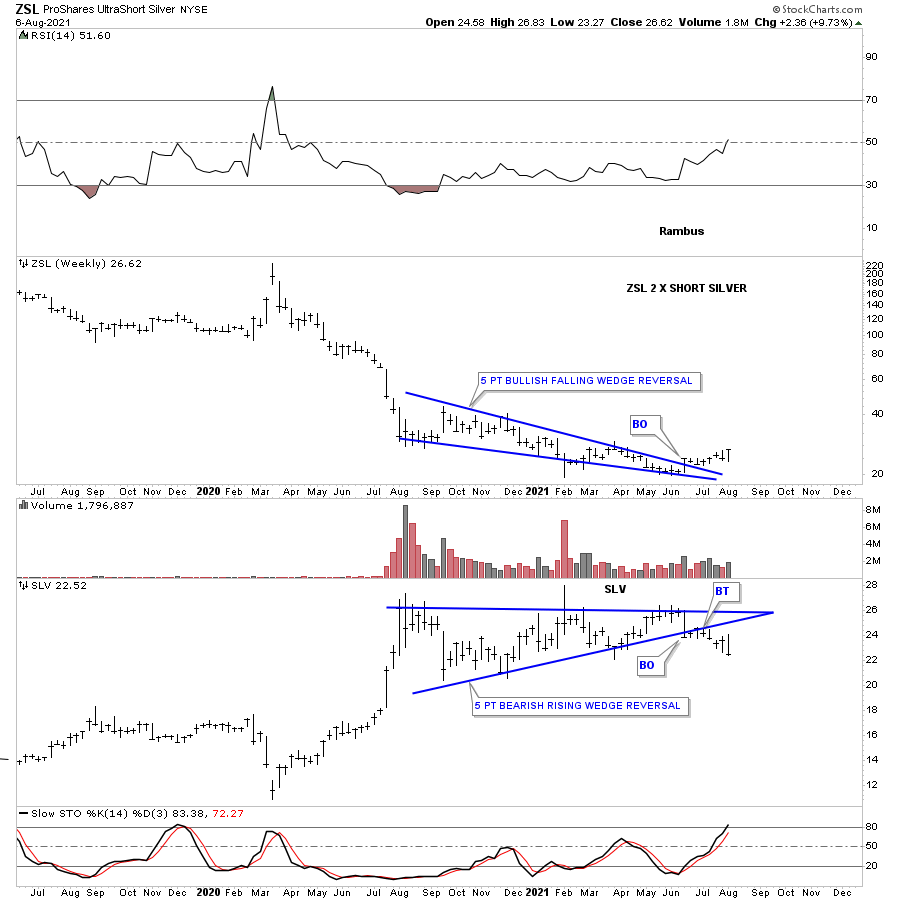
ZSL WEEKLY LINE: These last 2 charts are for ZSL, one a line chart and the other a bar chart. Just like most stocks in the PM complex the bottom in ZSL and the top in SLV took place a year ago in August. Since then the chopping action has produced a 5 point bullish falling wedge reversal on ZSL and a 5 point bearish rising wedge reversal pattern SLV.
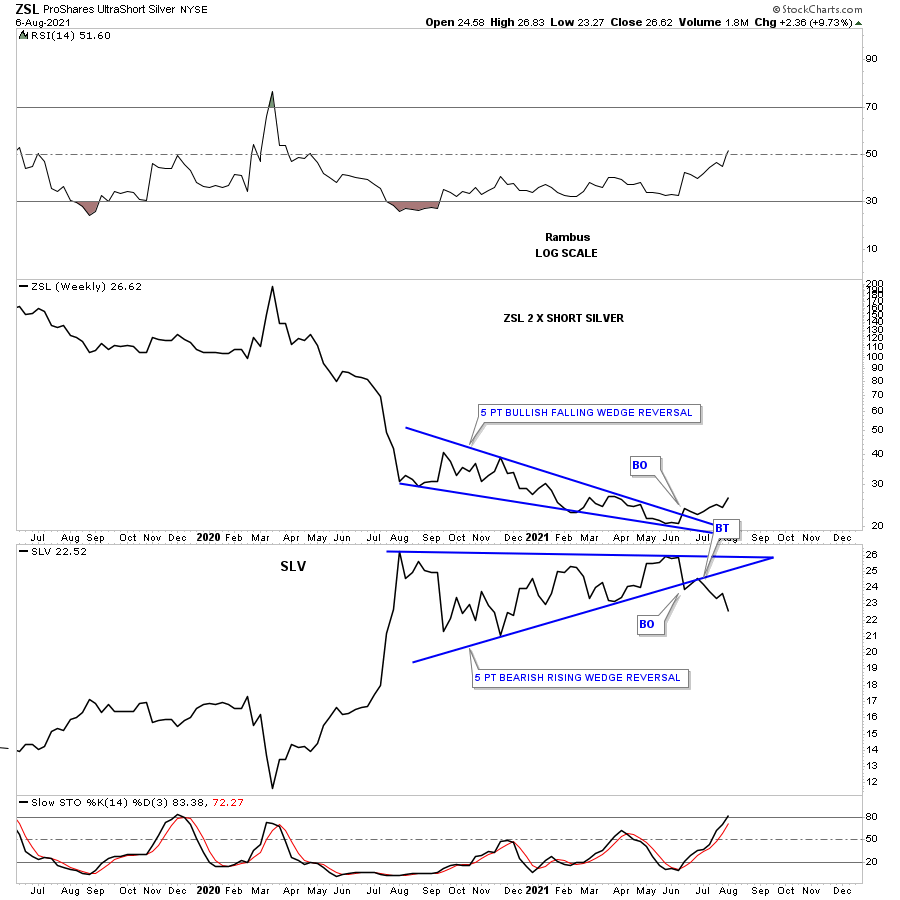
ZSL WEEKLY BAR: You can see how the weekly line chart above takes out much of the noise a bar chart can make. If you connect the reversal points on the bar chart below, you will see some of the spikes above and below the trendlines which can make things a bit confusing for some folks.
For one year now the PM complex has been trending lower with no end in sight yet. That may change tomorrow but as of the closing last Friday the bears are still in control. There is an old saying when it comes to the stock markets which goes something like this, there is always a bull market somewhere if you know where to look. While the PM complex is still under pressure there is a confirmed bull market taking place in the US stock markets which gives us another sandbox to play in while we wait for the PM complex to show us some bullish price action which it hasn’t done for close to a year now. All bull and bear markets will end at some point but the big question is, WHEN? All the best…Rambus