Last week marked one of the most important weeks in the PM complex in a very long time. After 15 months of consolidating the last impulse move up, that began at the August 2020 high, we are now seeing a very symmetrical H&S bottom forming at the last reversal point in the August 2020 consolidation patterns which is classic Chartology.
I realize you are probably getting tried of me saying this, but the bigger the consolidation pattern the bigger the move. The other aspect of a big consolidation pattern is that there is generally some type of recognizable smaller reversal pattern that forms at the reversal points which is one reason I’ve been so focused on the daily PM combo charts which have been showing a very well defined H&S bottom forming.
H&S patterns can form as a top, bottom or as a consolidation pattern. Whenever you see a H&S pattern, especially after a strong impulse move or after a trading range has been forming for an extended period of time, it has to be put into context within the bigger picture. First and foremost these are reversal pattern and one of the most common reversal patterns there is with the double top or bottom next, so where they form is critical to understand.
In last weeks, Weekend Report, we looked at 20 individual PM stocks that are exhibiting all the characteristics mentioned in the paragraphs above. Because the PM complex is at such a crucial point right now of putting in a very important low, which could be a low not seen for many many years, to come I felt it’s important to show you in just a little more detail of how this very important low looks in real time, not weeks or months later but in real time.
The daily combo chart below shows what each stock from last weeks, Weekends Report, did 5 trading days later which ended on Friday. When looking at these charts keep in mind the PM stock indexes look very similar too many of the individual PM stock which is what you would expect to see especially in the small universe of the PM complex.
When scrolling down this list of PM stocks I put this weeks price action first and last weeks chart just below so you can compare what happened in the last 5 days of trading. Focus on the 2020 trading range and where the current H&S bottoms are forming. You will see many more H&S bottoms had breakouts this past week compared to last week. You will even see some breakouts from the August 2020 trading ranges which are a leading indicator that the rest of the PM complex will have their turn when they are ready to advance.
Again, focus on the last five days of trading compared to last week’s, Weekend Report charts, to see all of the breakouts that are underway this past week. In part three I will show you 25 more PM stocks that are also in the process of completing their own H&S bottoms that are forming at the 4th reversal point in their 2020 consolidation pattern which is also forming the backtest to the top rail of the much bigger 2016 consolidation pattern. All the best…Rambus
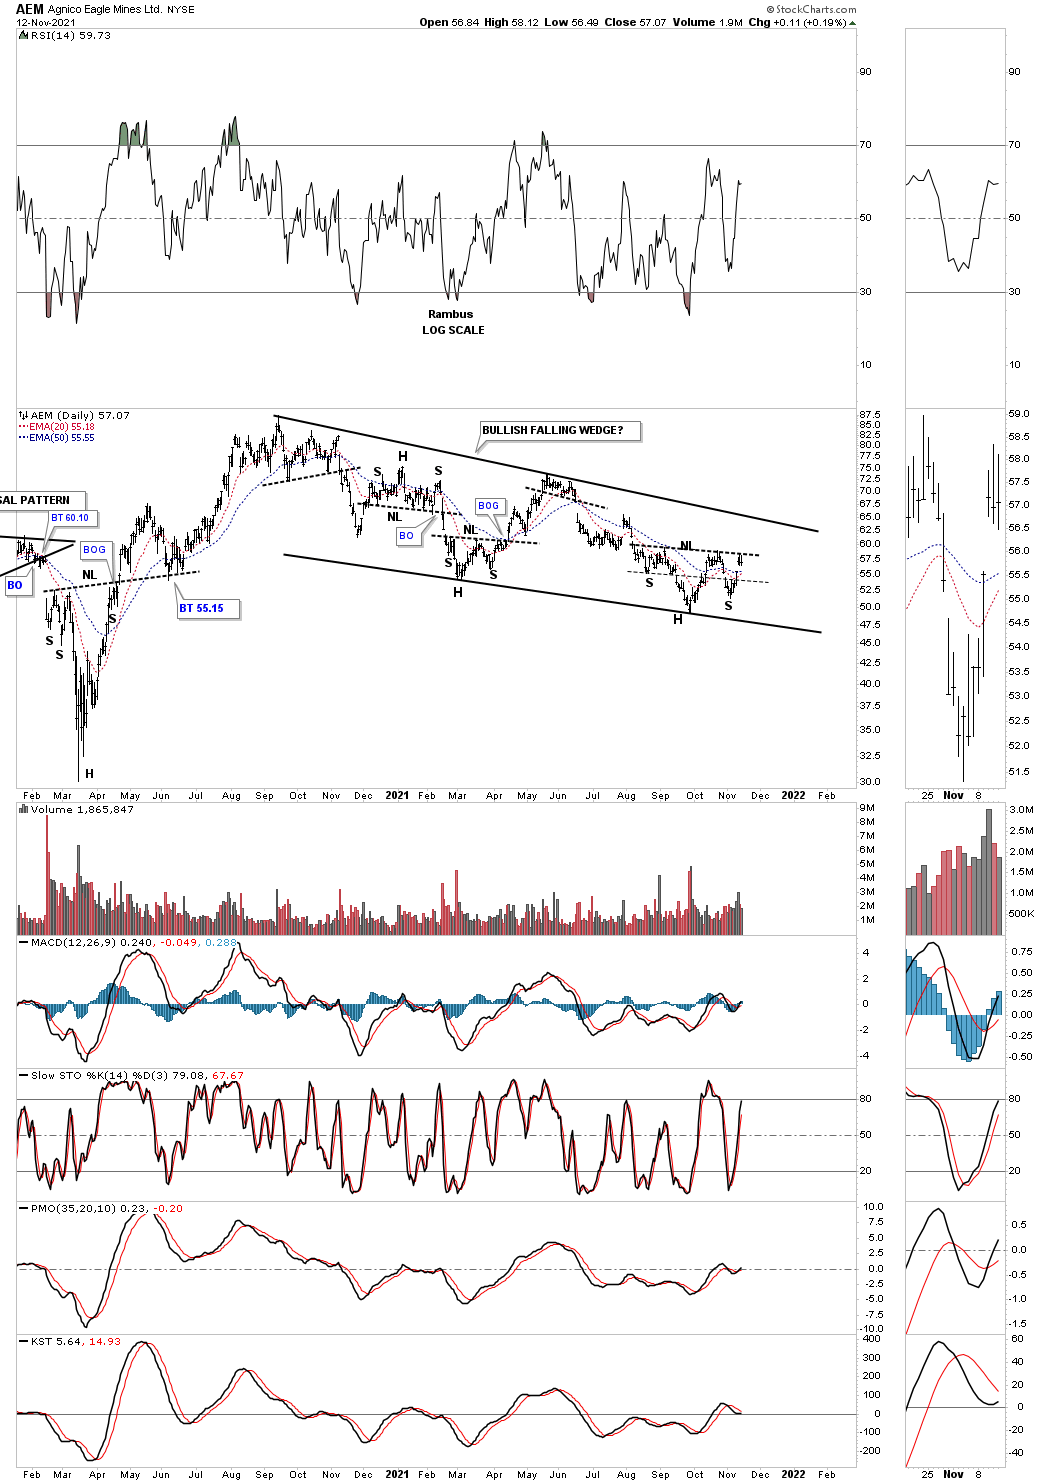
AEM THIS WEEK:
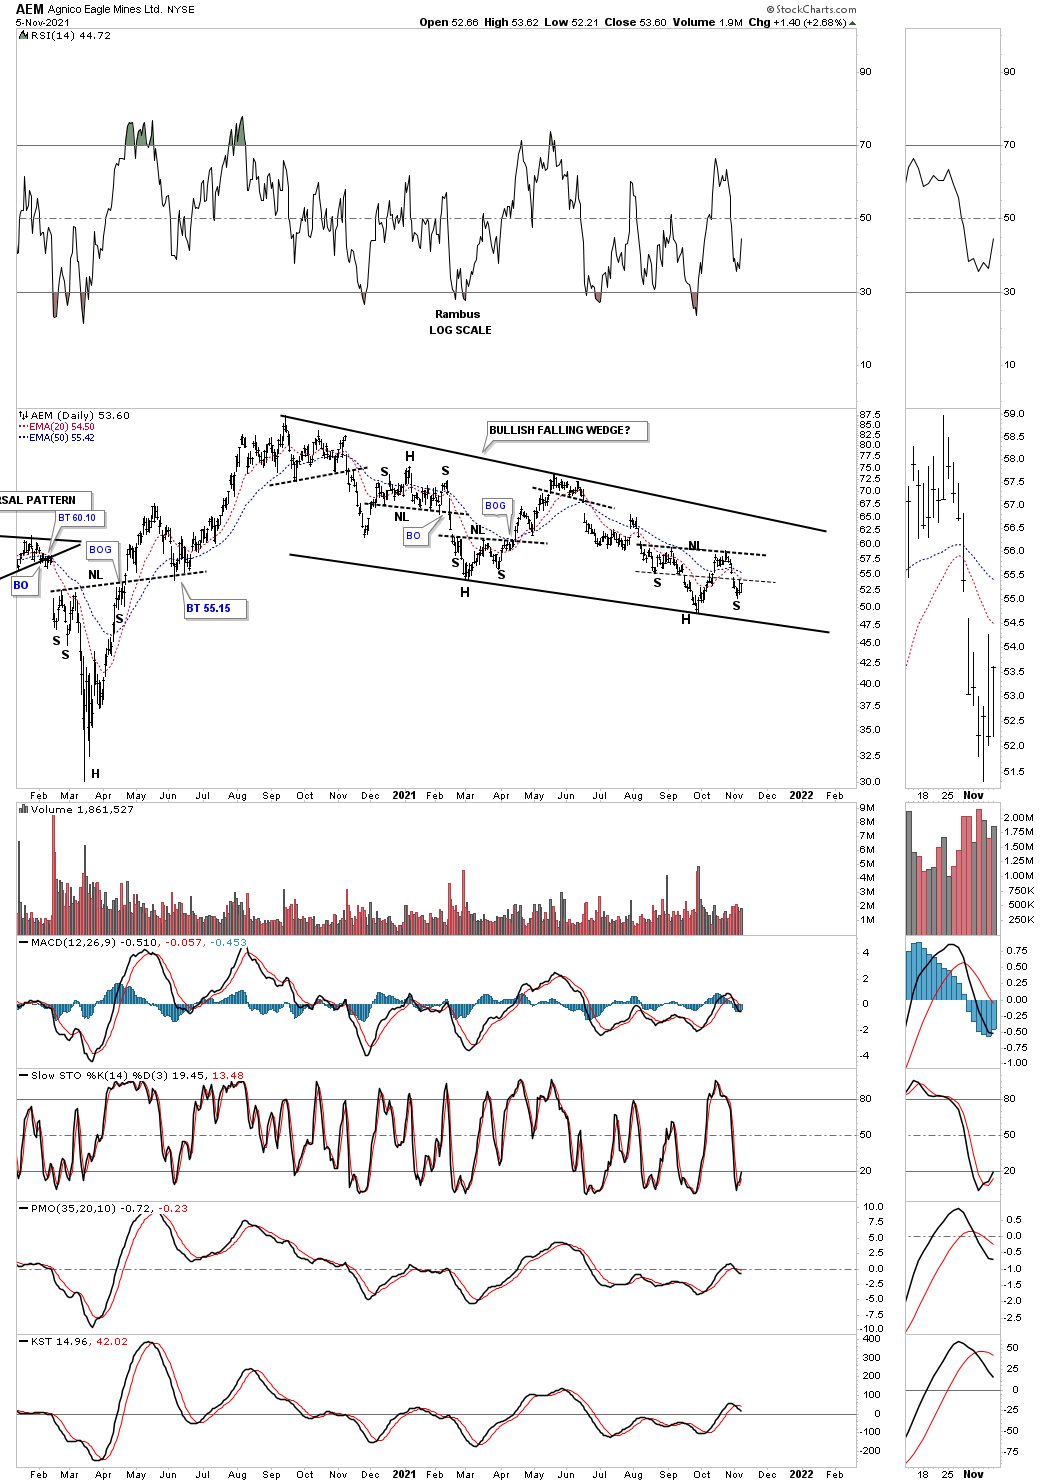
LAST WEEK:
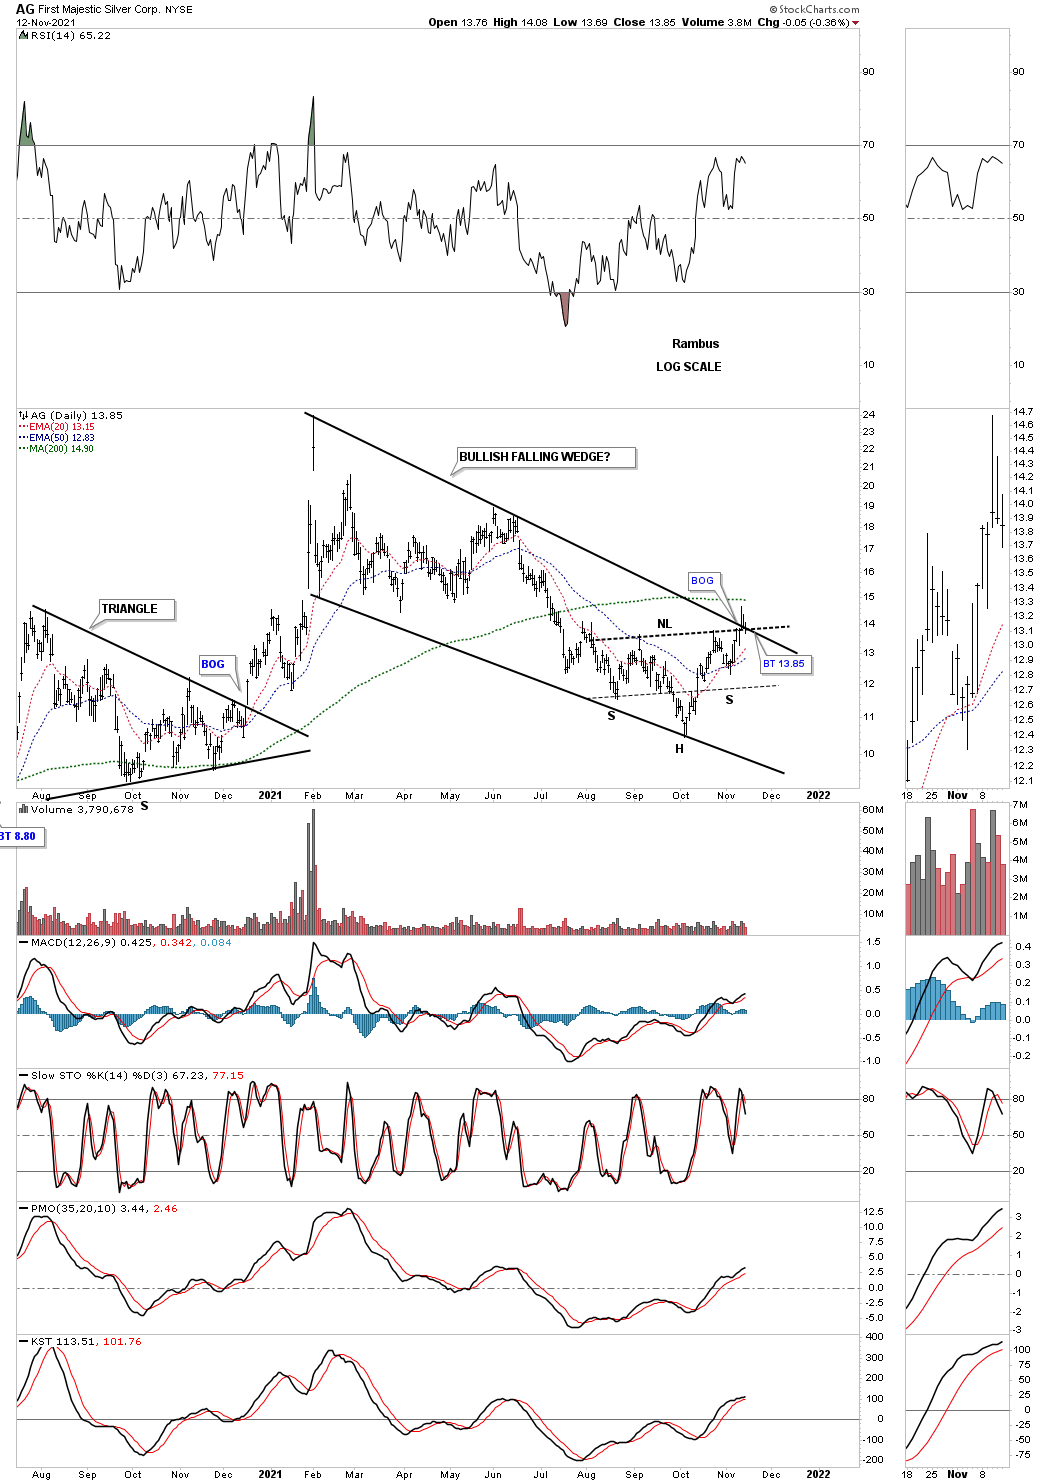
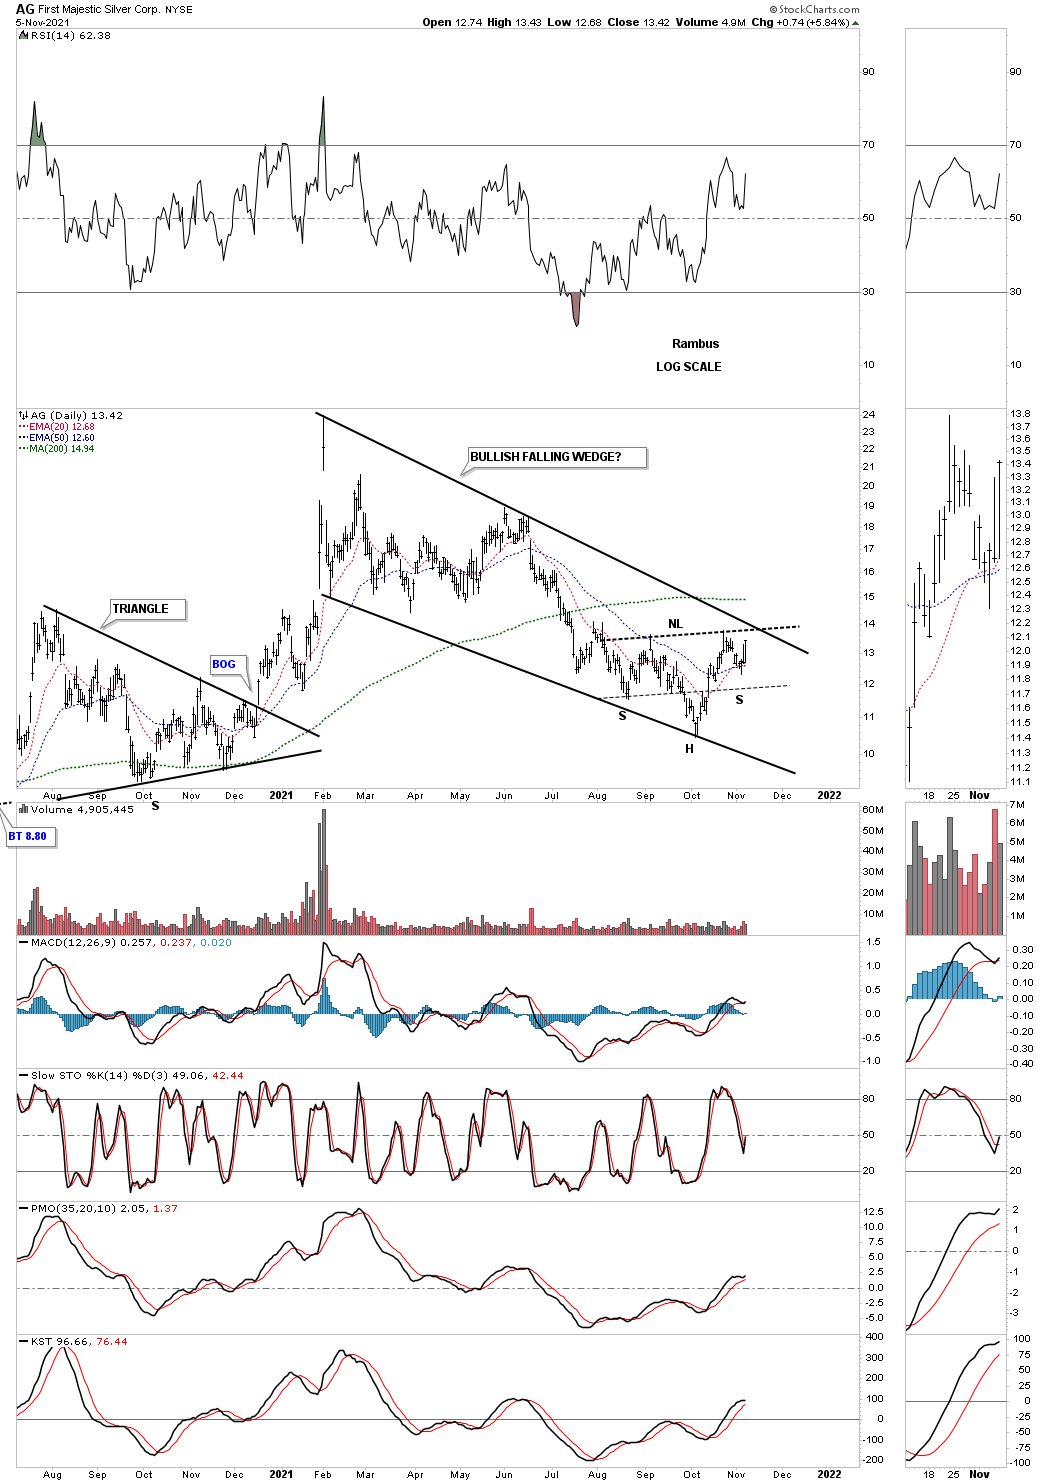
AG THIS WEEK:
LAST WEEK:
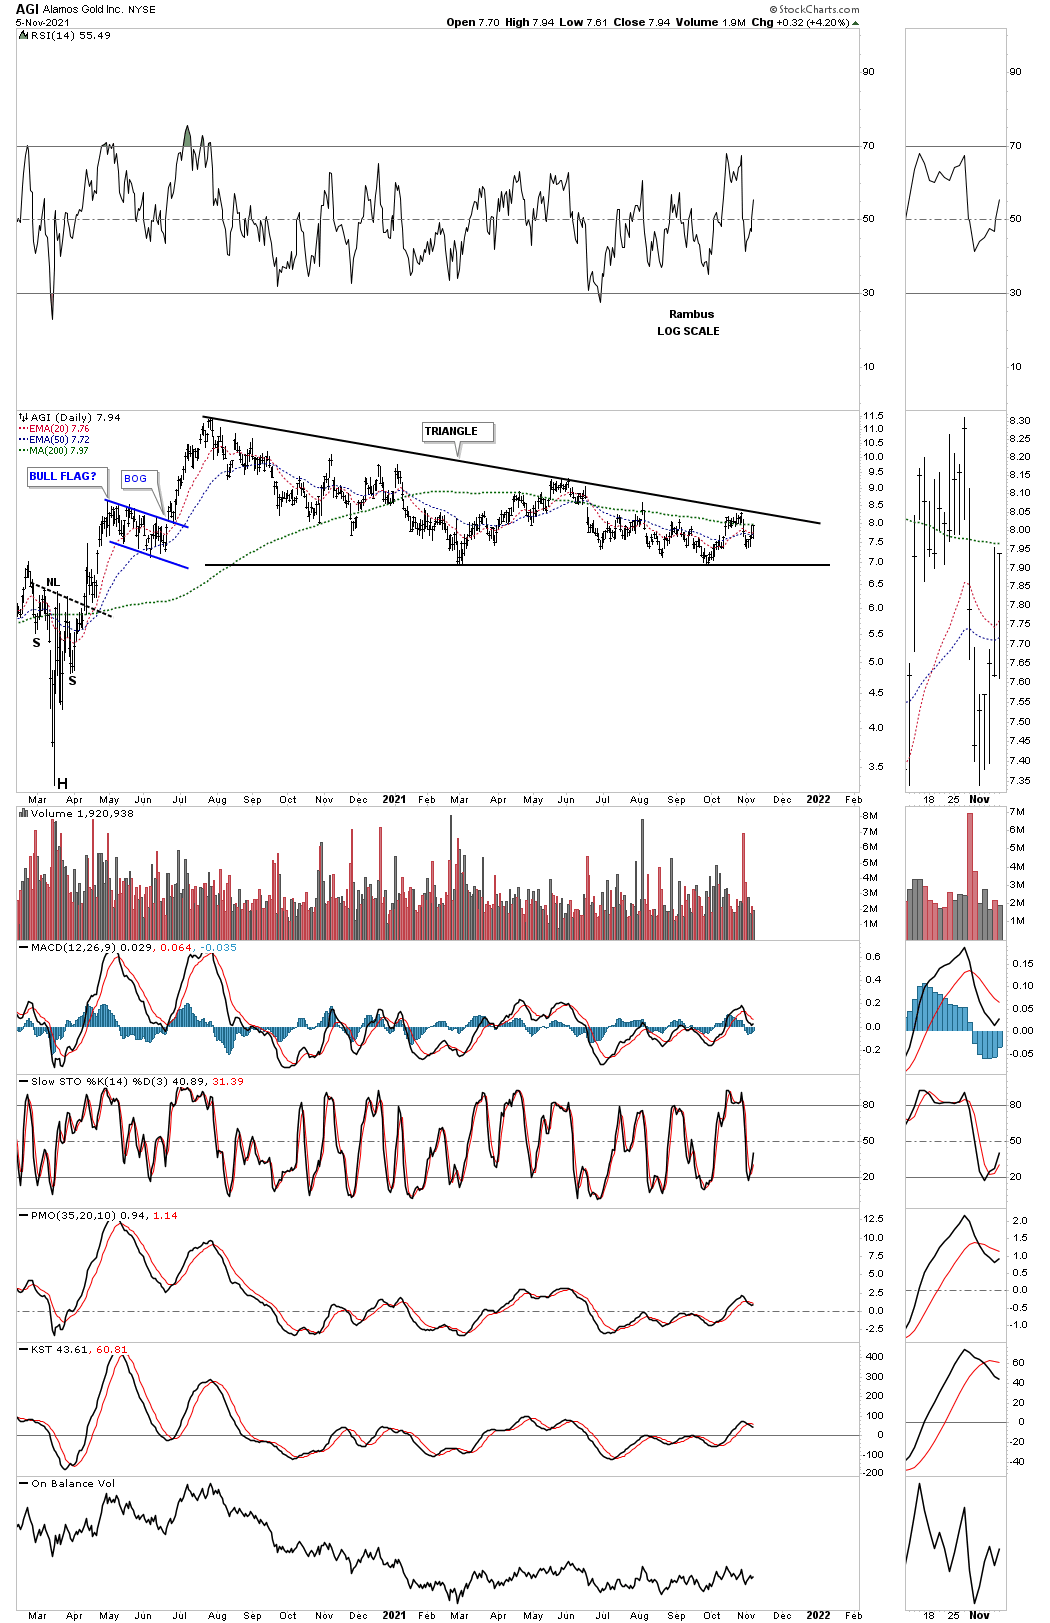
AGI THIS WEEK:
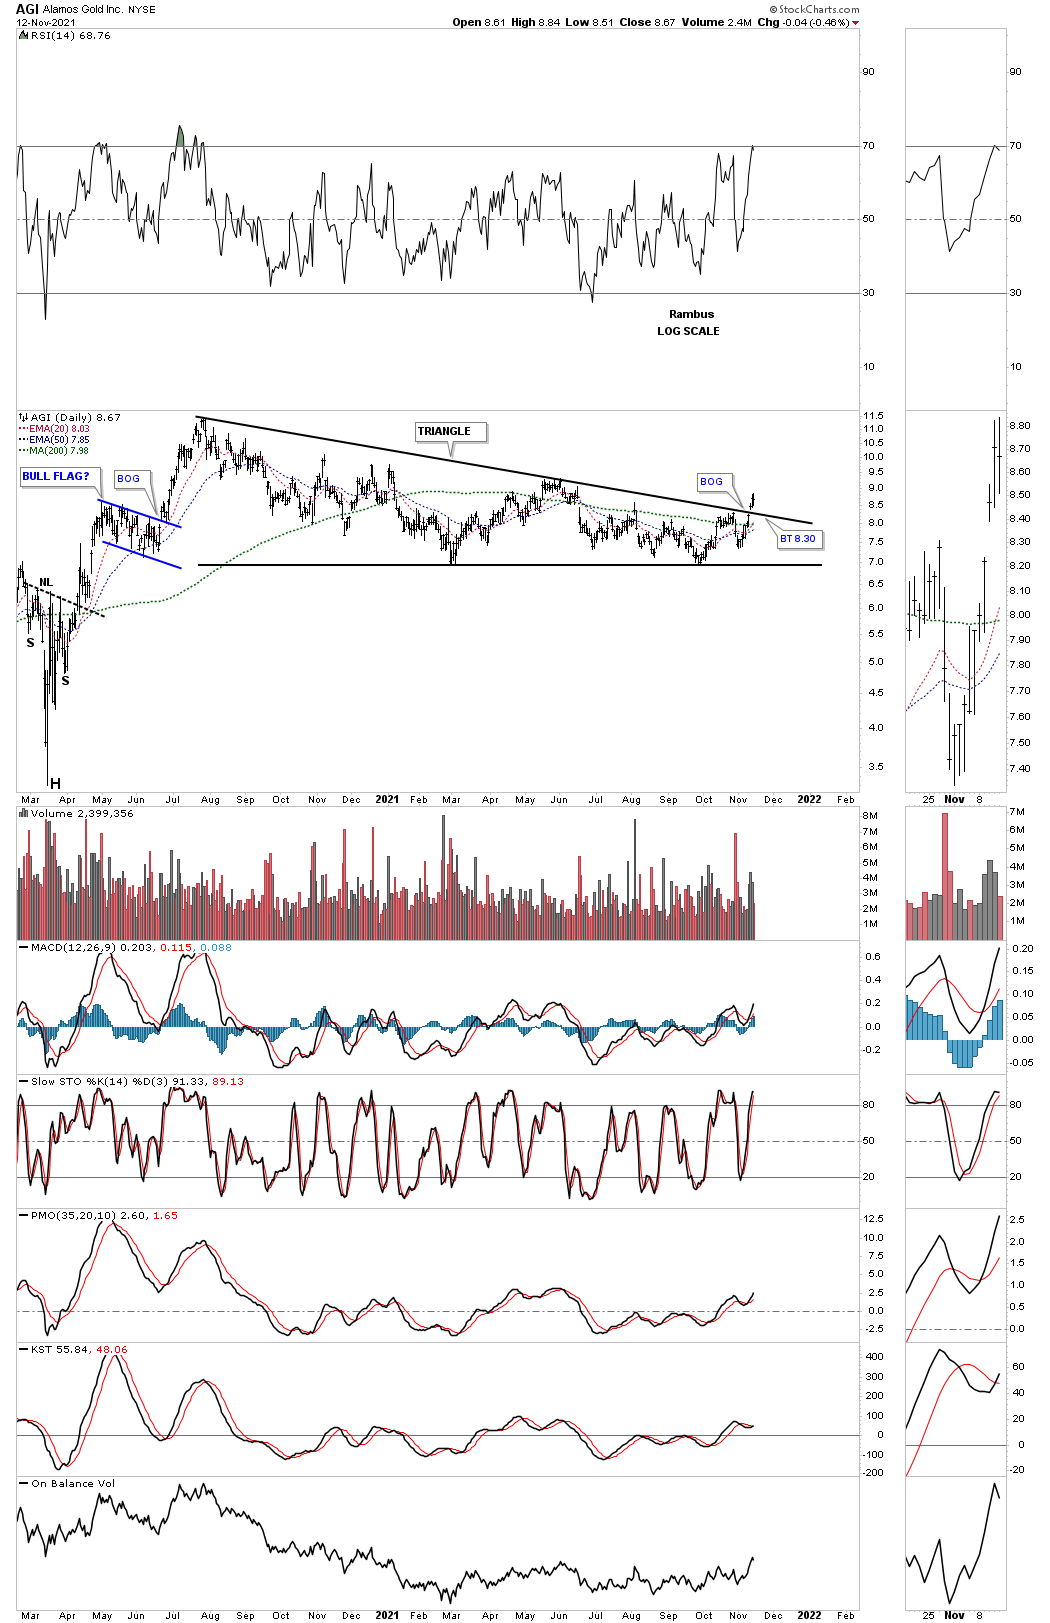
AGI LAST WEEK:
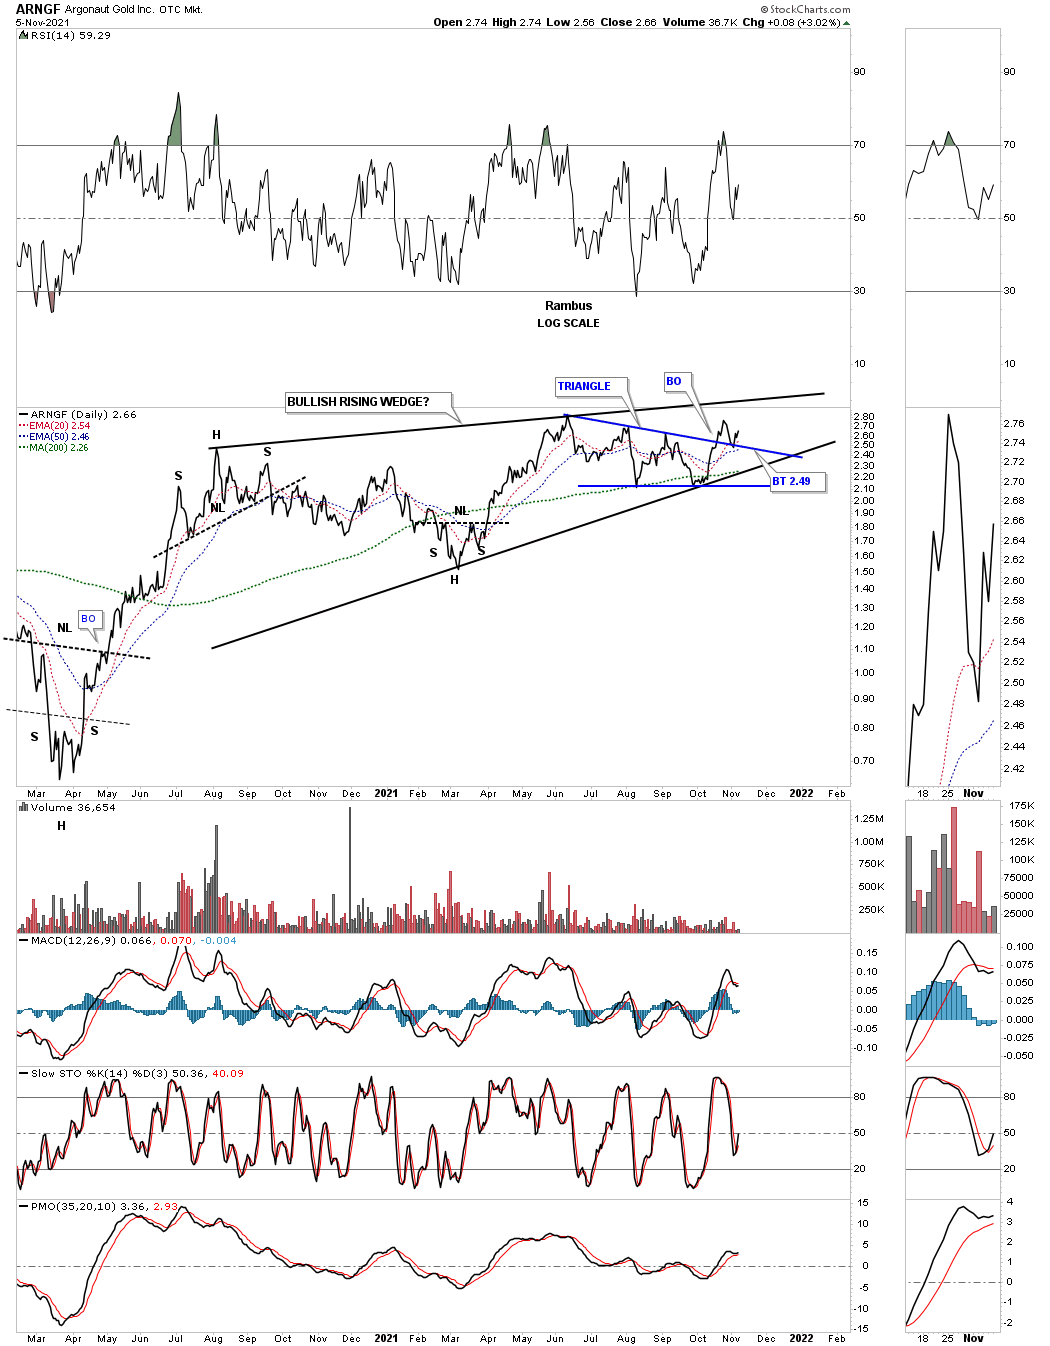
ARNGF THIS WEEK:
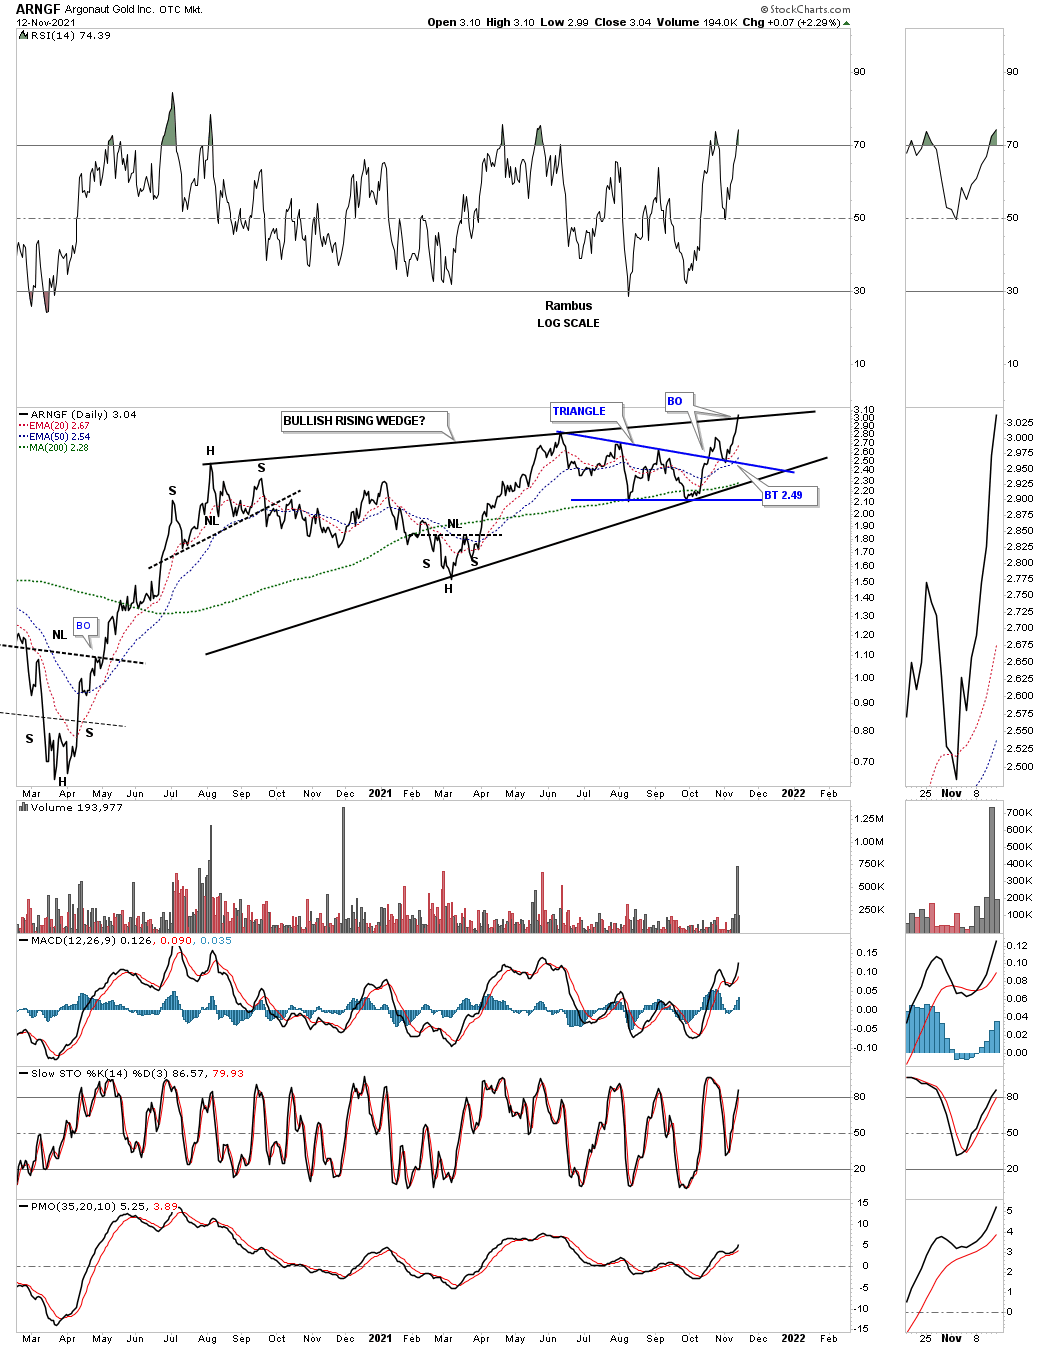
LAST WEEK:
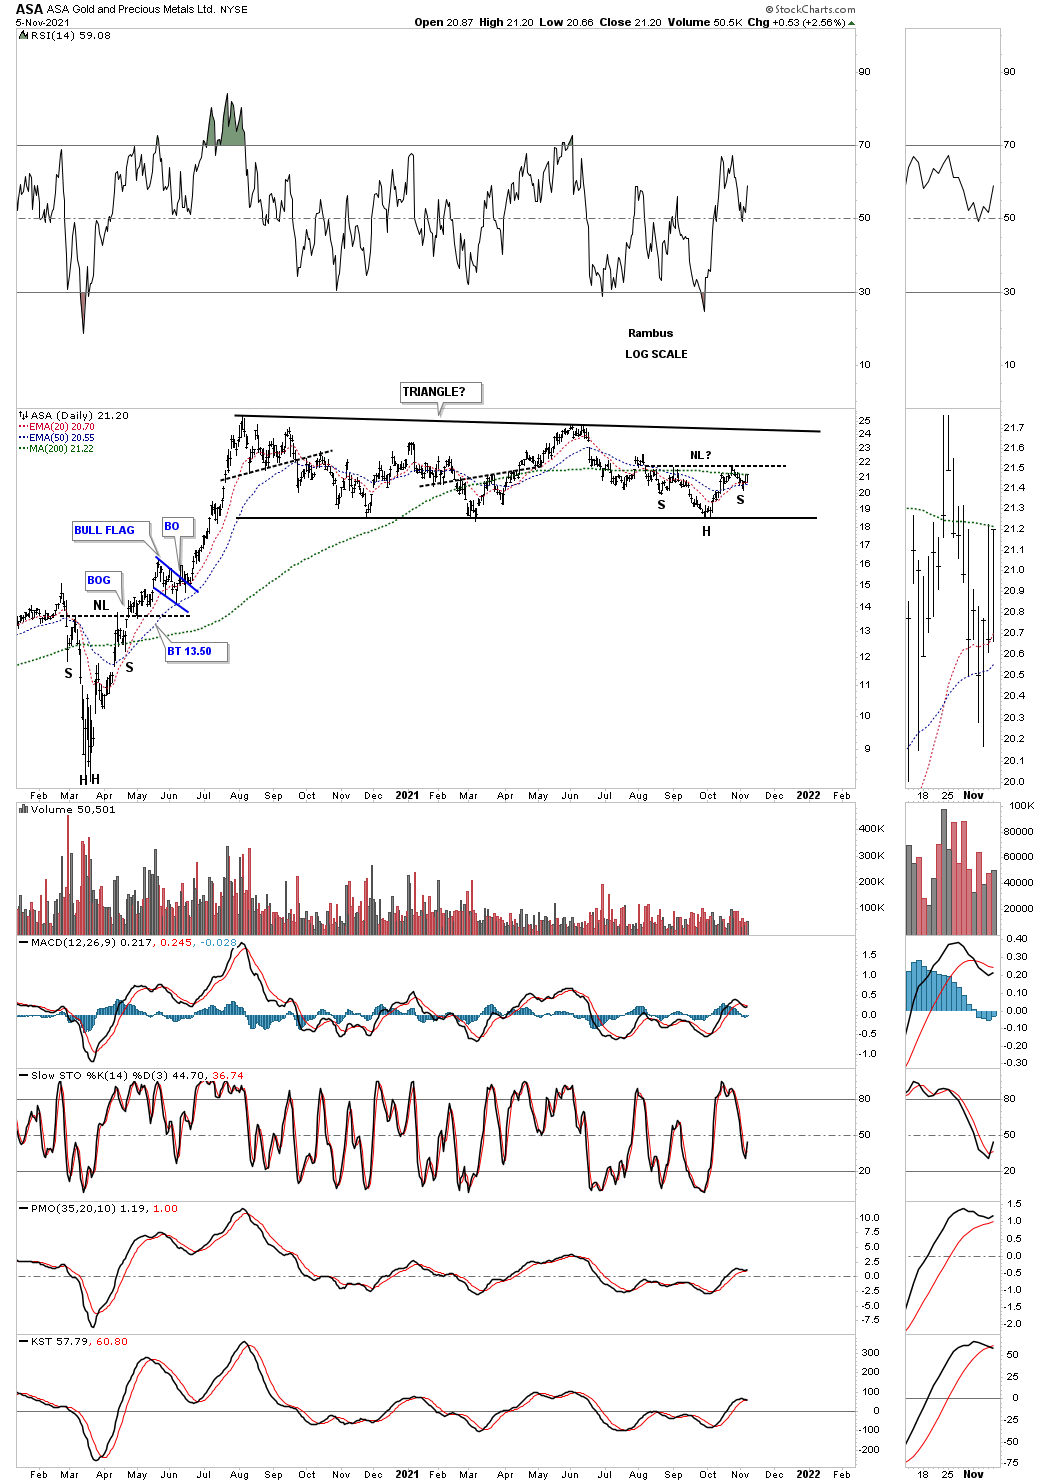
ASA THIS WEEK:
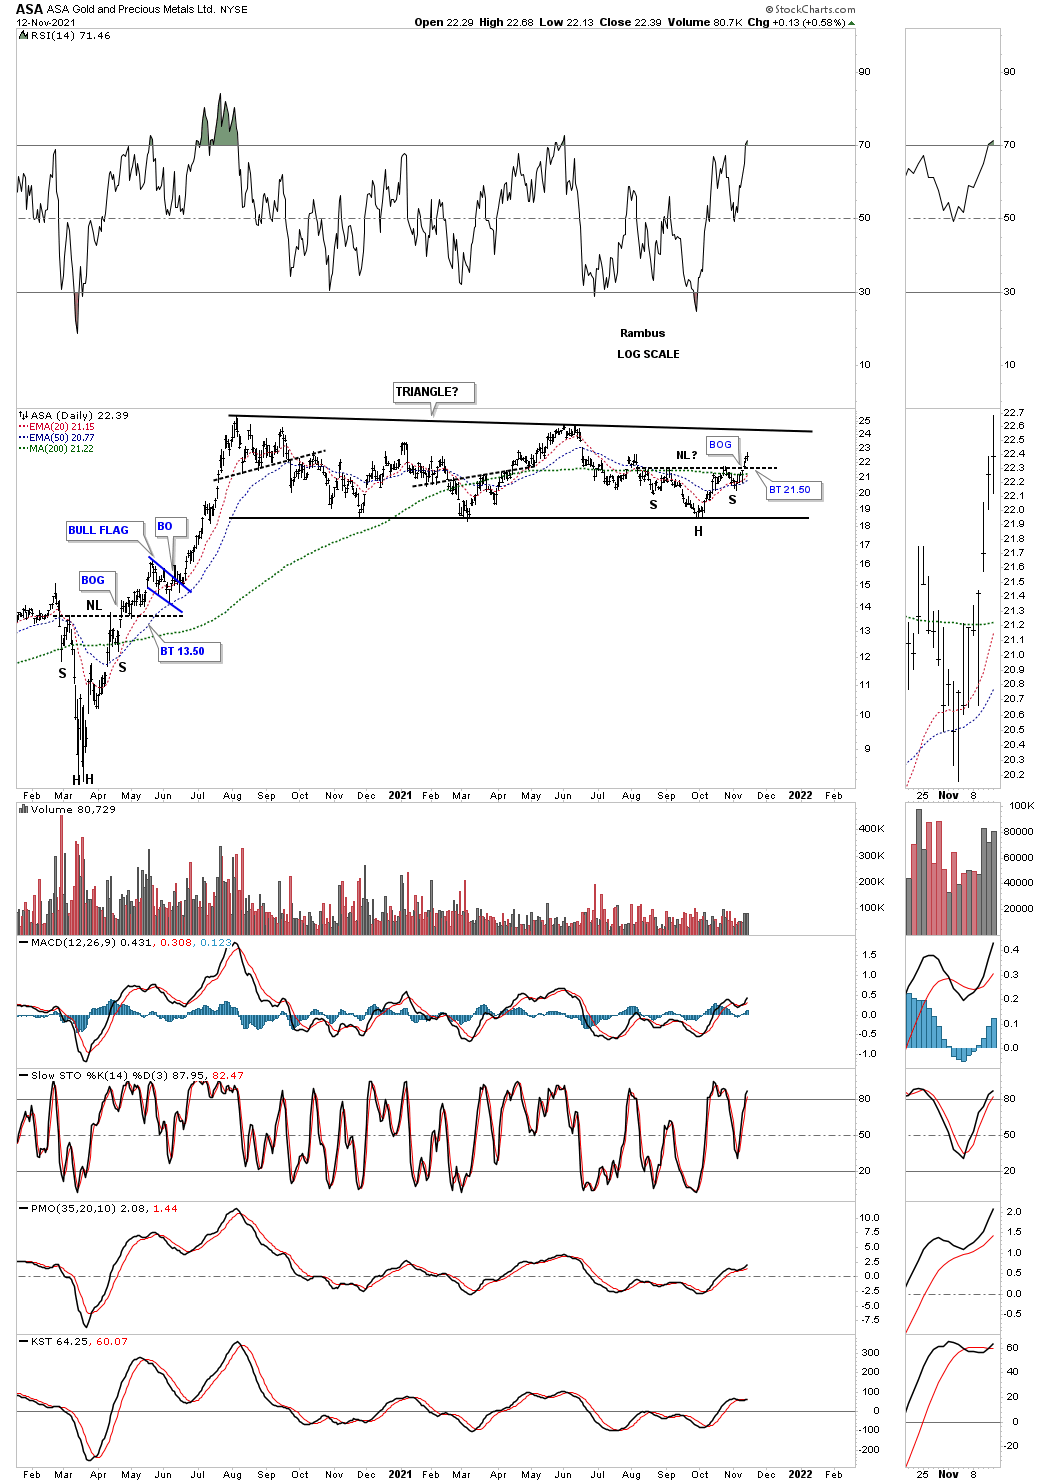
LAST WEEK:
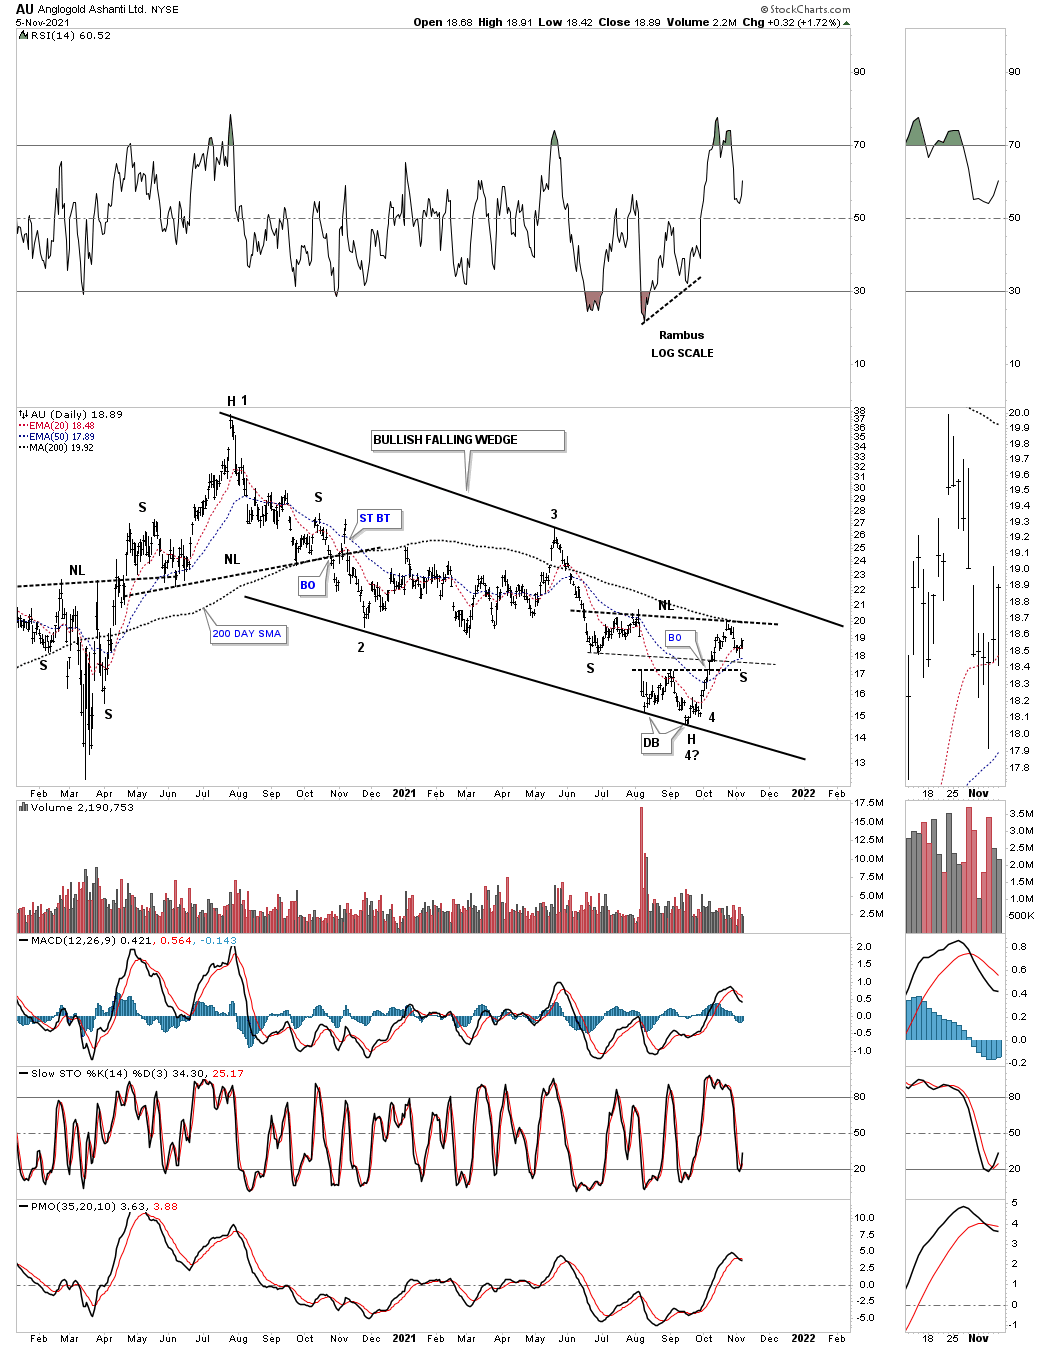
AU THIS WEEK:
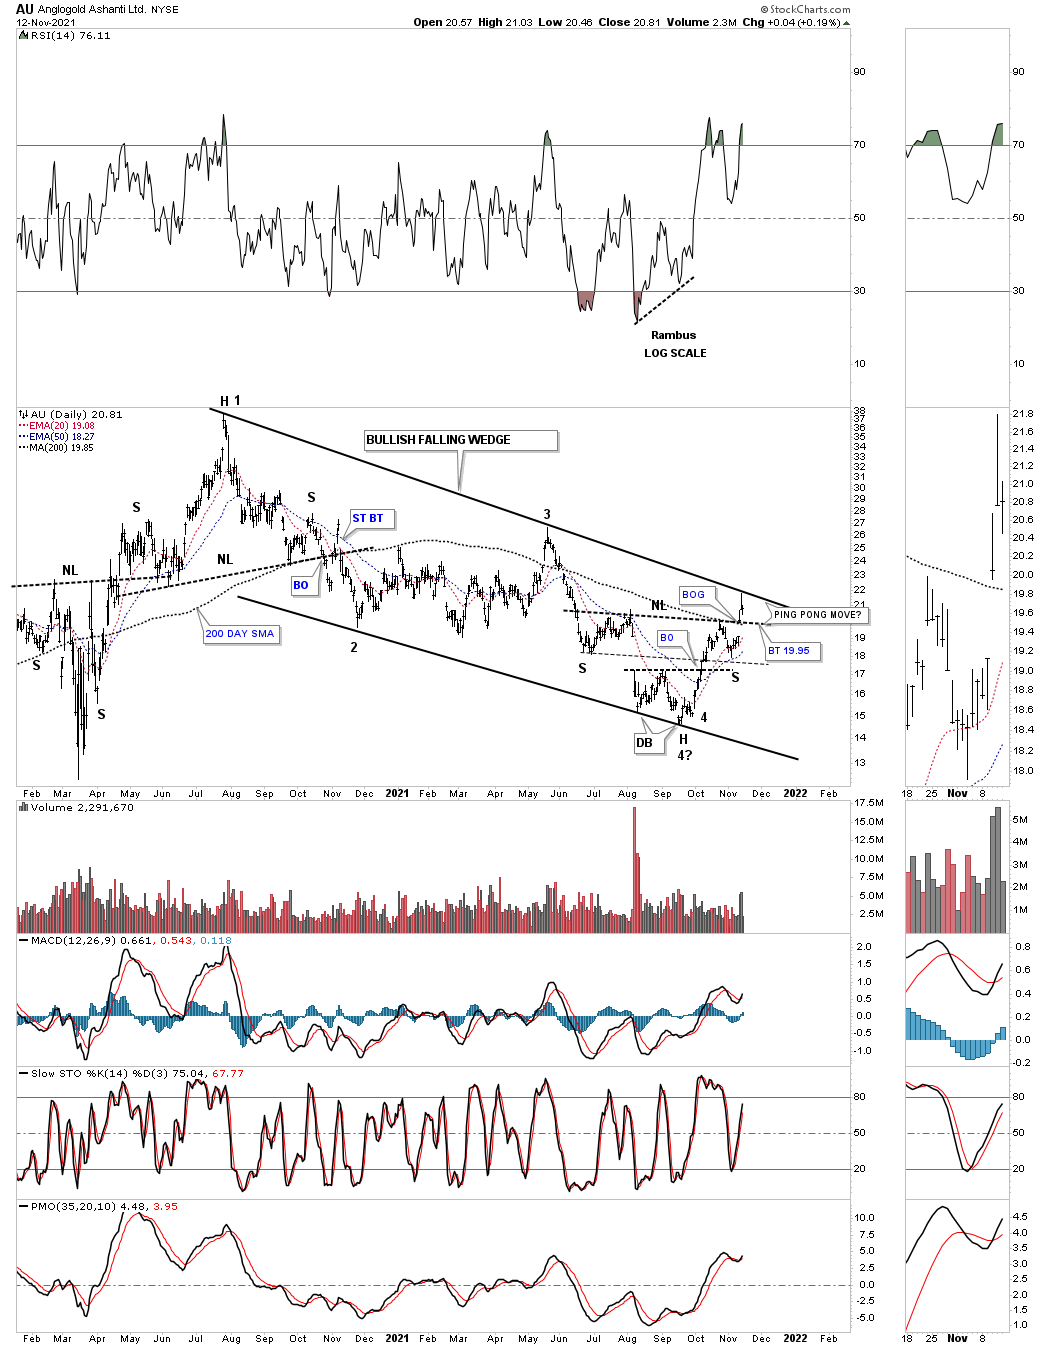
LAST WEEK:
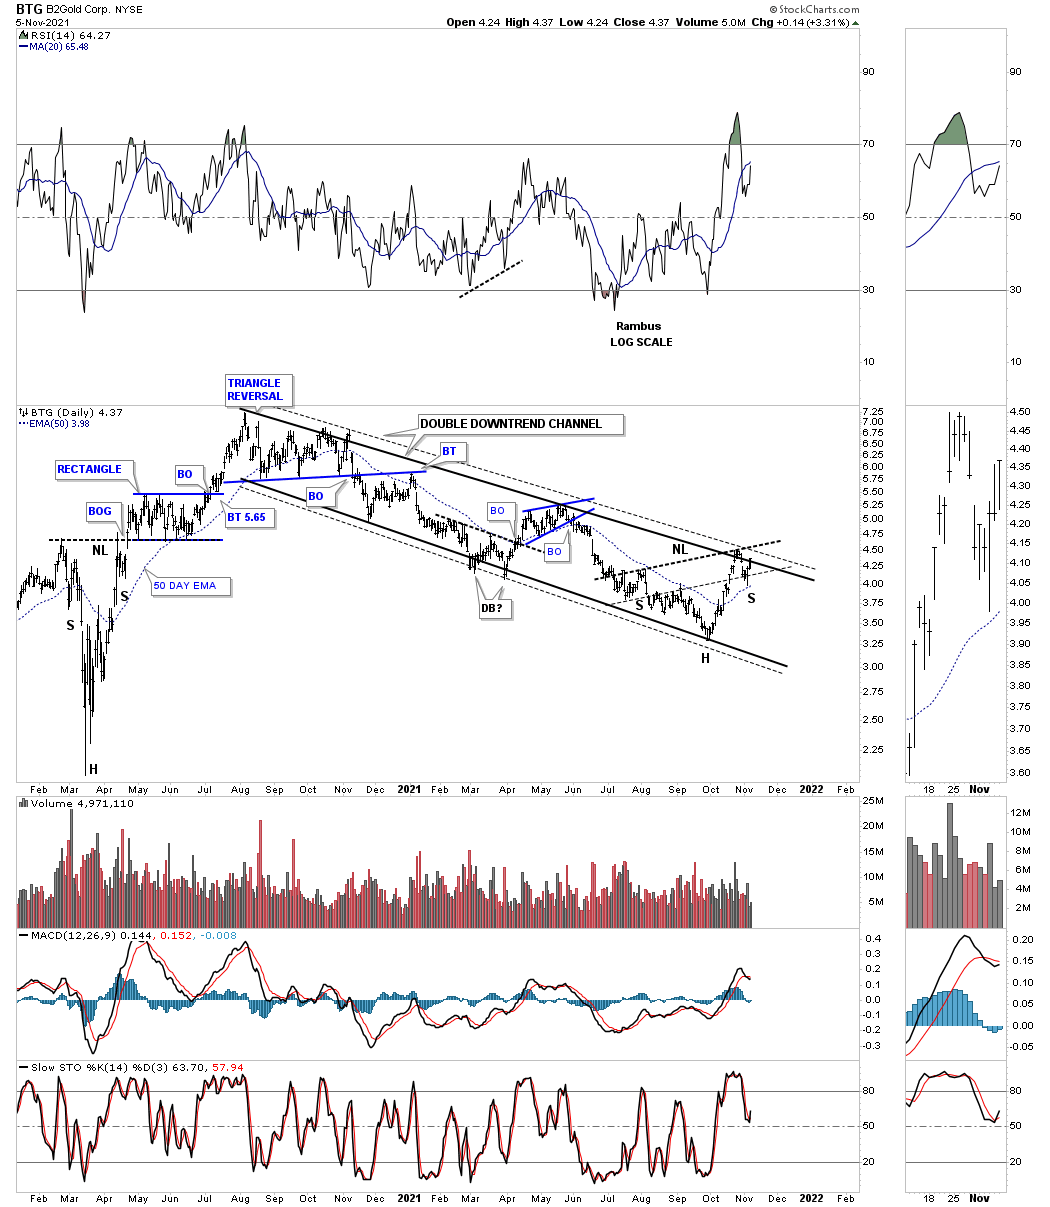
BTG THIS WEEK:
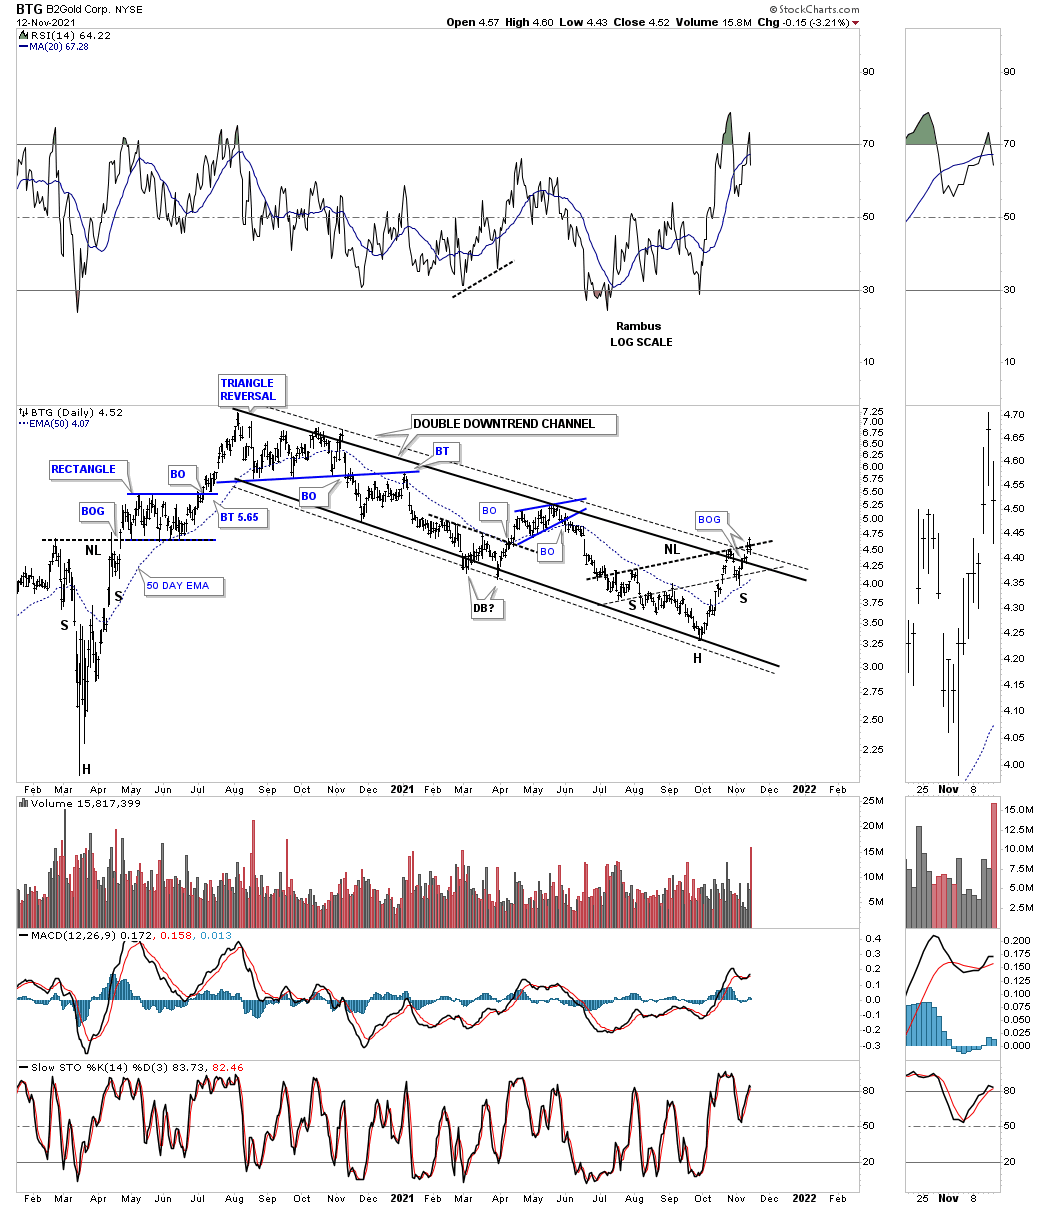
LAST WEEK:
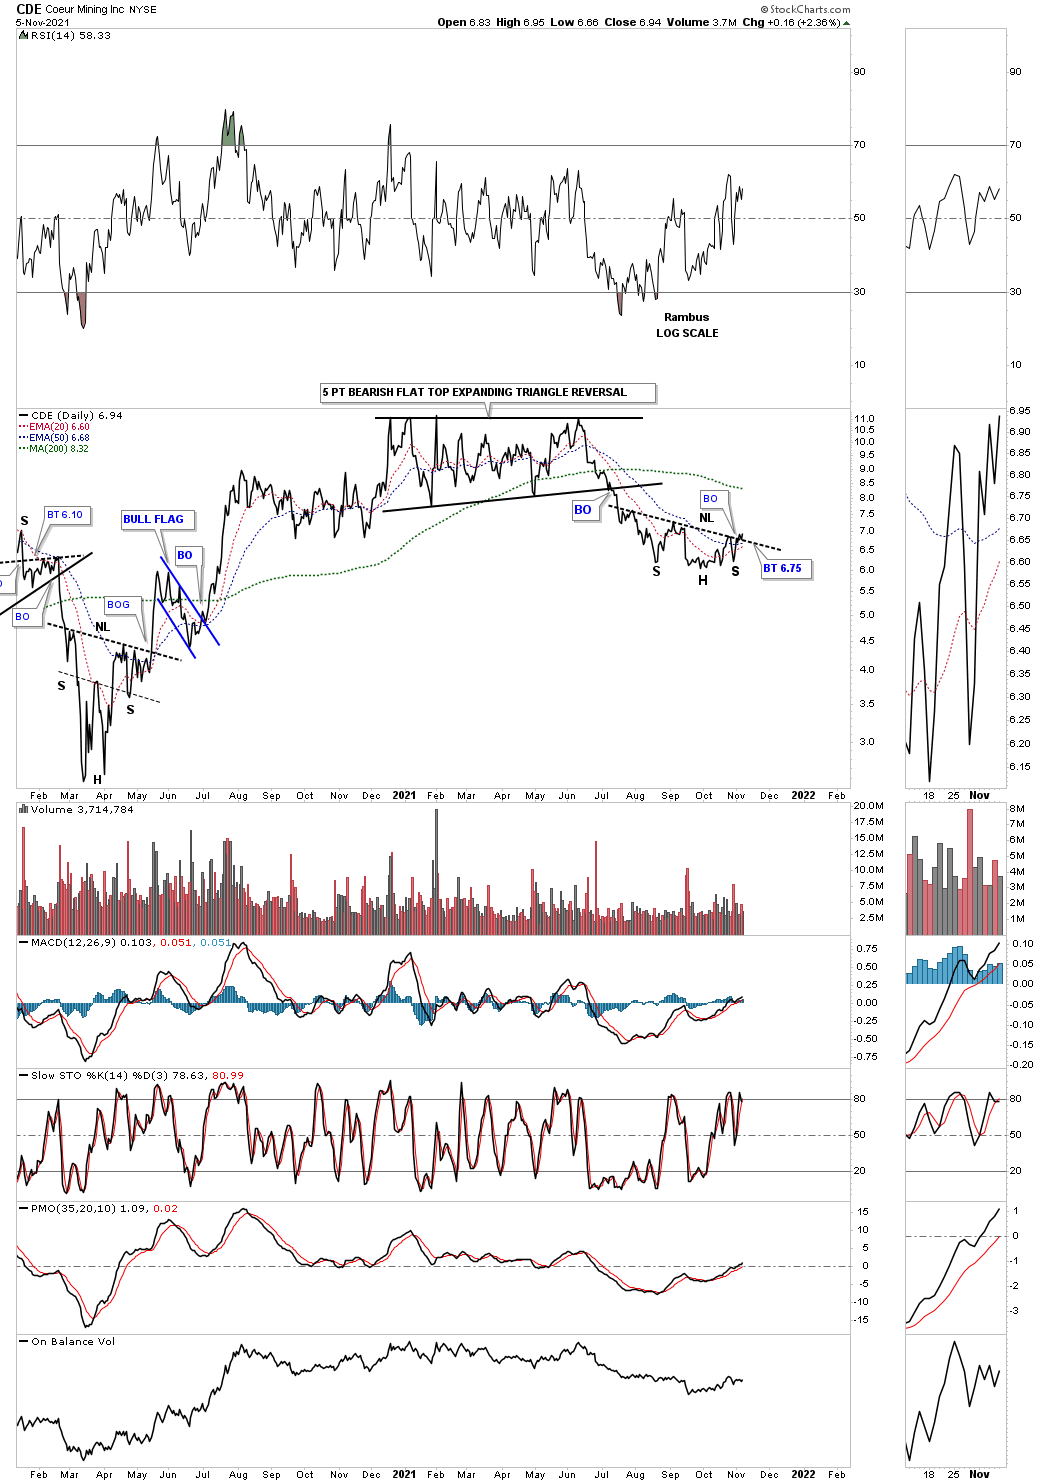
CDE THIS WEEK:
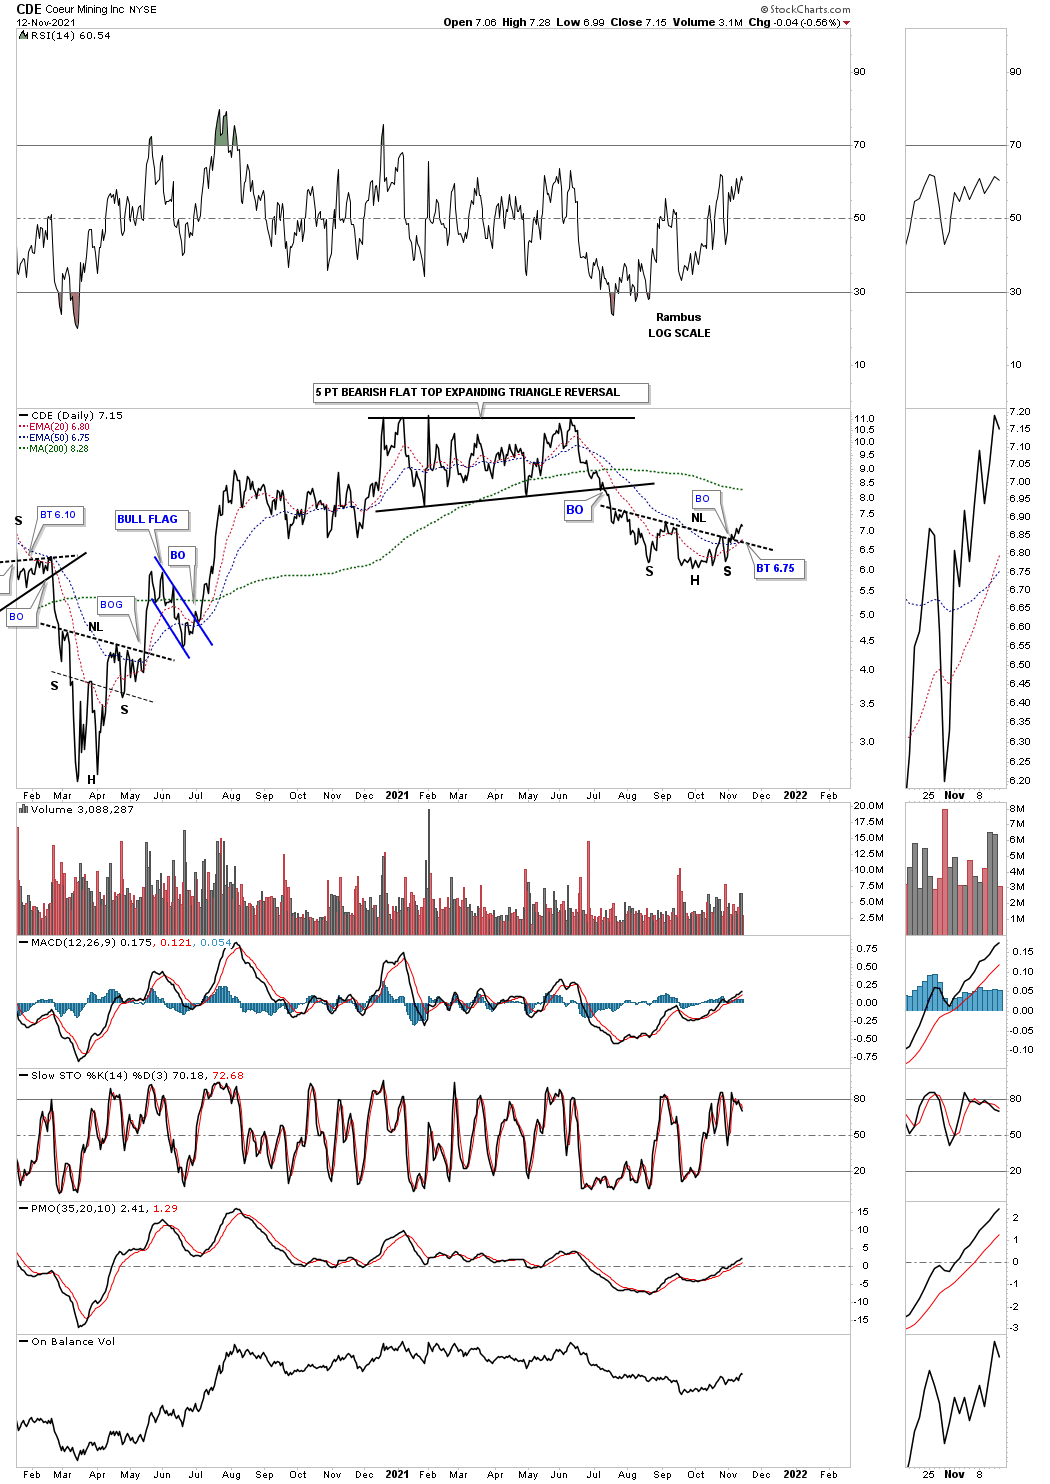
LAST WEEK:
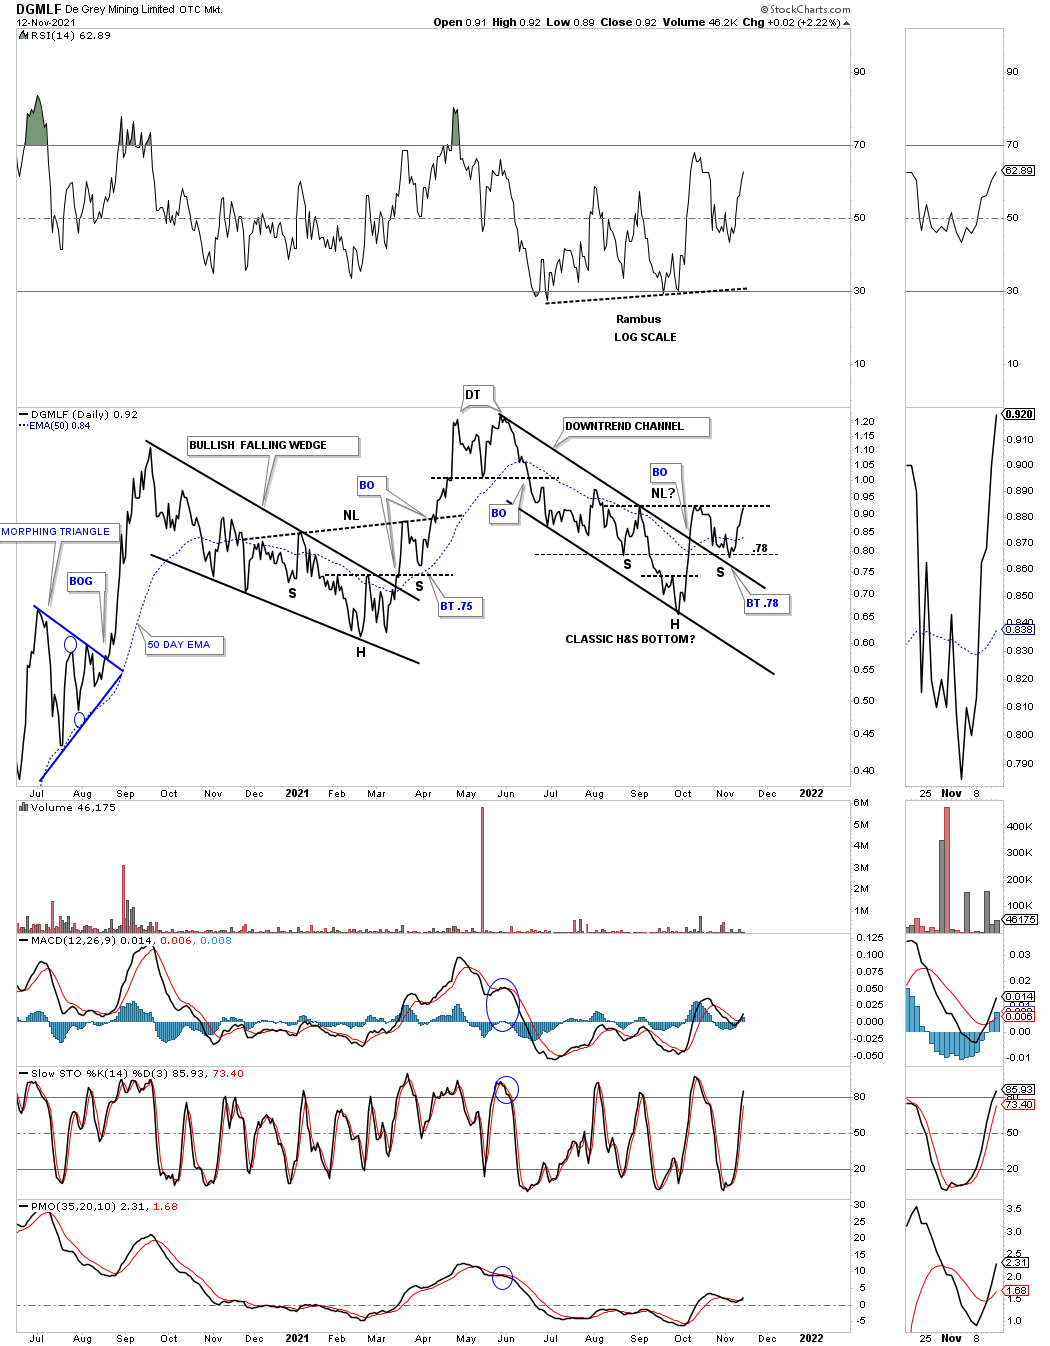
DGMLF THIS WEEK:
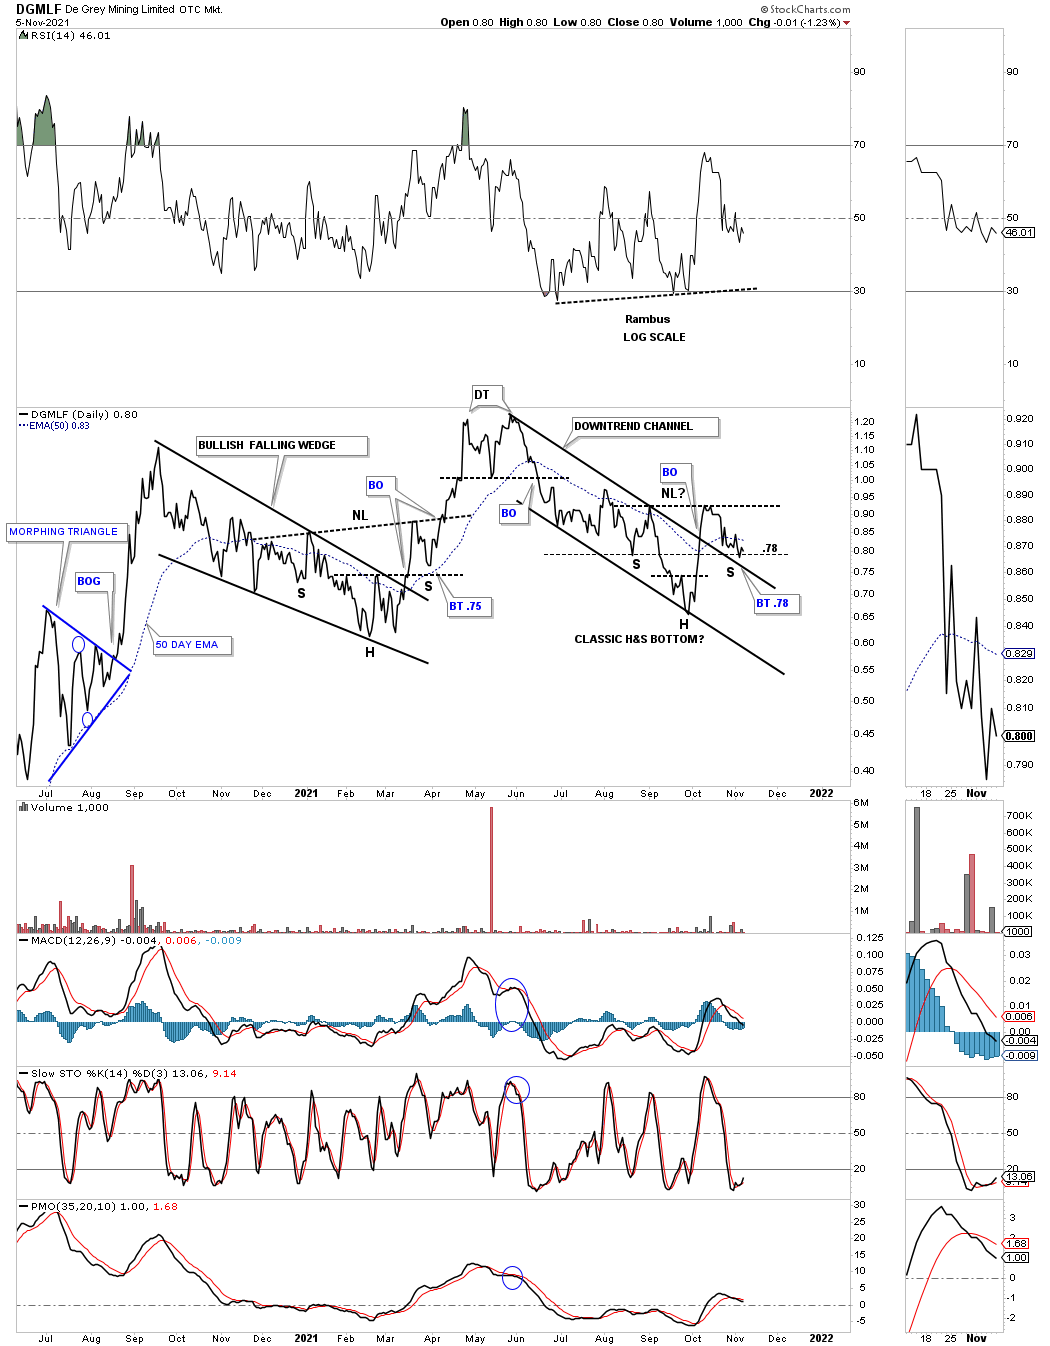
LAST WEEK:
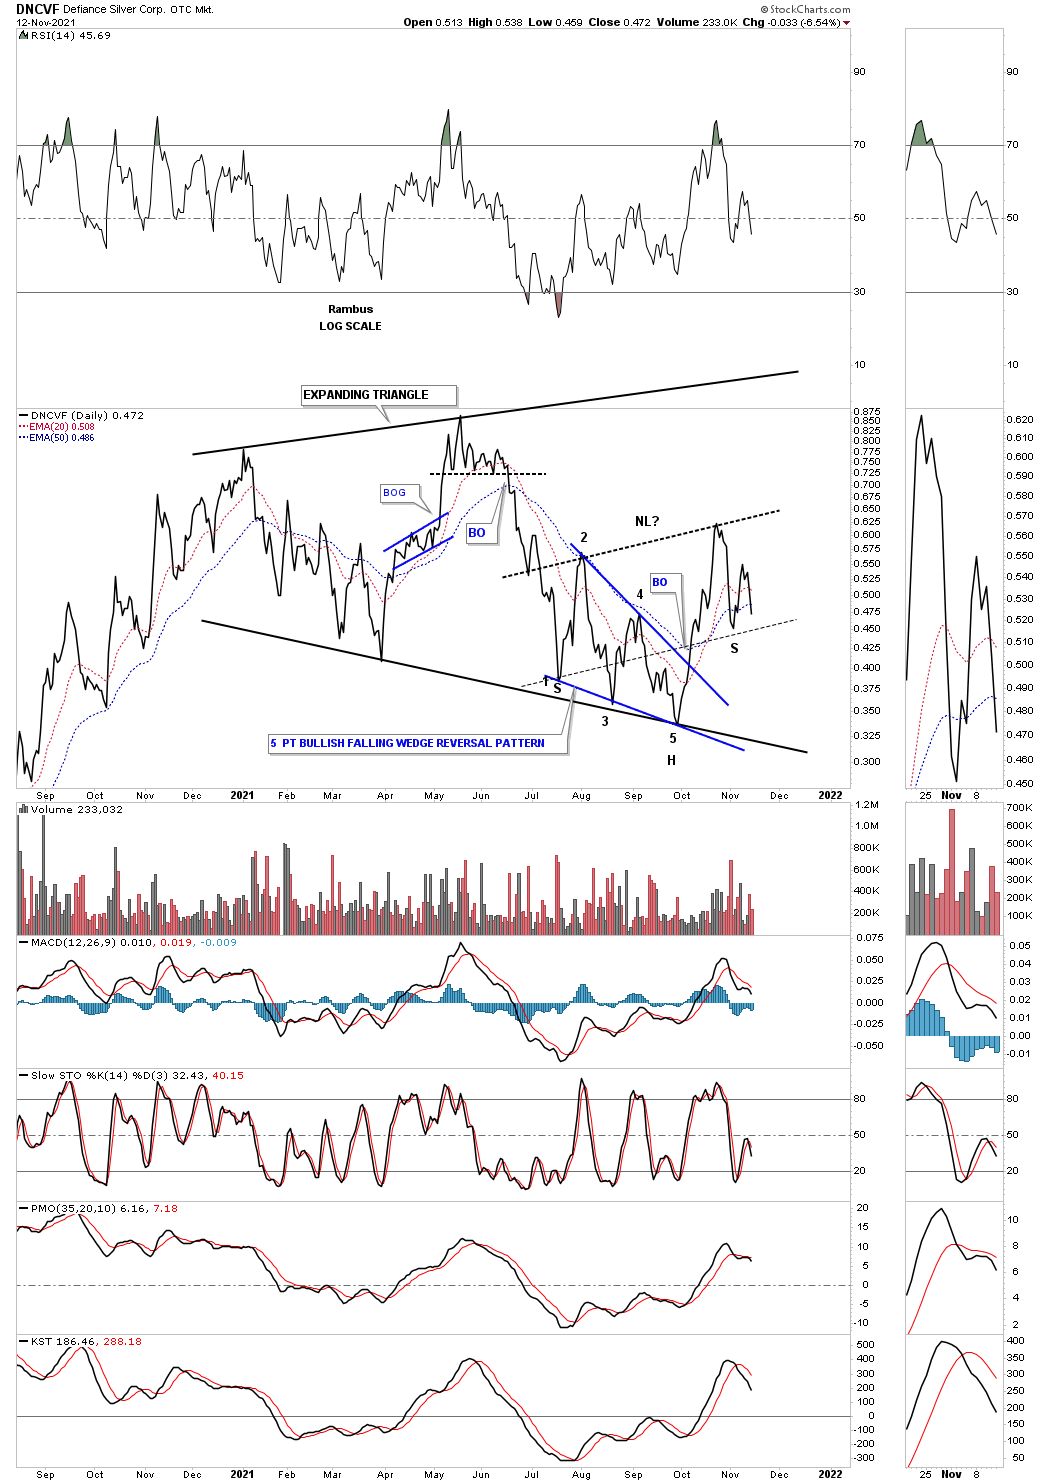
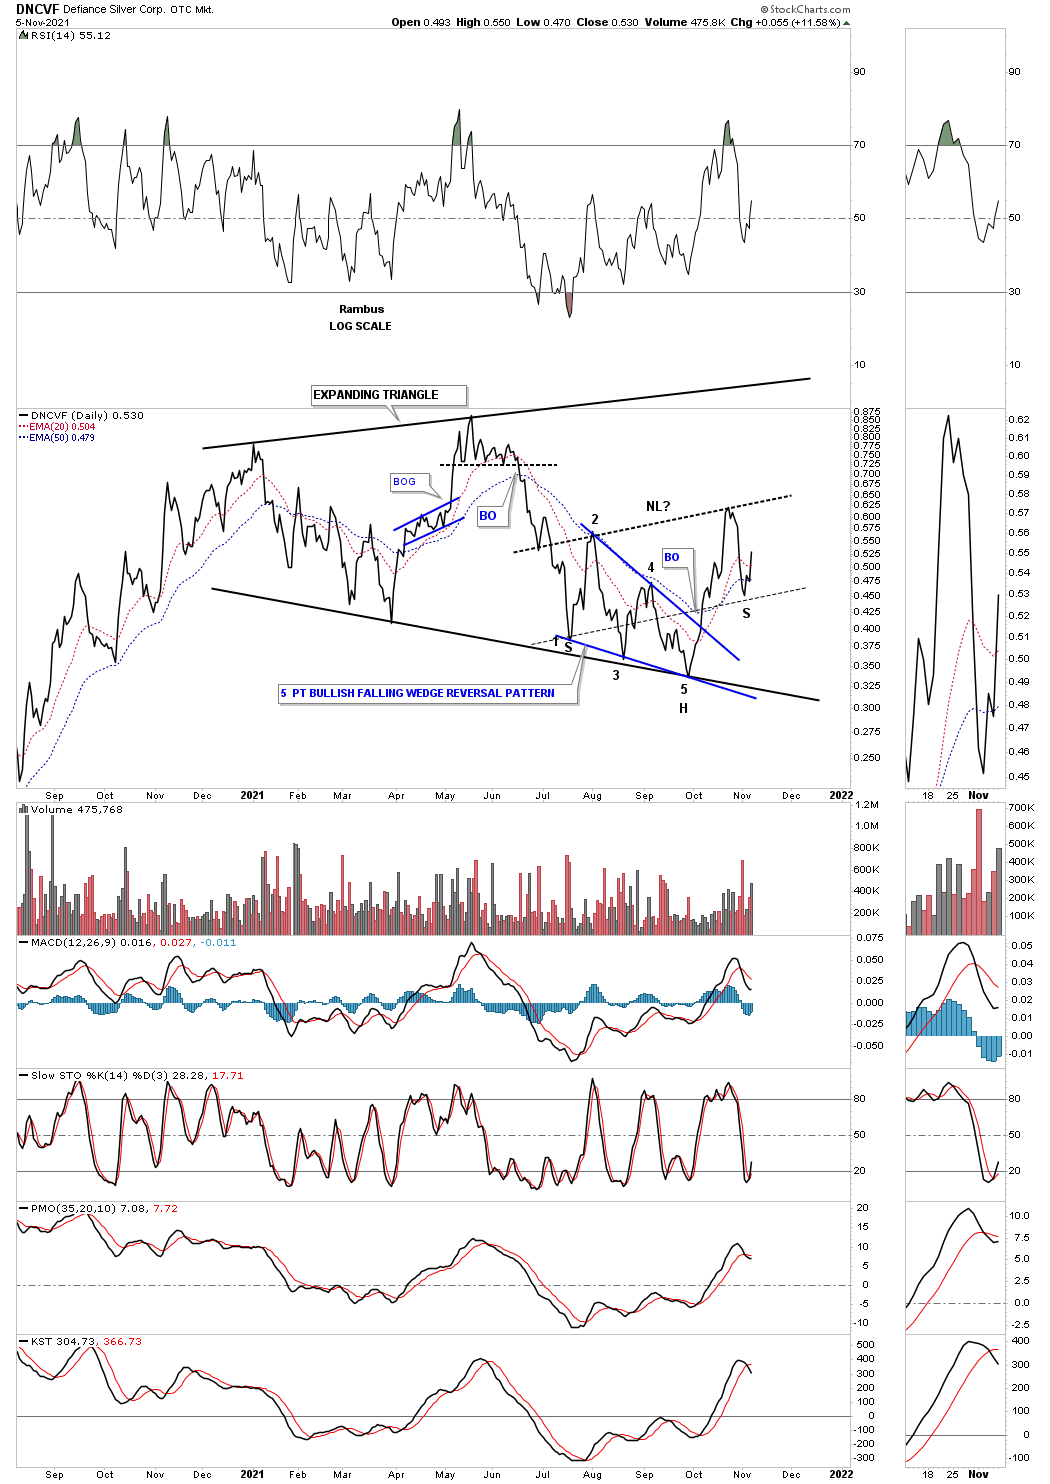
DNCVF THIS WEEK:
LAST WEEK:
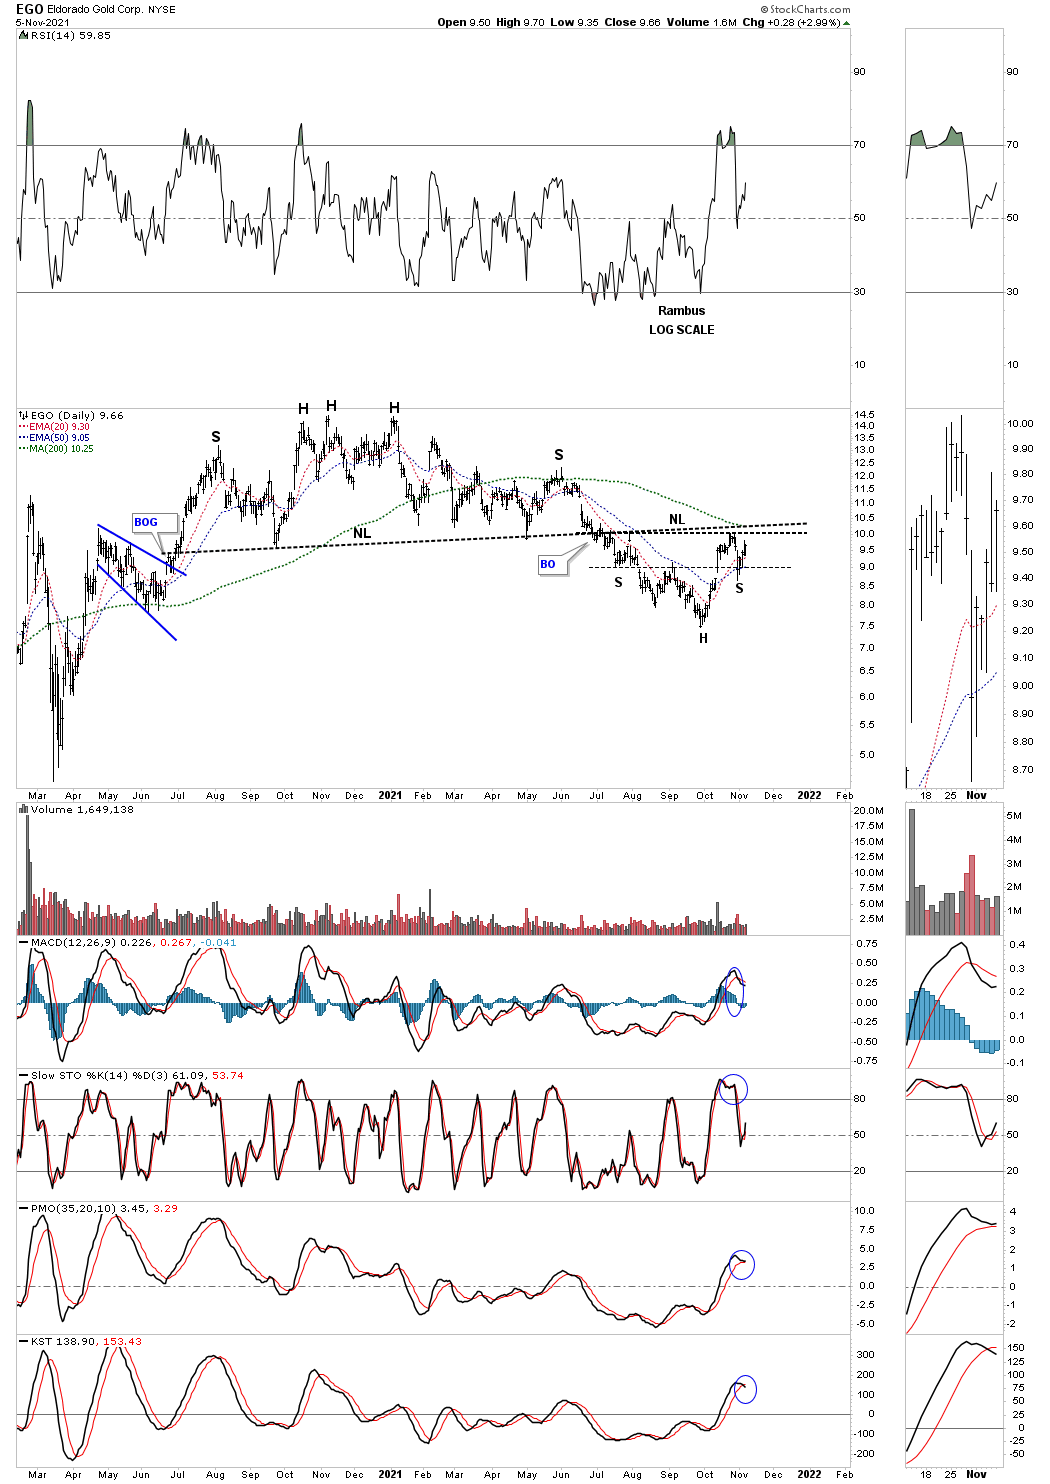
EGO THIS WEEK:
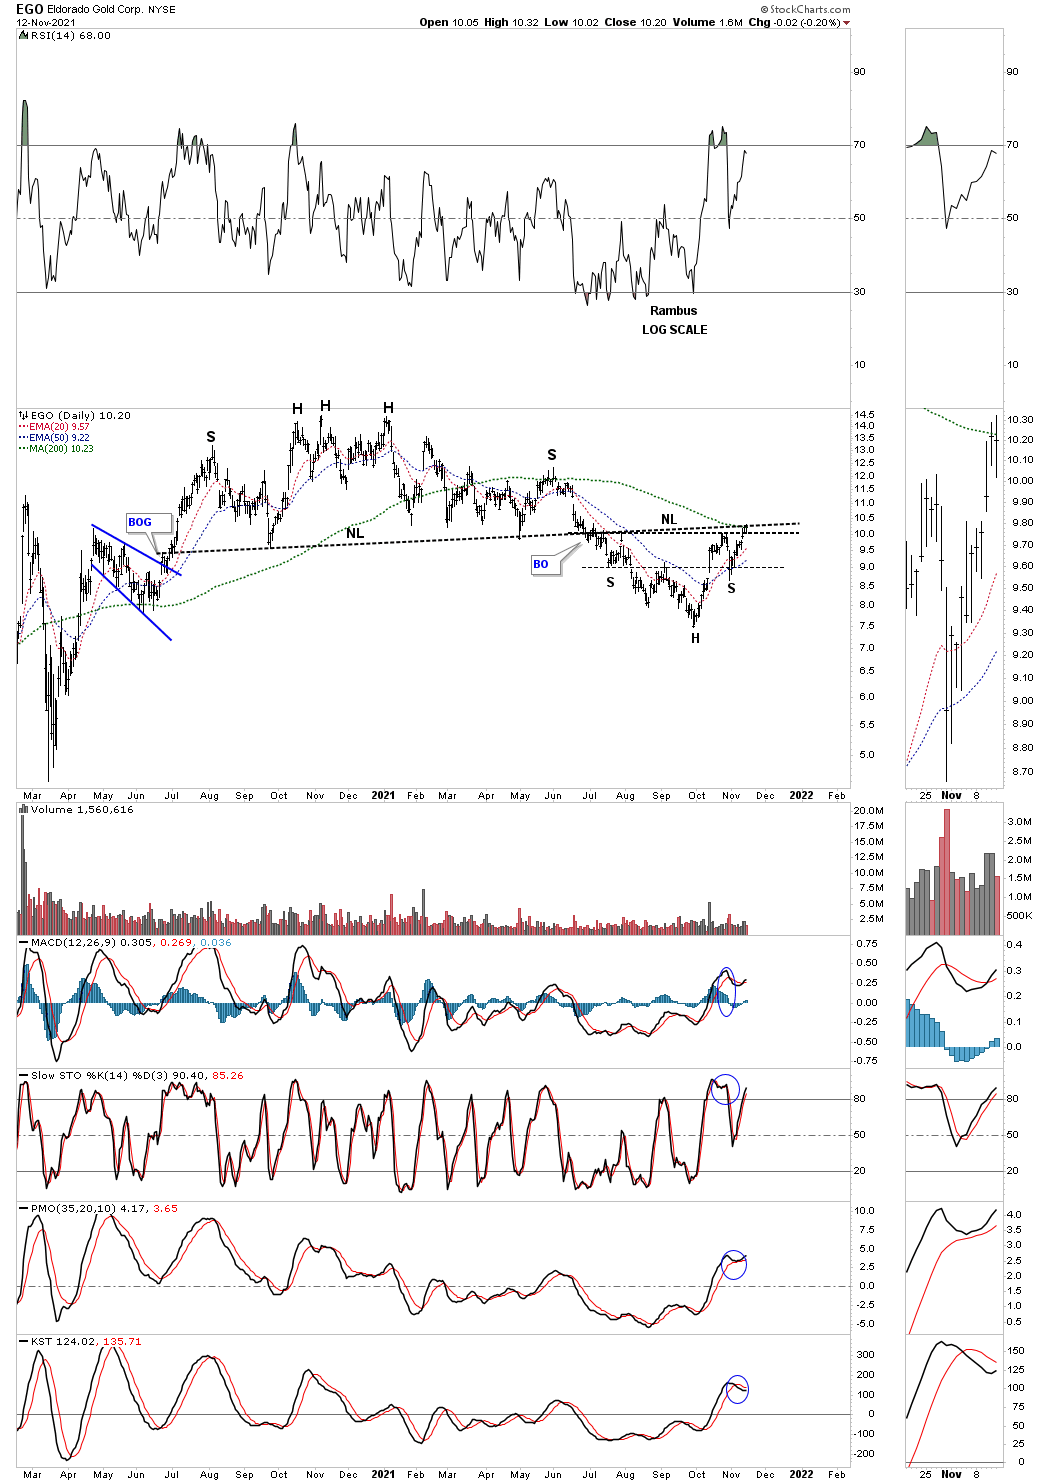
LAST WEEK:
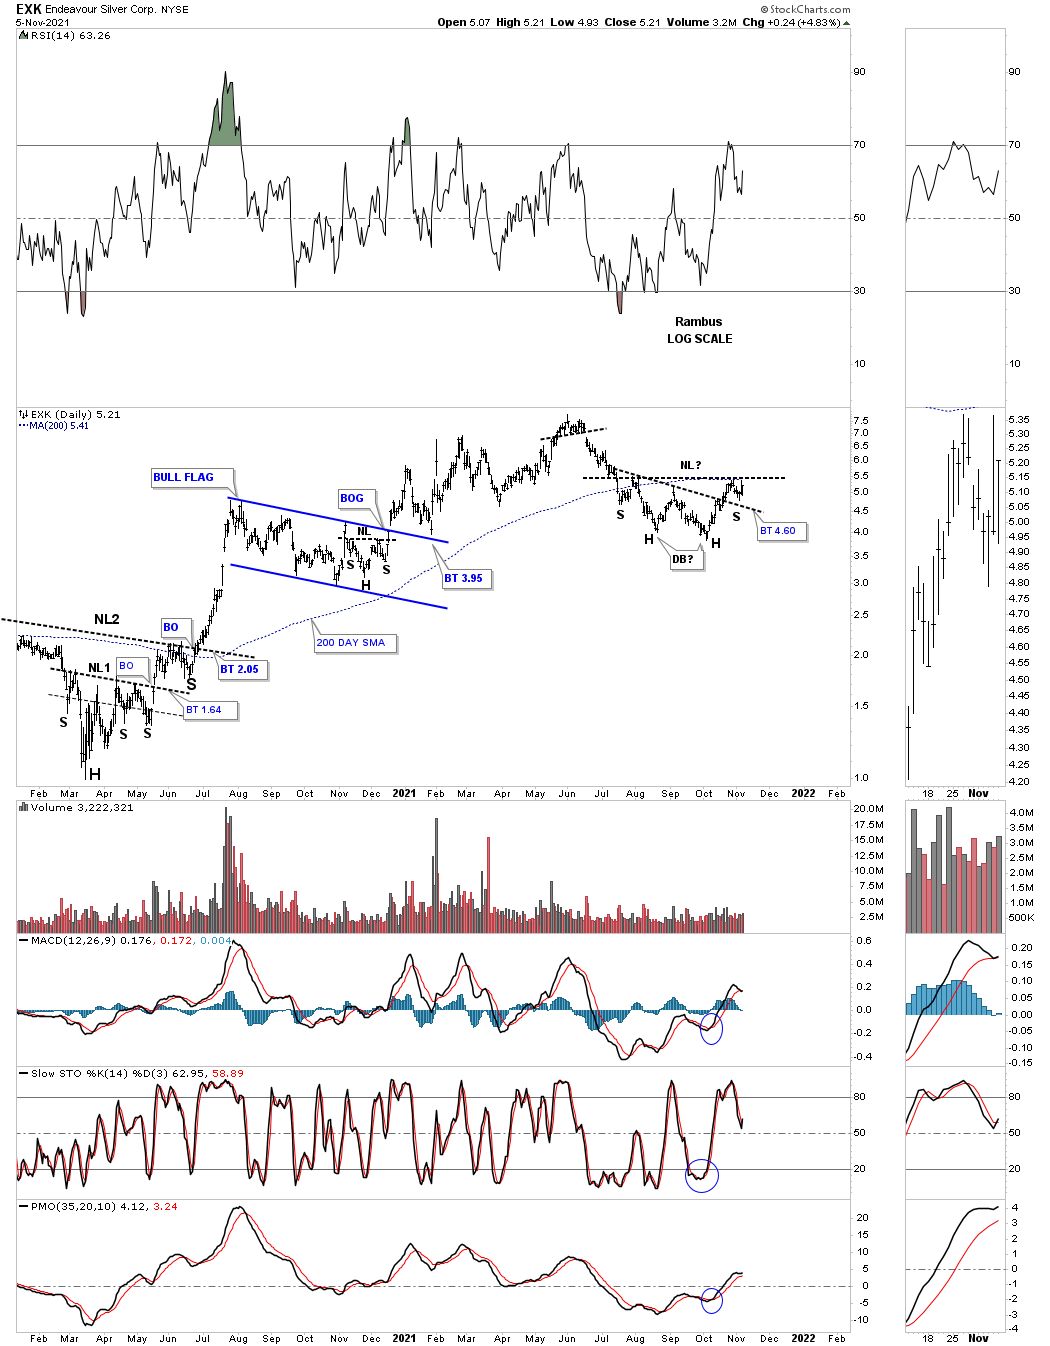
EXK THIS WEEK:
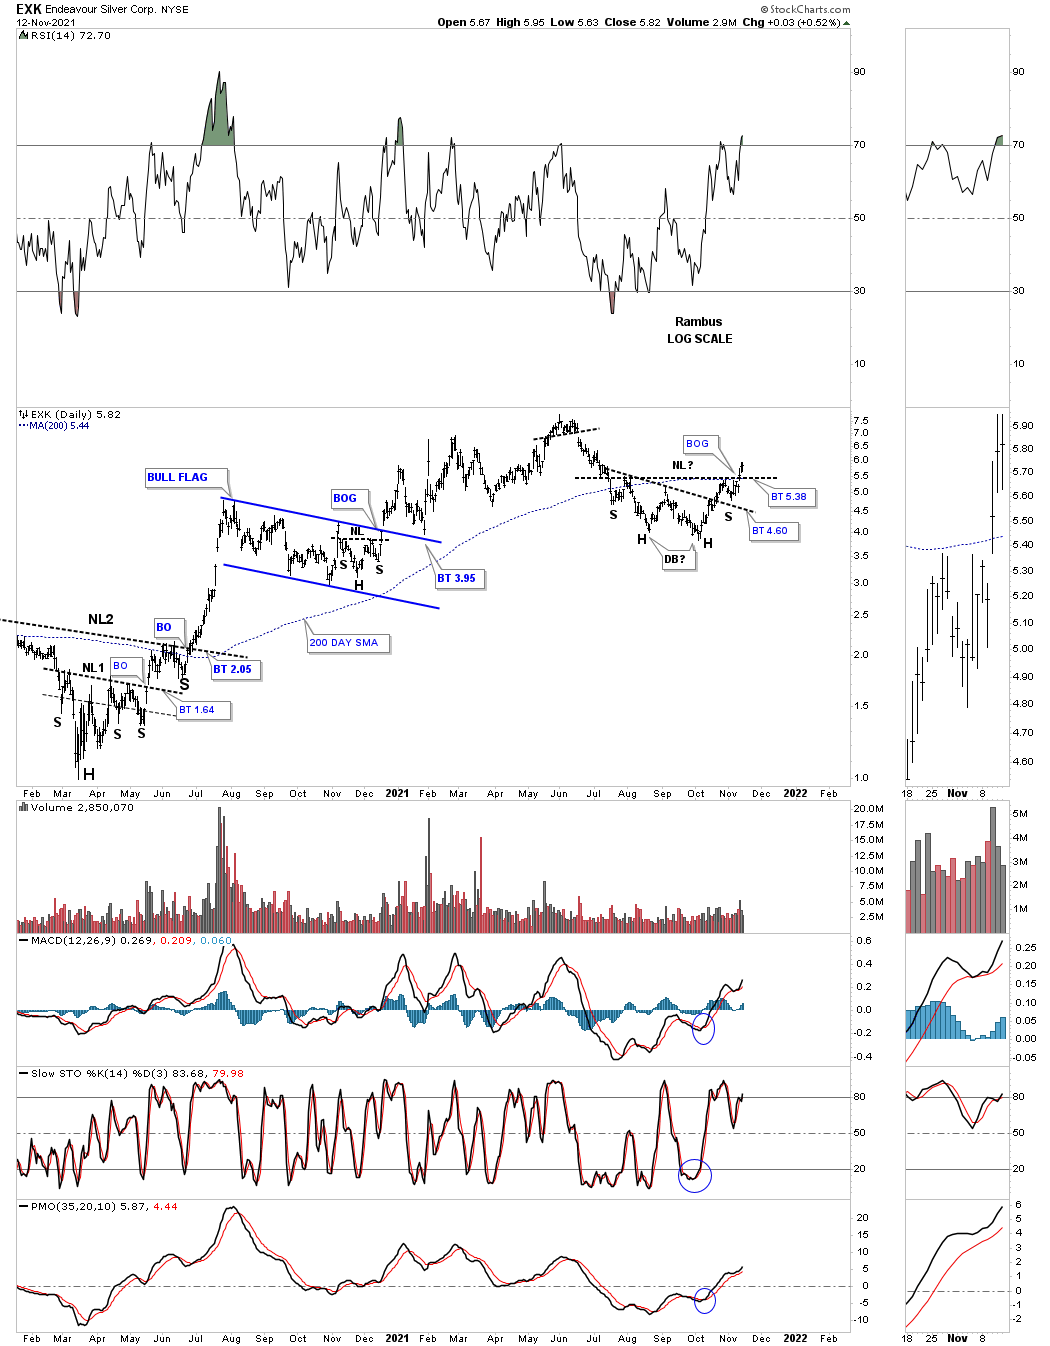
LAST WEEK:
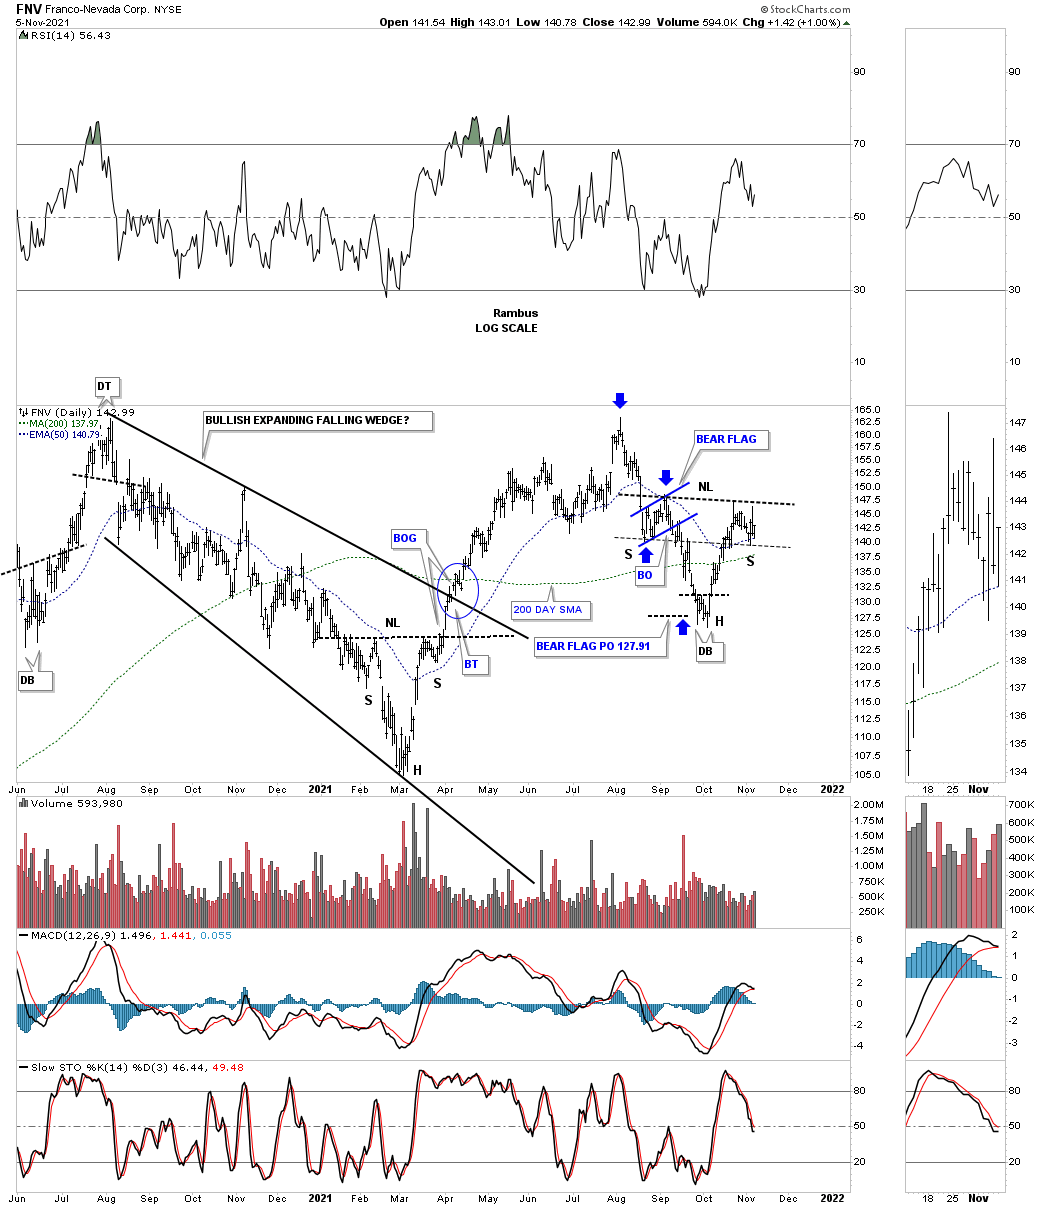
FNV THIS WEEK:
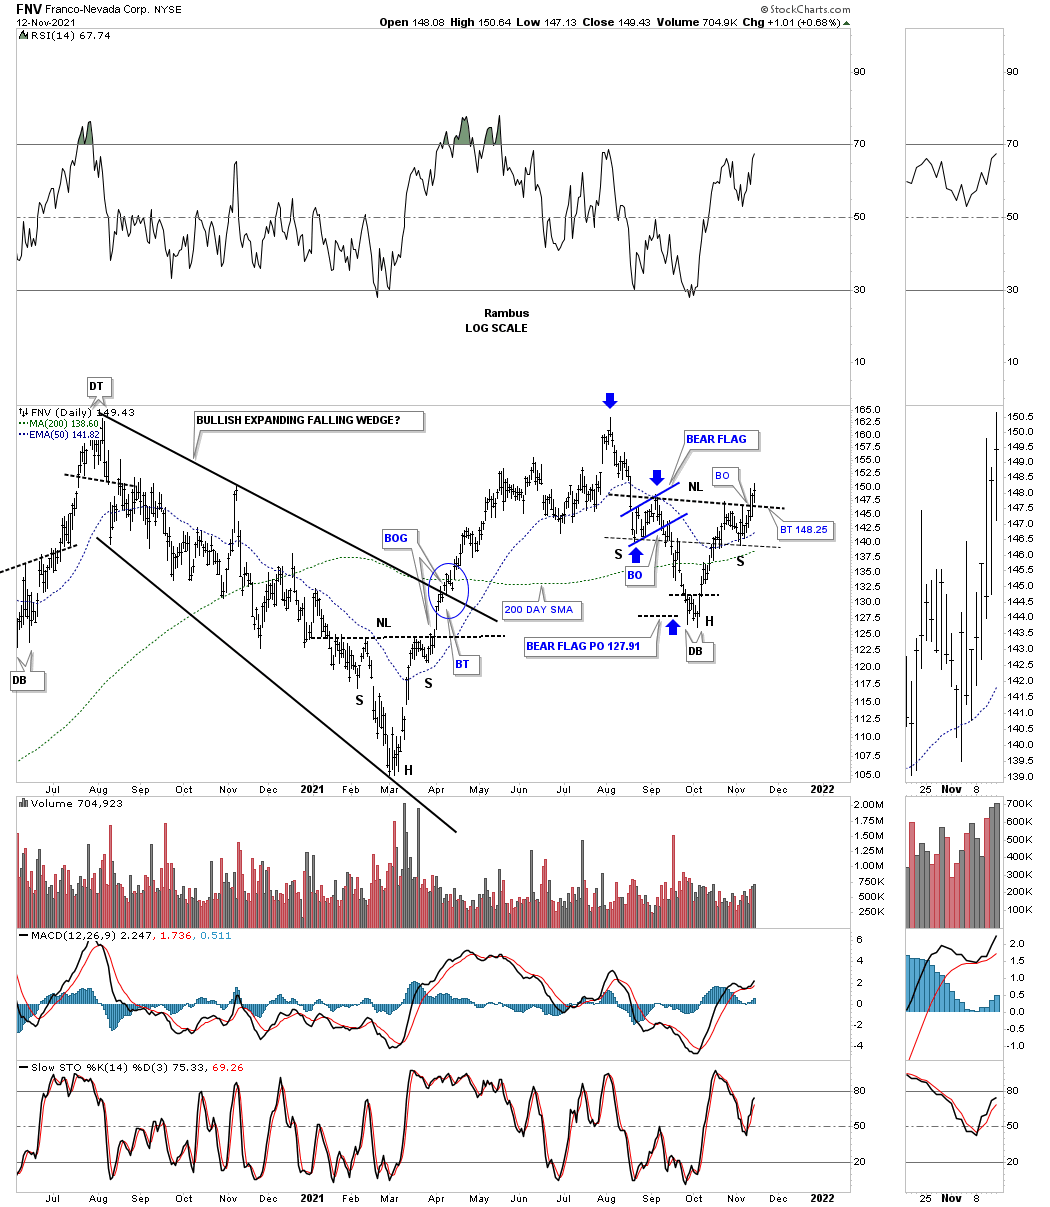
LAST WEEK:
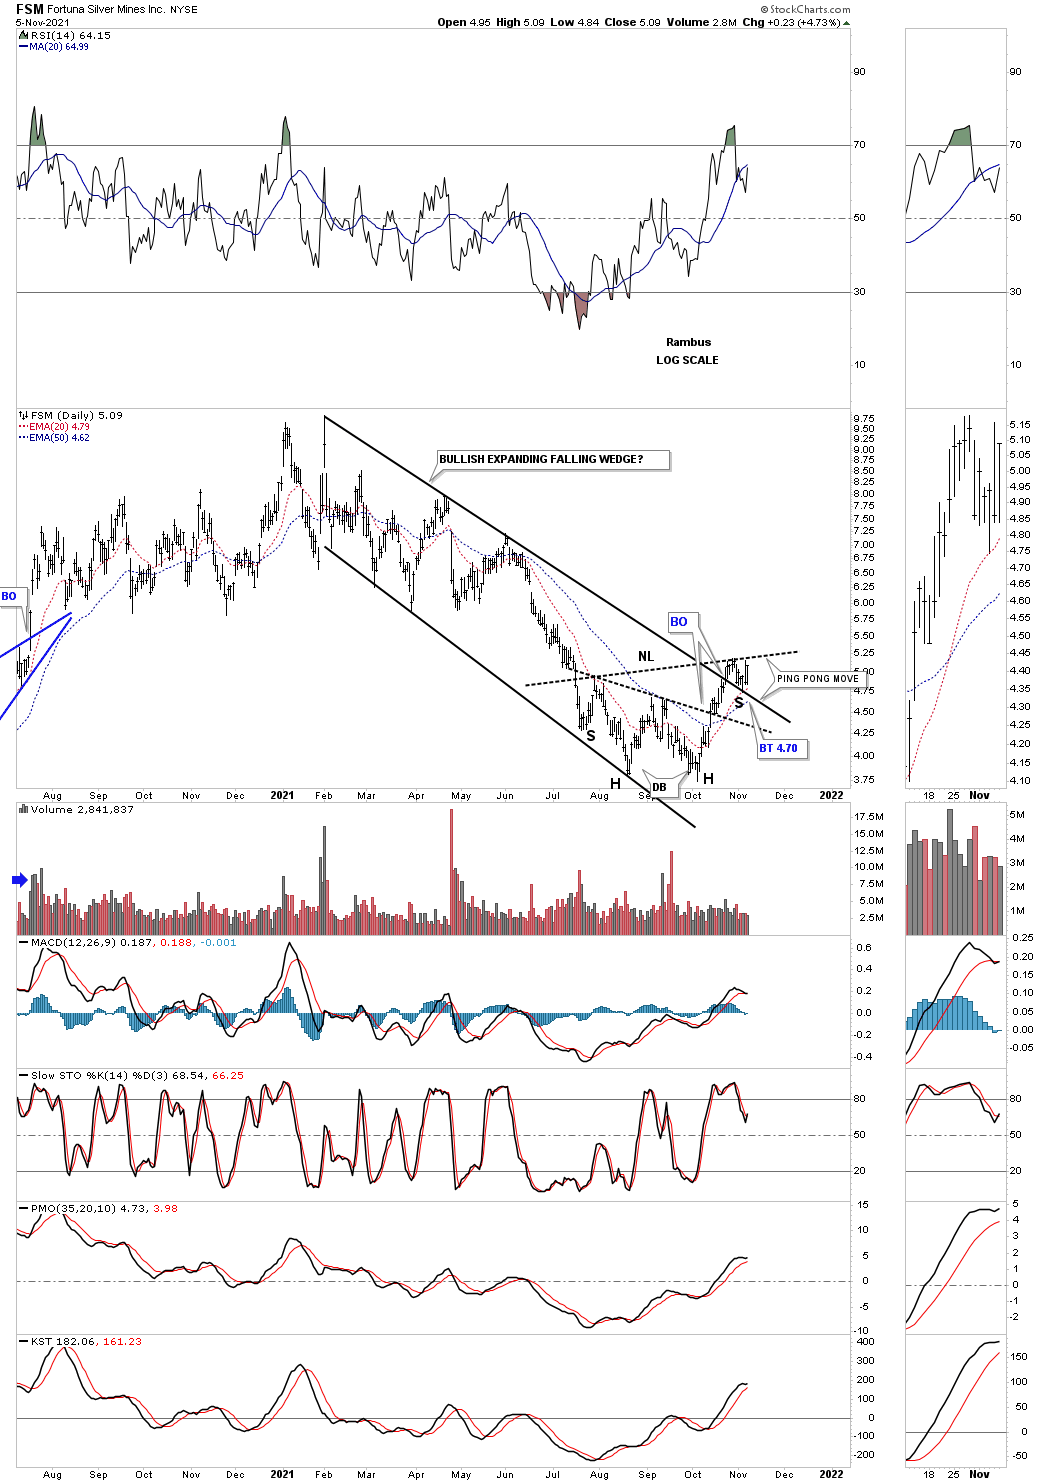
FSM THIS WEEK: Broken
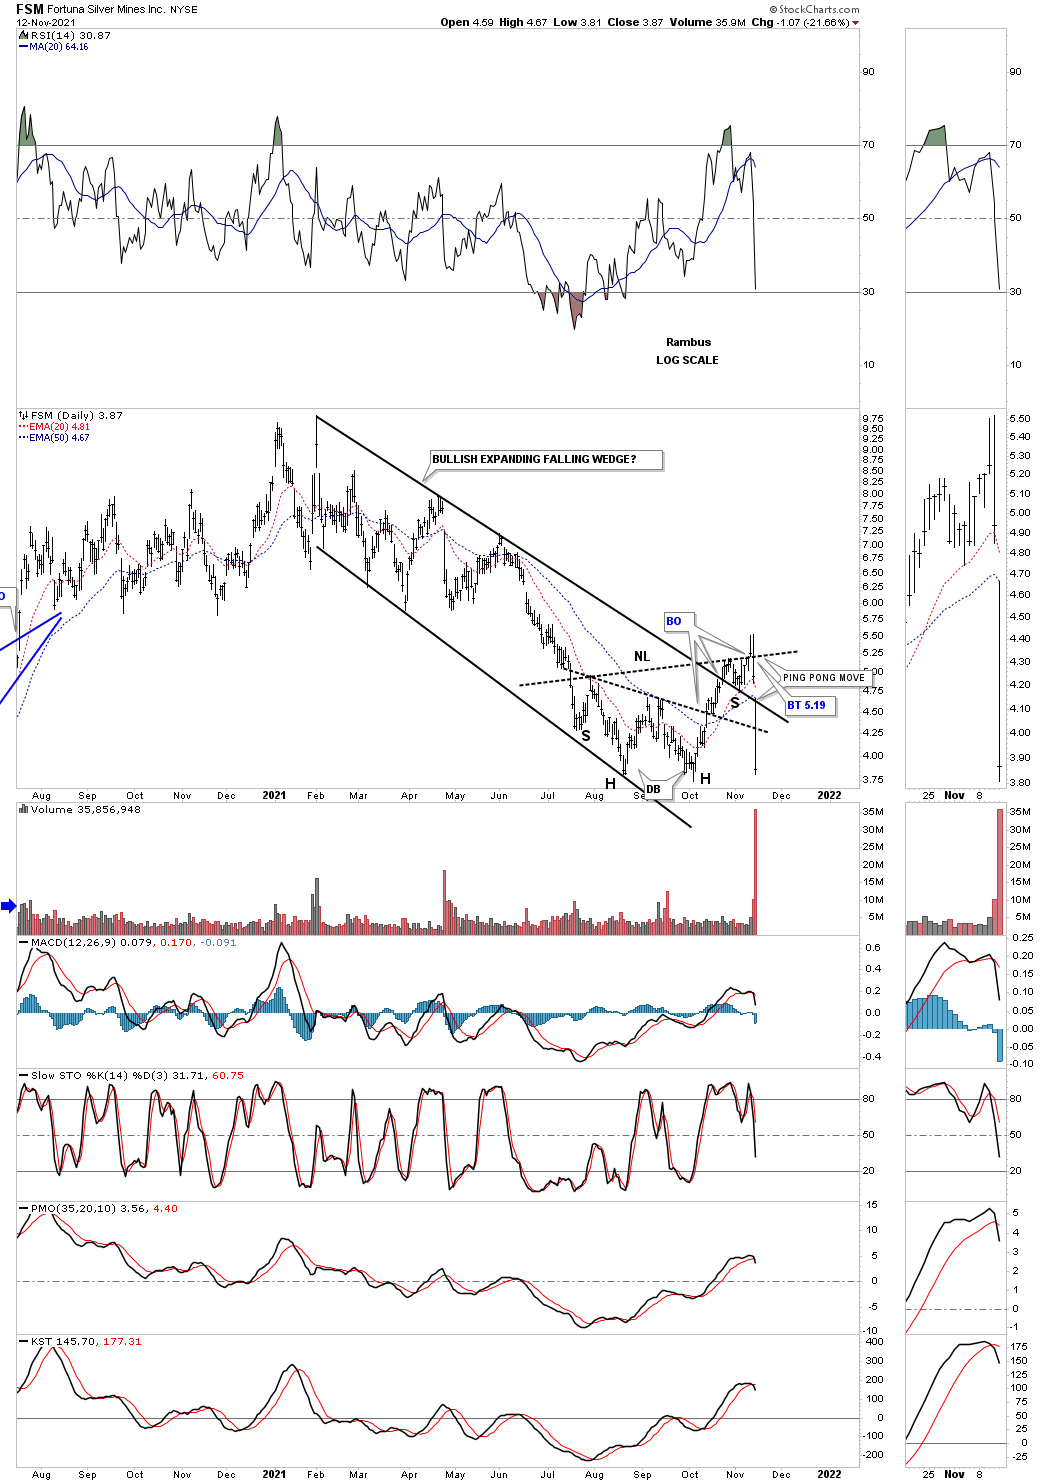
LAST WEEK:
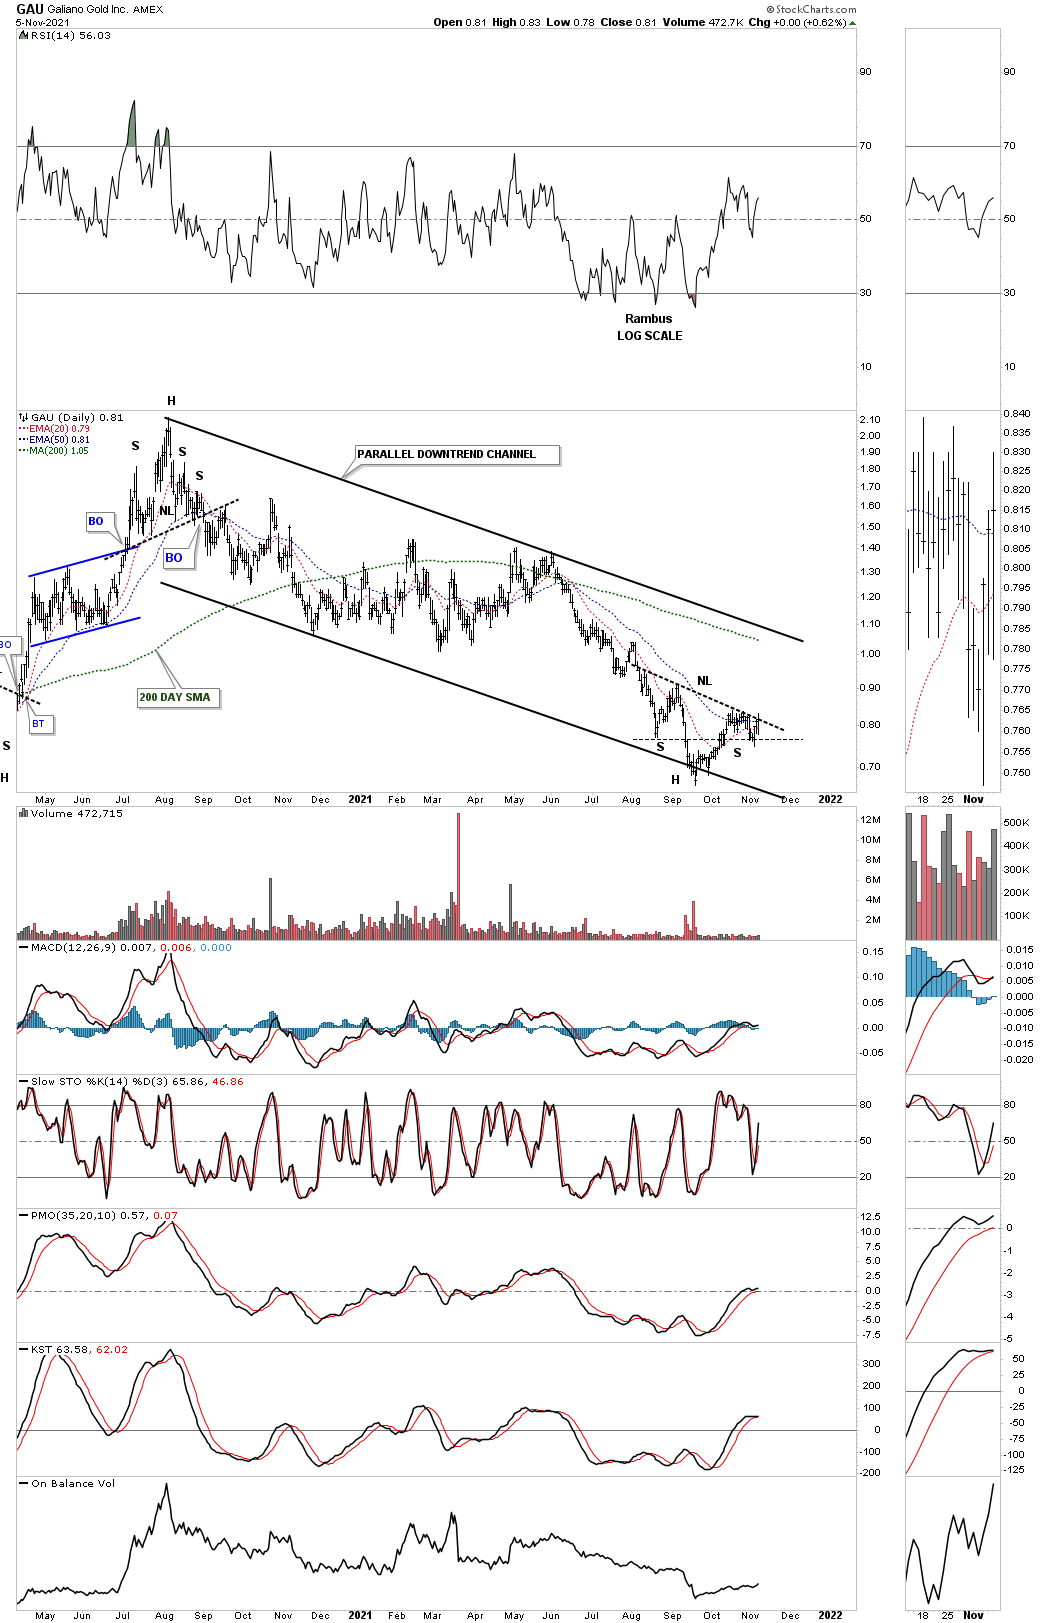
GAU THIS WEEK:
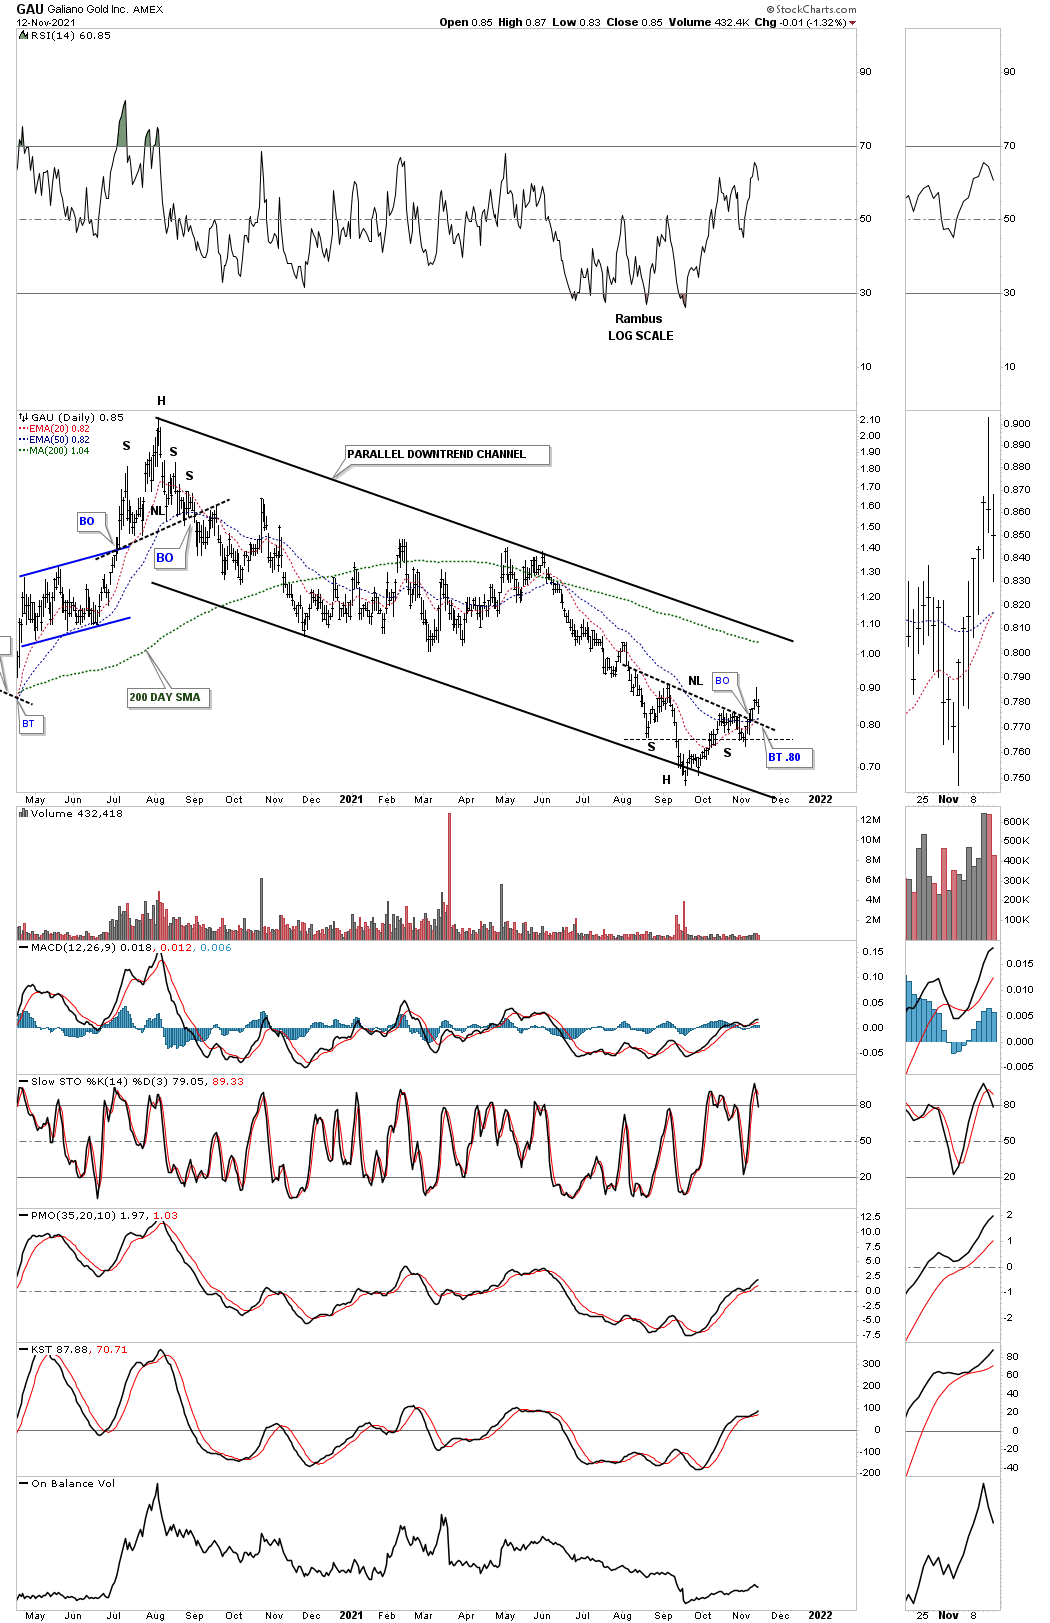
LAST WEEK:
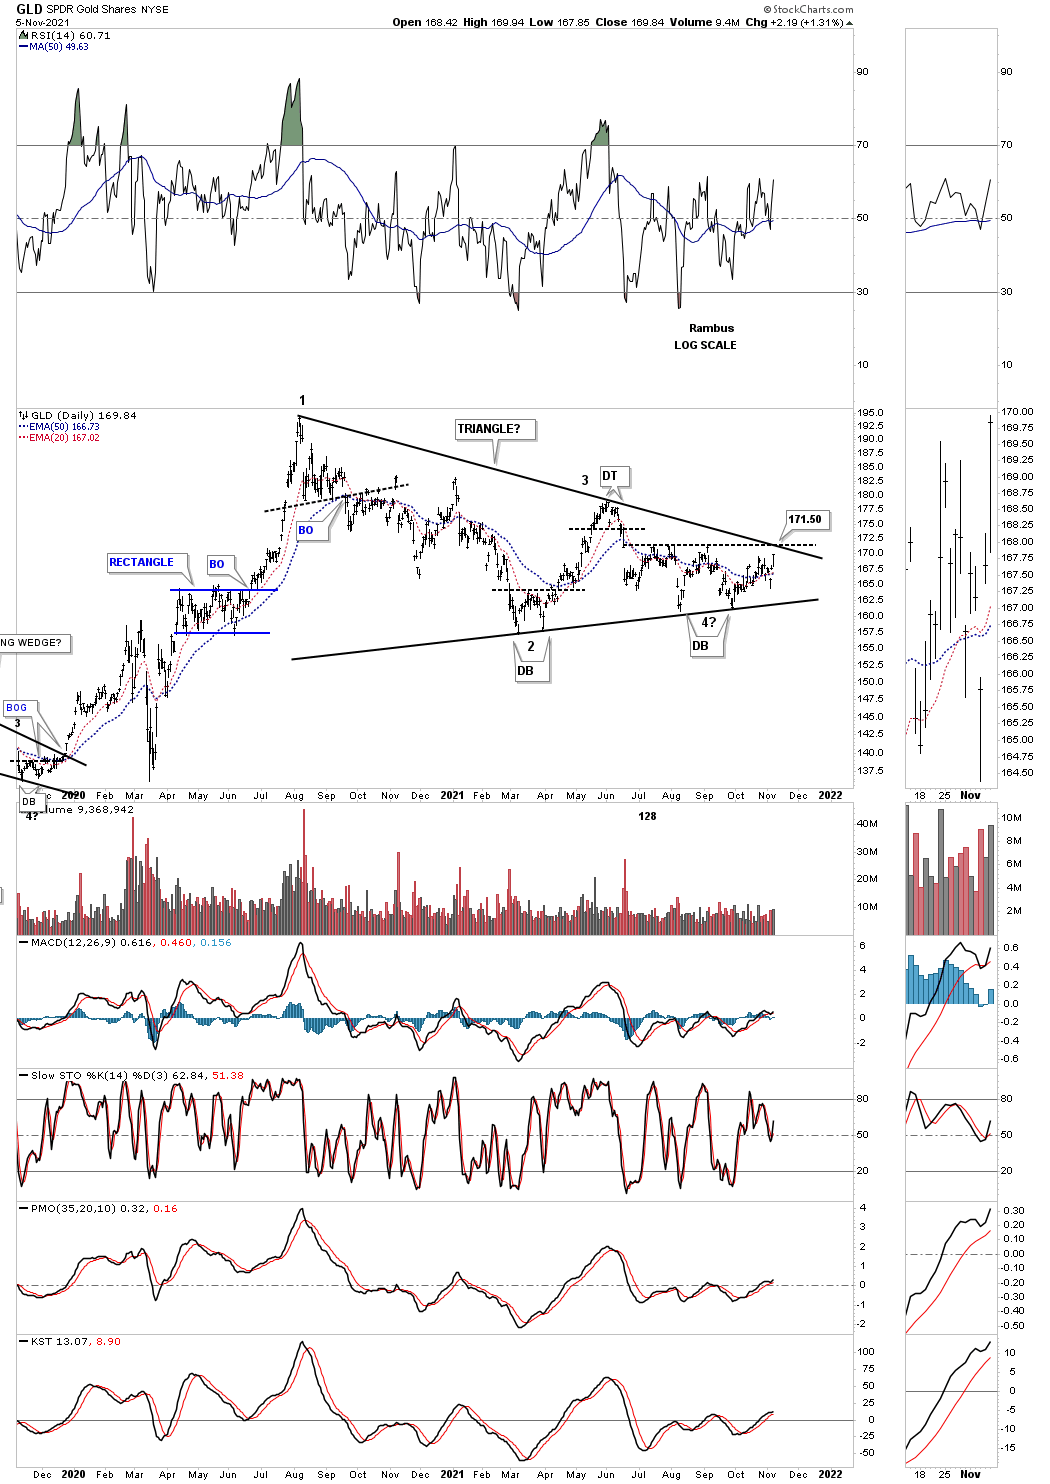
GLD THIS WEEK:
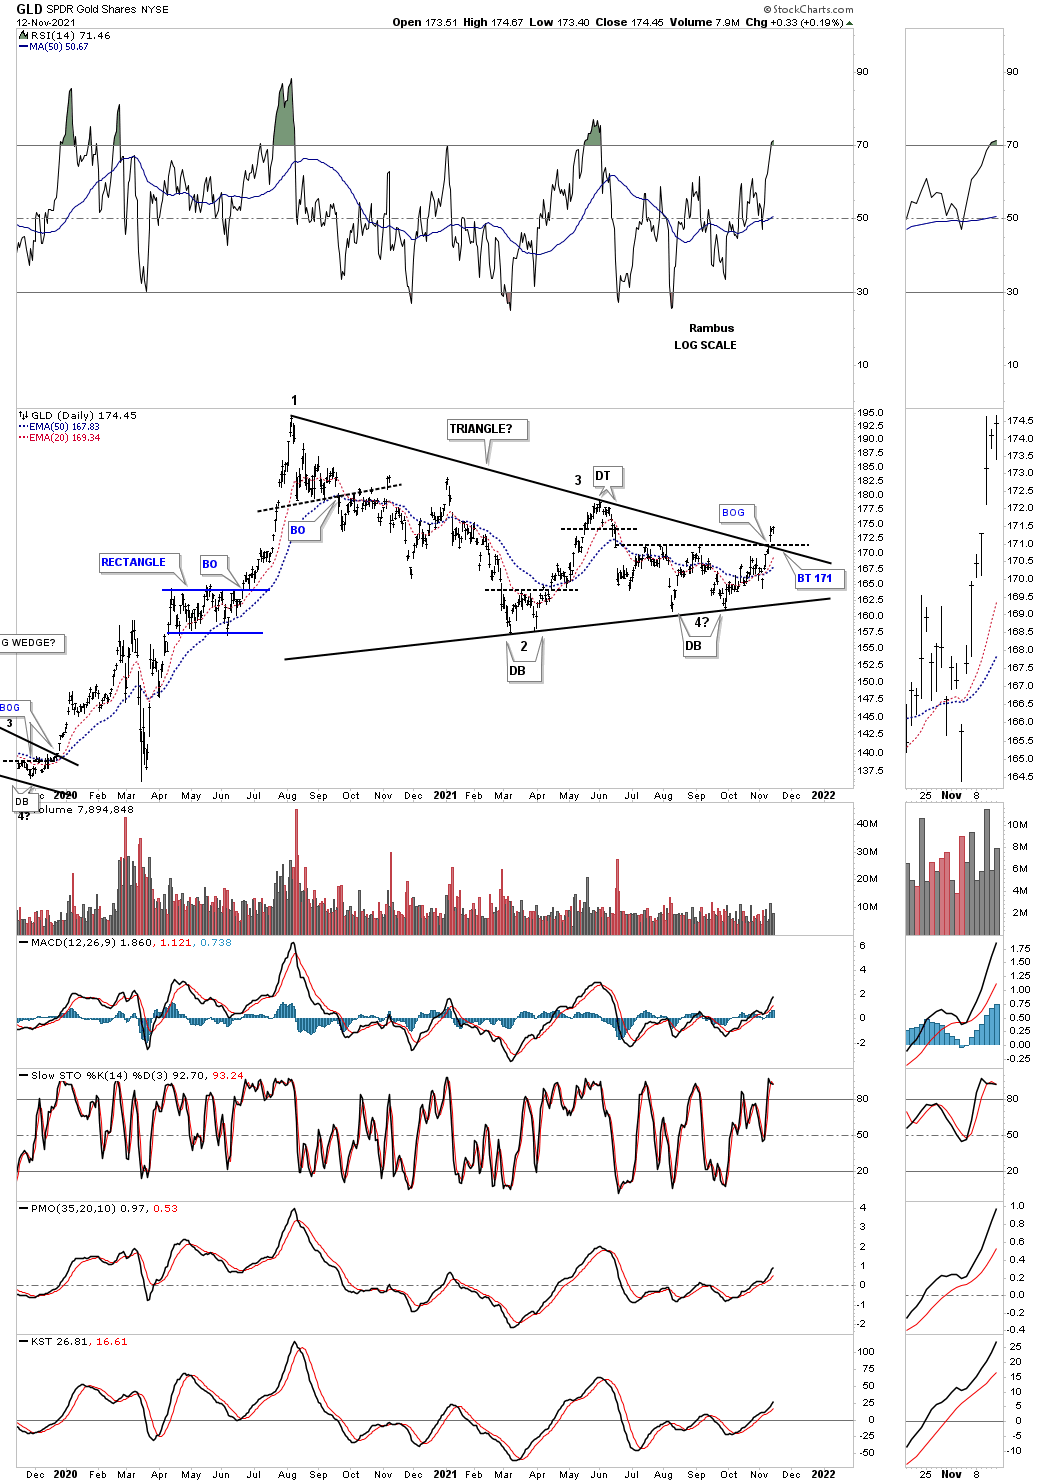
LAST WEEK:
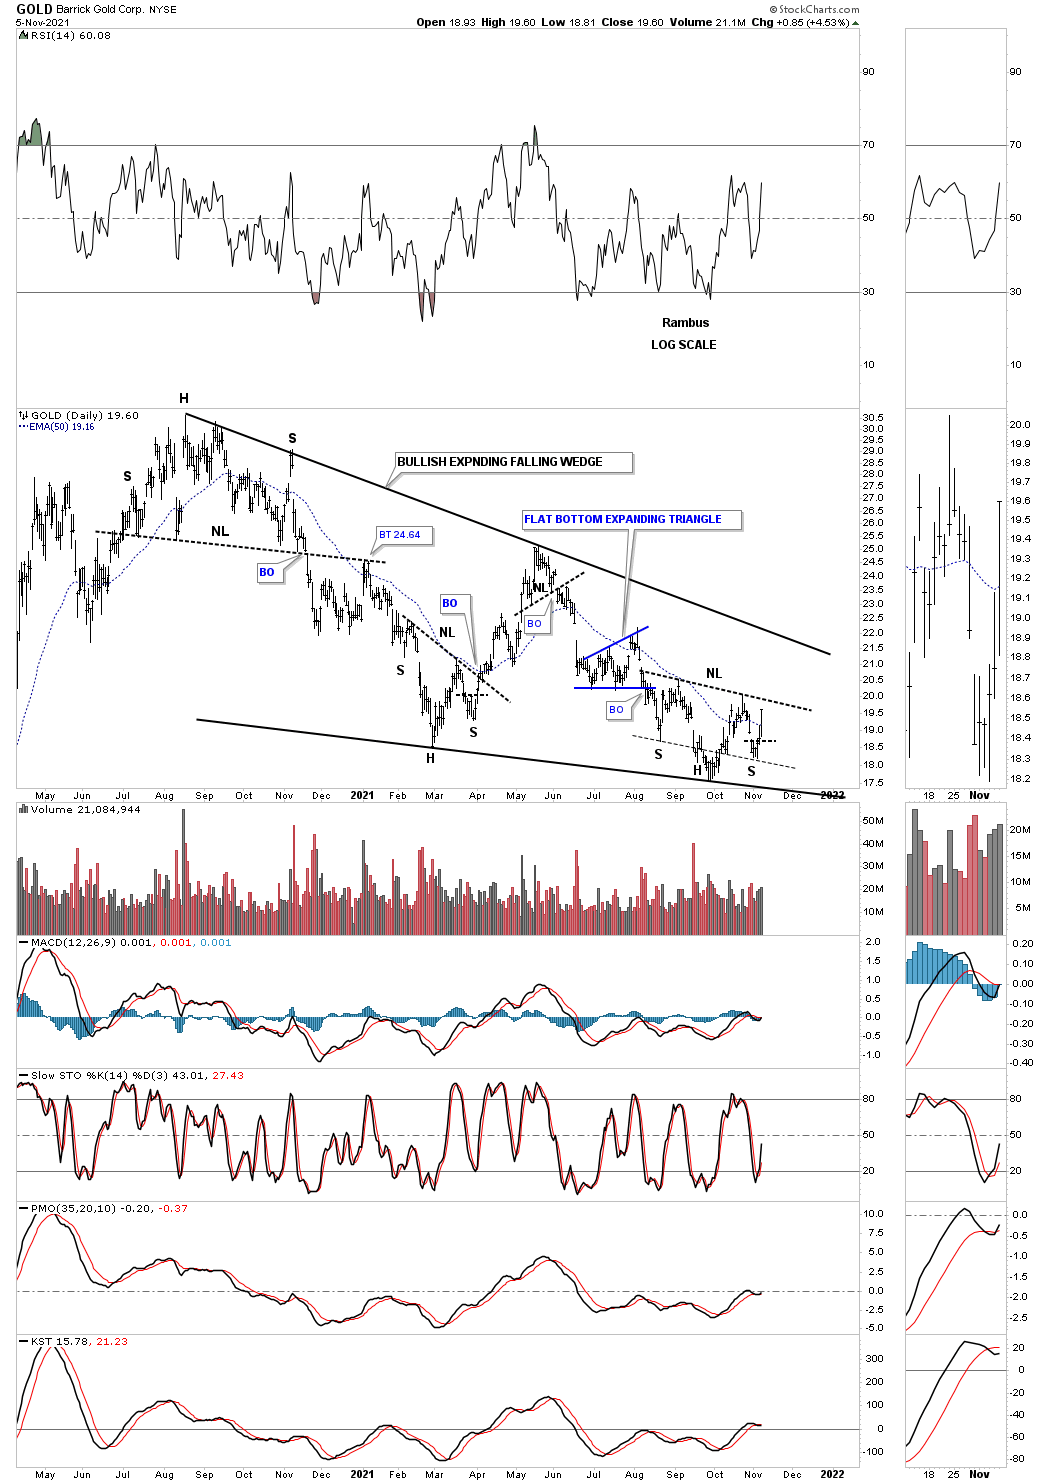
ABX / GOLD THIS WEEK:
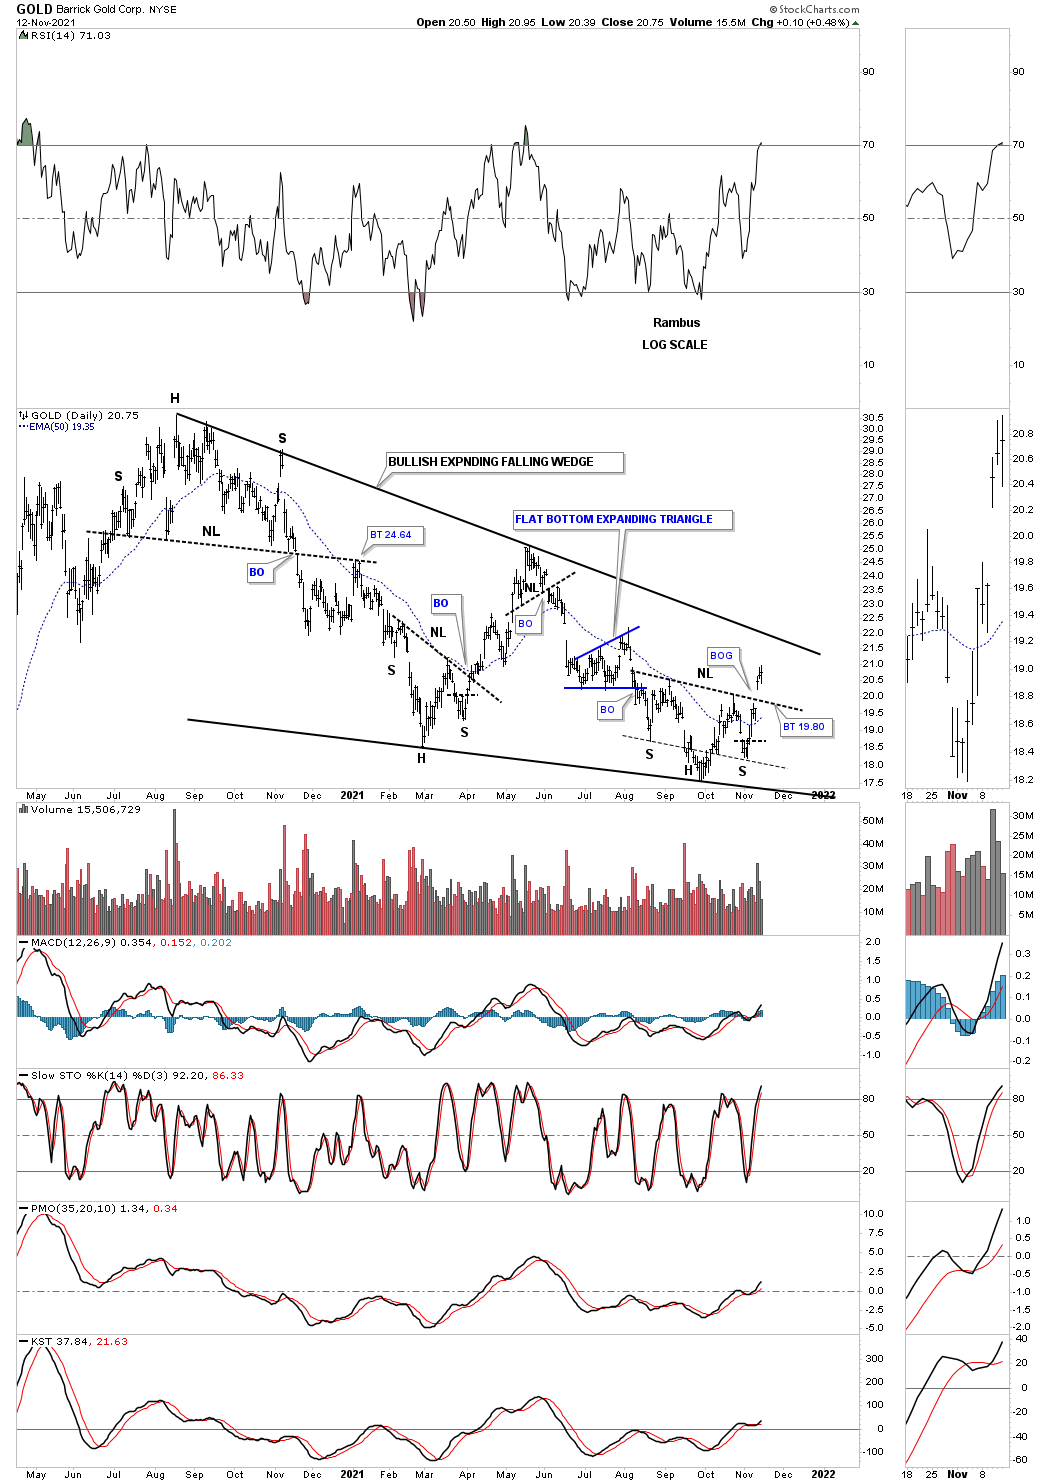
LAST WEEK:
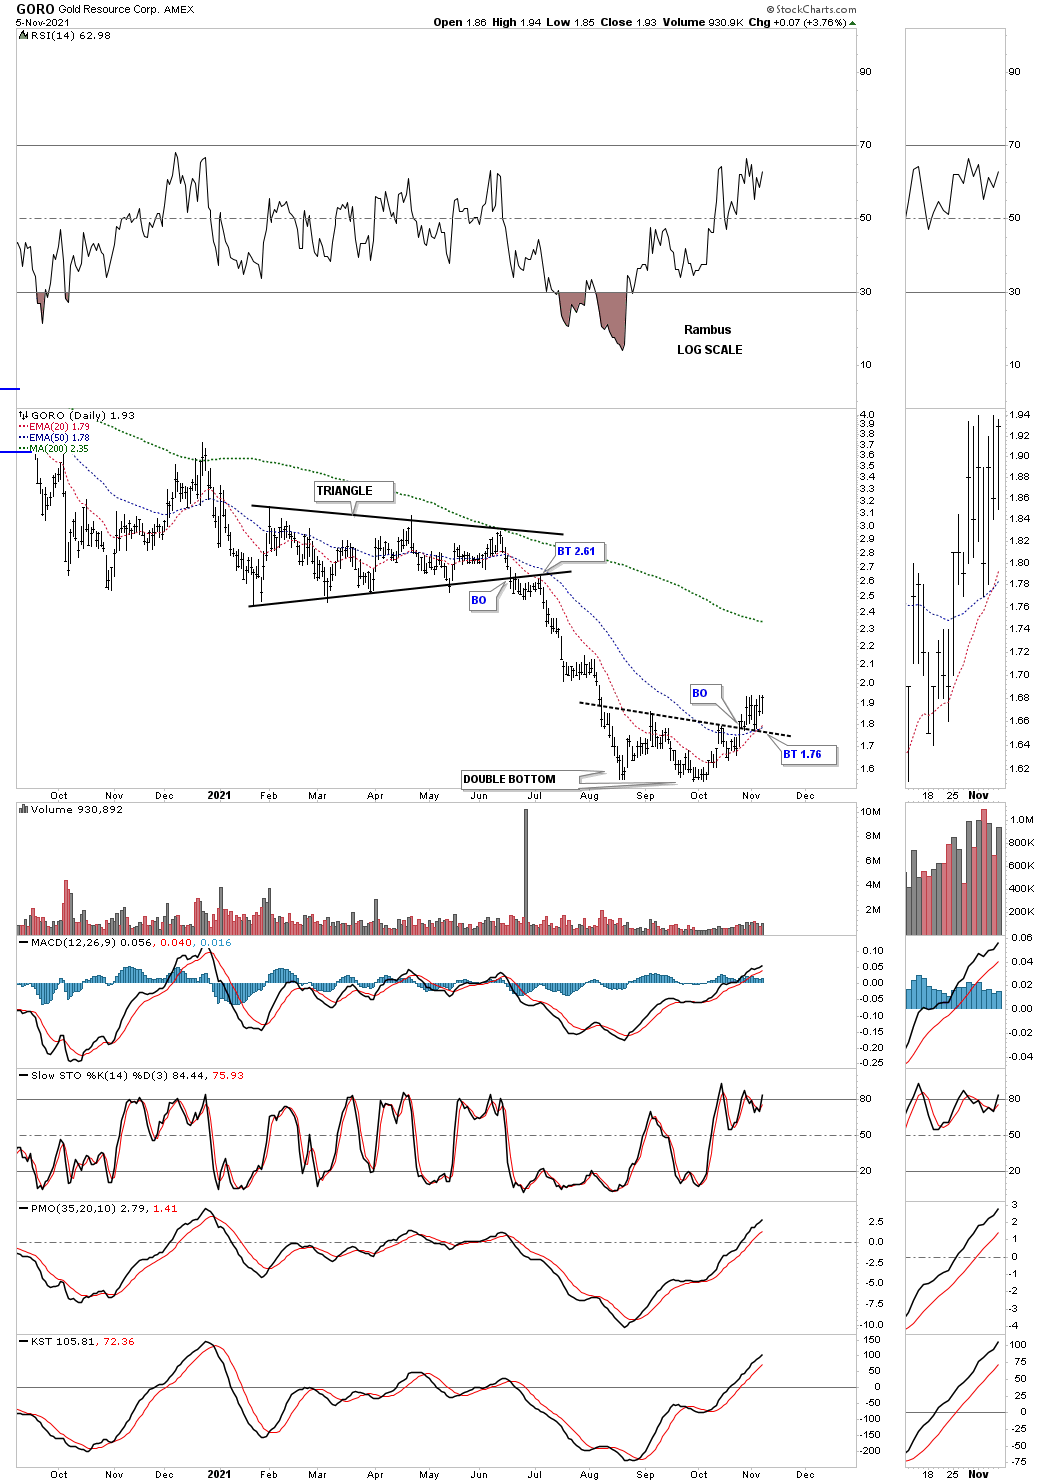
GORO THIS WEEK:
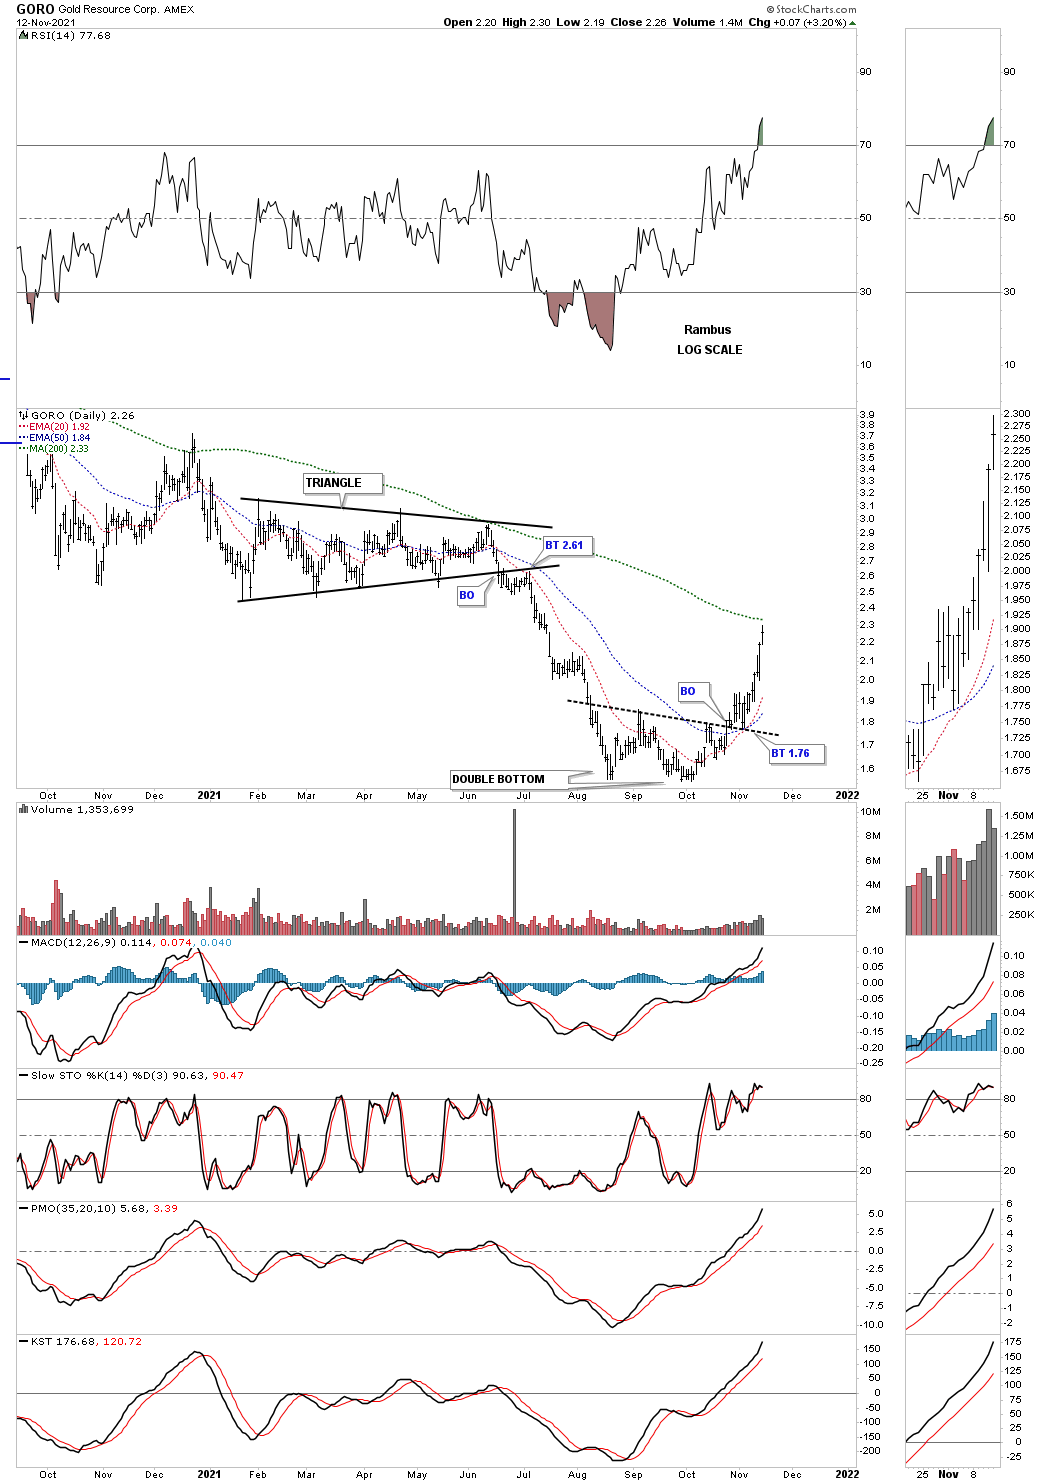
LAST WEEK:
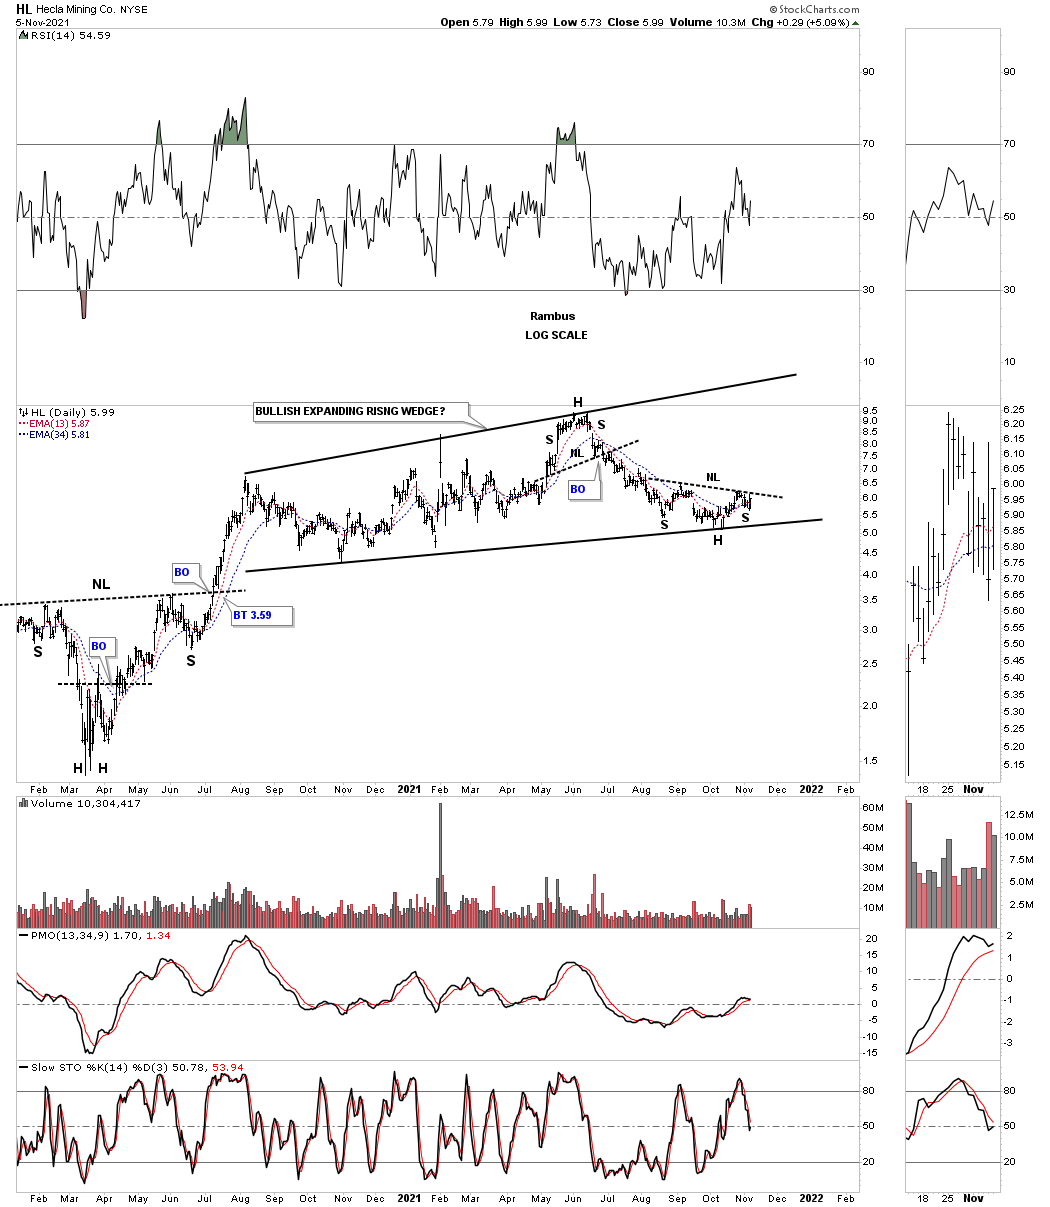
HL THIS WEEK:
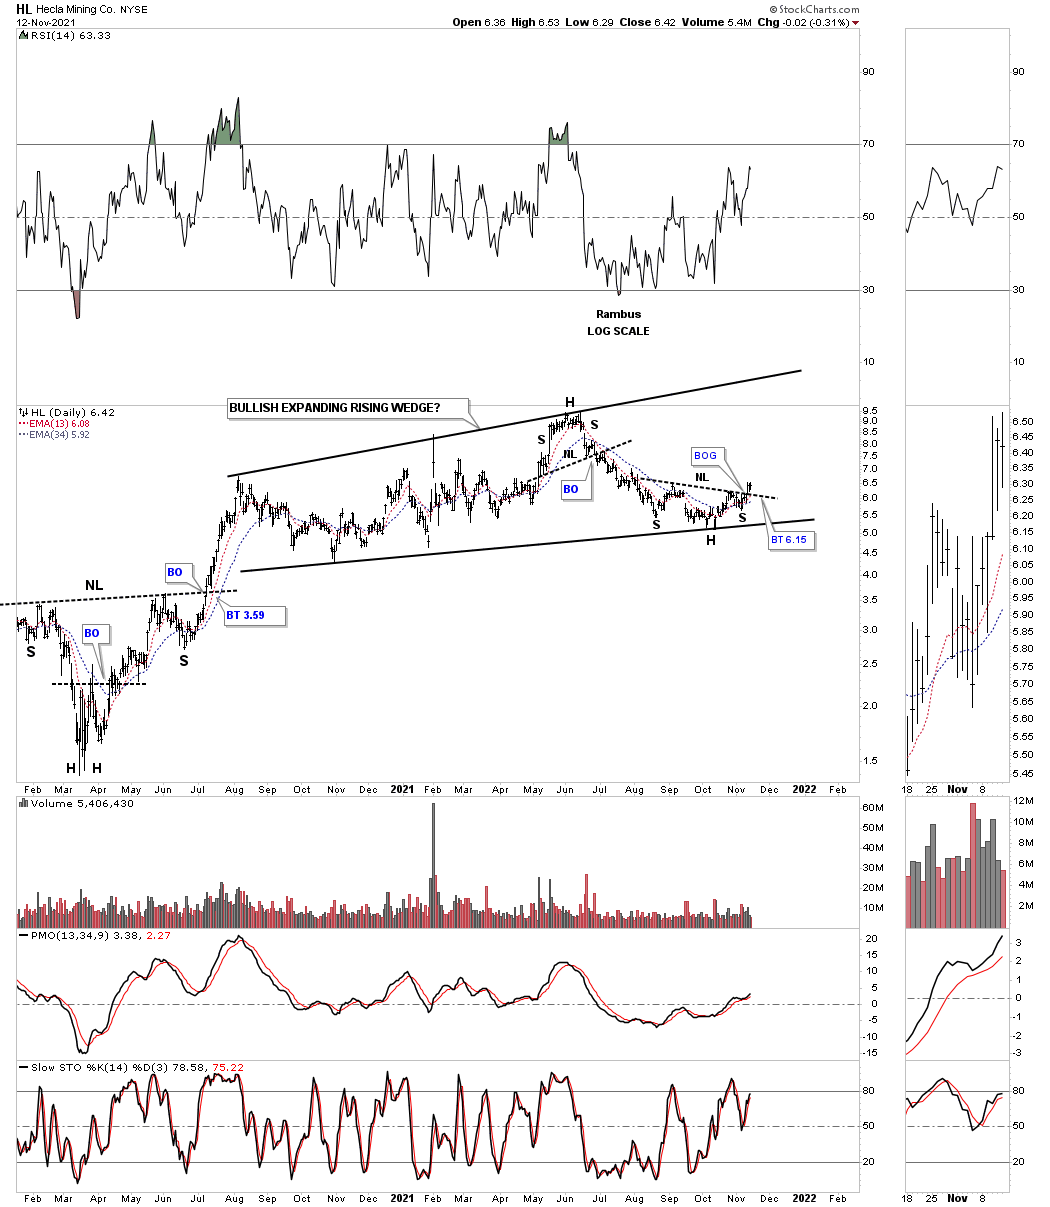
LAST WEEK: