Before we look at today’s charts I just want to make sure that everyone knows that the trades in the PM Stock Trade Portfolio are just 5% of $100,000 of the portfolio. If things work out we should have at least 20 positions overall. If you’ve been trading this sector for any length of time you know any stock can blow up overnight which is why I like to spread the risk around.
The breaking out and backtesting process is starting to look a little more clearer as most have now broken out above their neckline including GLD.
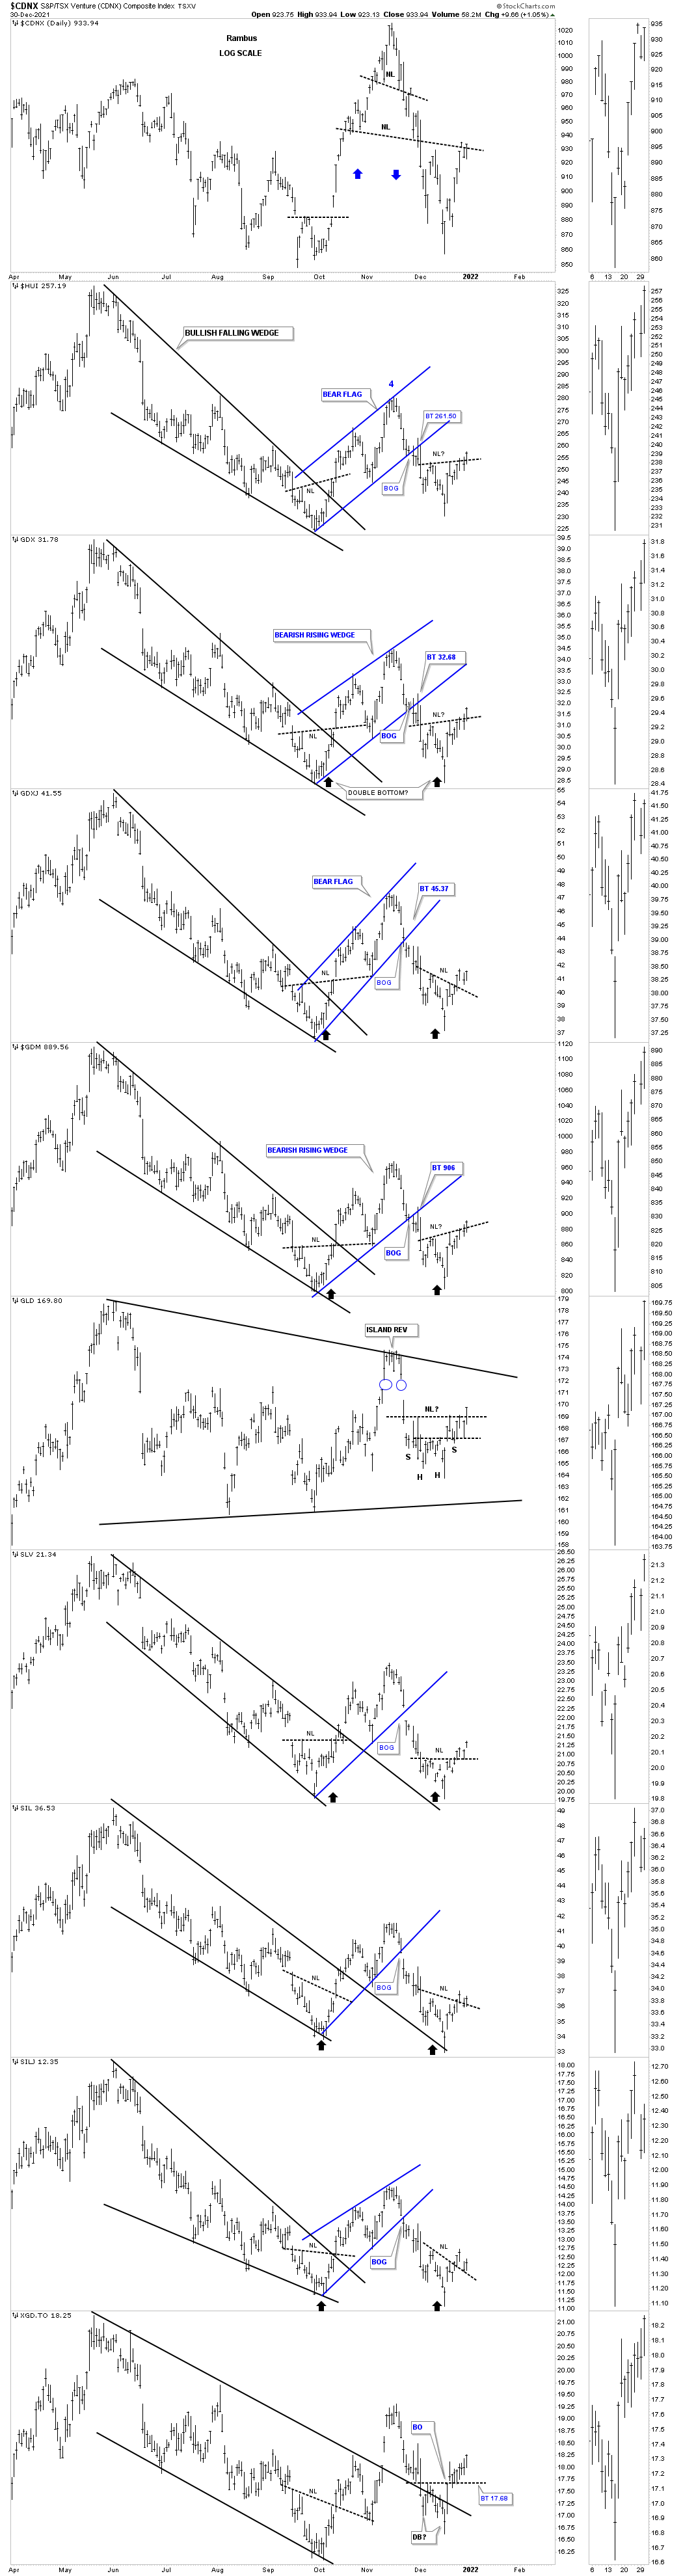
I tweaked the black dashed S&R lines just a bit on a few of the PM stock indexes to better fit the low made on the way up and the first high made above the S&R line. As you can see most of the indexes are trading above that minor high which in most cases is the right shoulder armpit on a bar chart.
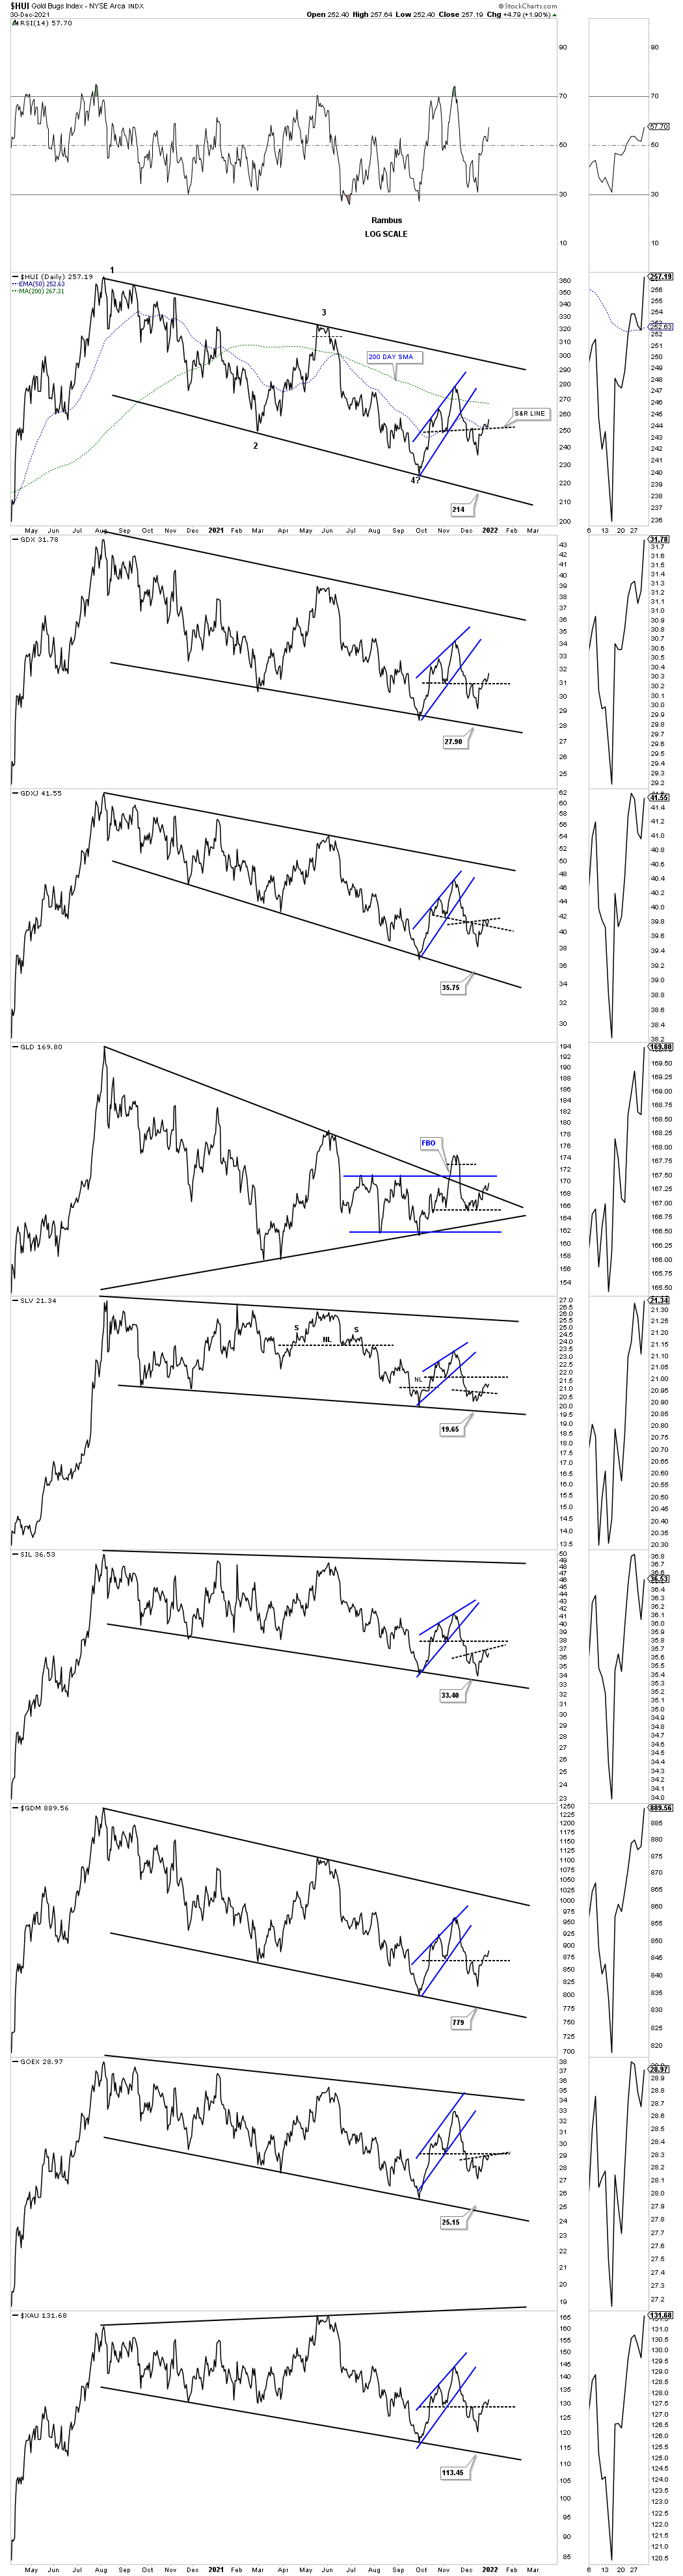
Next is a 7 month daily chart for the GDX which shows all the chart patterns created since the May high. The May high produced that small blue 5 point triangle reversal pattern that was the head of the strongly slanted H&S top. The minimum price objective was down to 34.65 just below that massive gap. There was also a H&S consolidation pattern that formed 2/3’s of the way down the downtrend channel with its own price objective close to the first low in the possible double bottom reversal pattern.
Next the GDX put in that small H&S bottom that took the GDX above the top rail of the downtrend channel to its minimum price objective at the 200 day sma. Note how the top rail of the black downtrend channel was hit on multiple occasions but never broke.The last touch of the top rail ended up being the head of our current H&S bottom with the minimum price objective up to the Island Reversal pattern.

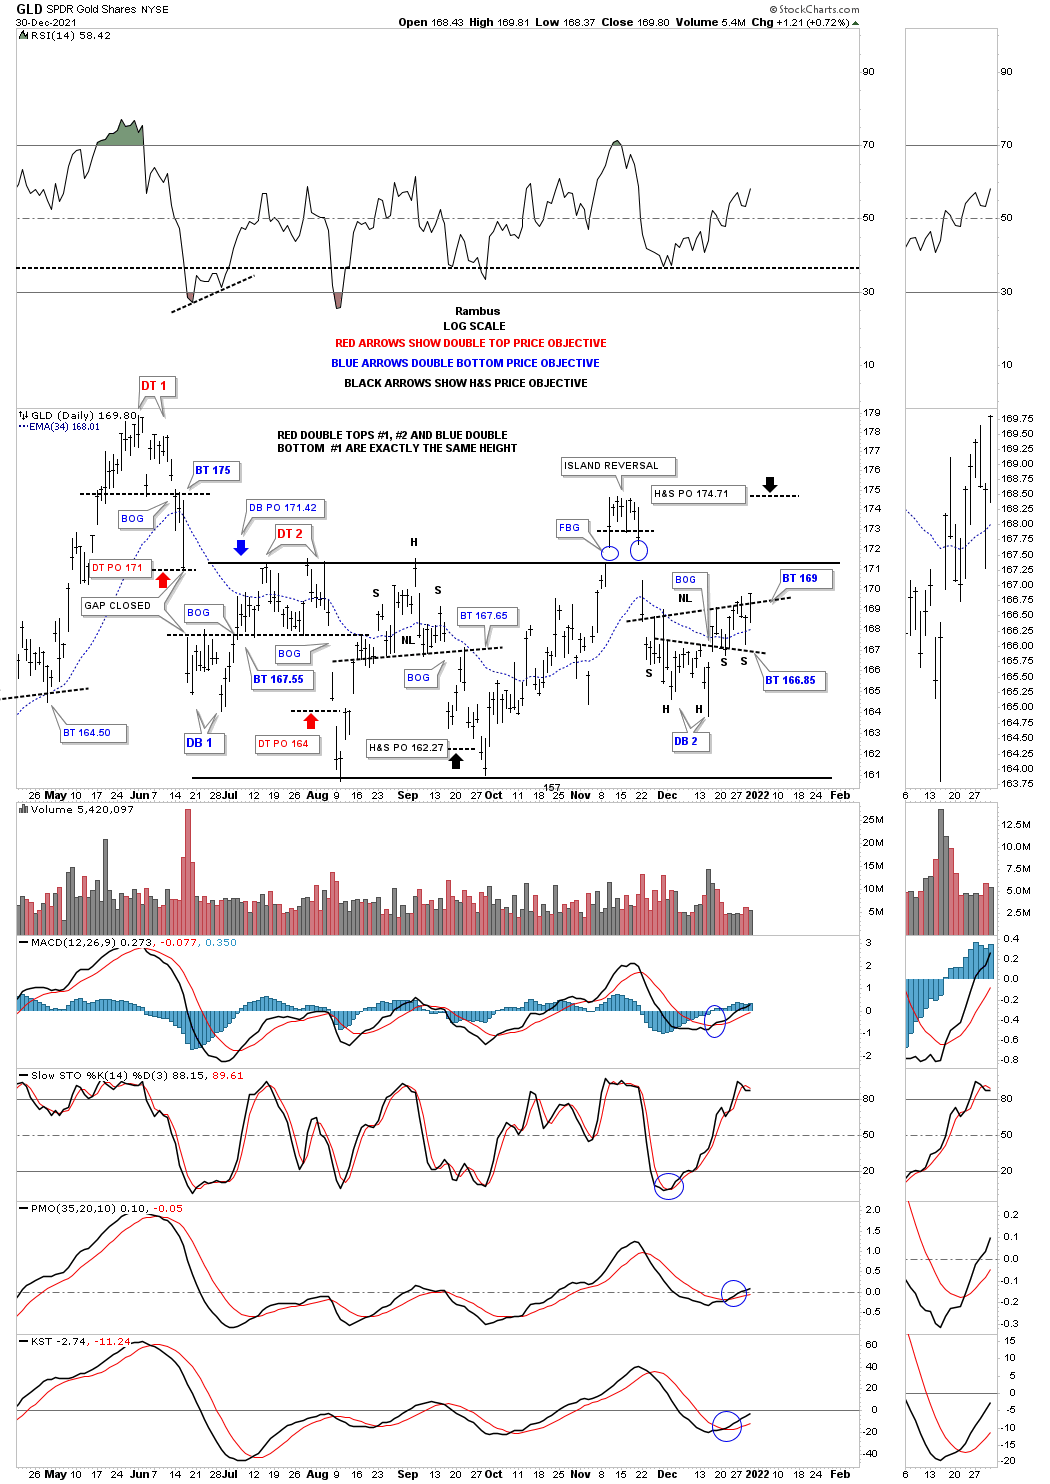
This last chart for today is daily chart for GLD which shows some very interesting chart patterns and price objectives. To keep things a little more clear I used the red annotations for the double tops and the blue annotations for the double bottom with the black arrows showing the price objectives for the H&S patterns, tops and bottoms. When I measure for a price objective I use the Fib retracement tool. The double tops and bottom is measured from the top of the double top to the double top trendline. Take that measurement and add it to the breakout point to get your minimum price objective, red arrows for tops and blue arrow for the double bottom.
What is interesting is the the double tops and double bottom are the same exact height. Note how the huge gap made on the way down off double top #1 was filled almost exactly after the double bottom price objective was met, blue arrow. The right side of the chart shows our current double headed H&S bottom which is strongly suggesting the top black horizontal rail is going to give way as the H&S bottom has a price objective up to the Island Reversal.
One more day to go for the end of the year results tomorrow. All the best…Rambus