I’ve been a little under the weather this week so this Weekend Report will be a little on the short side.
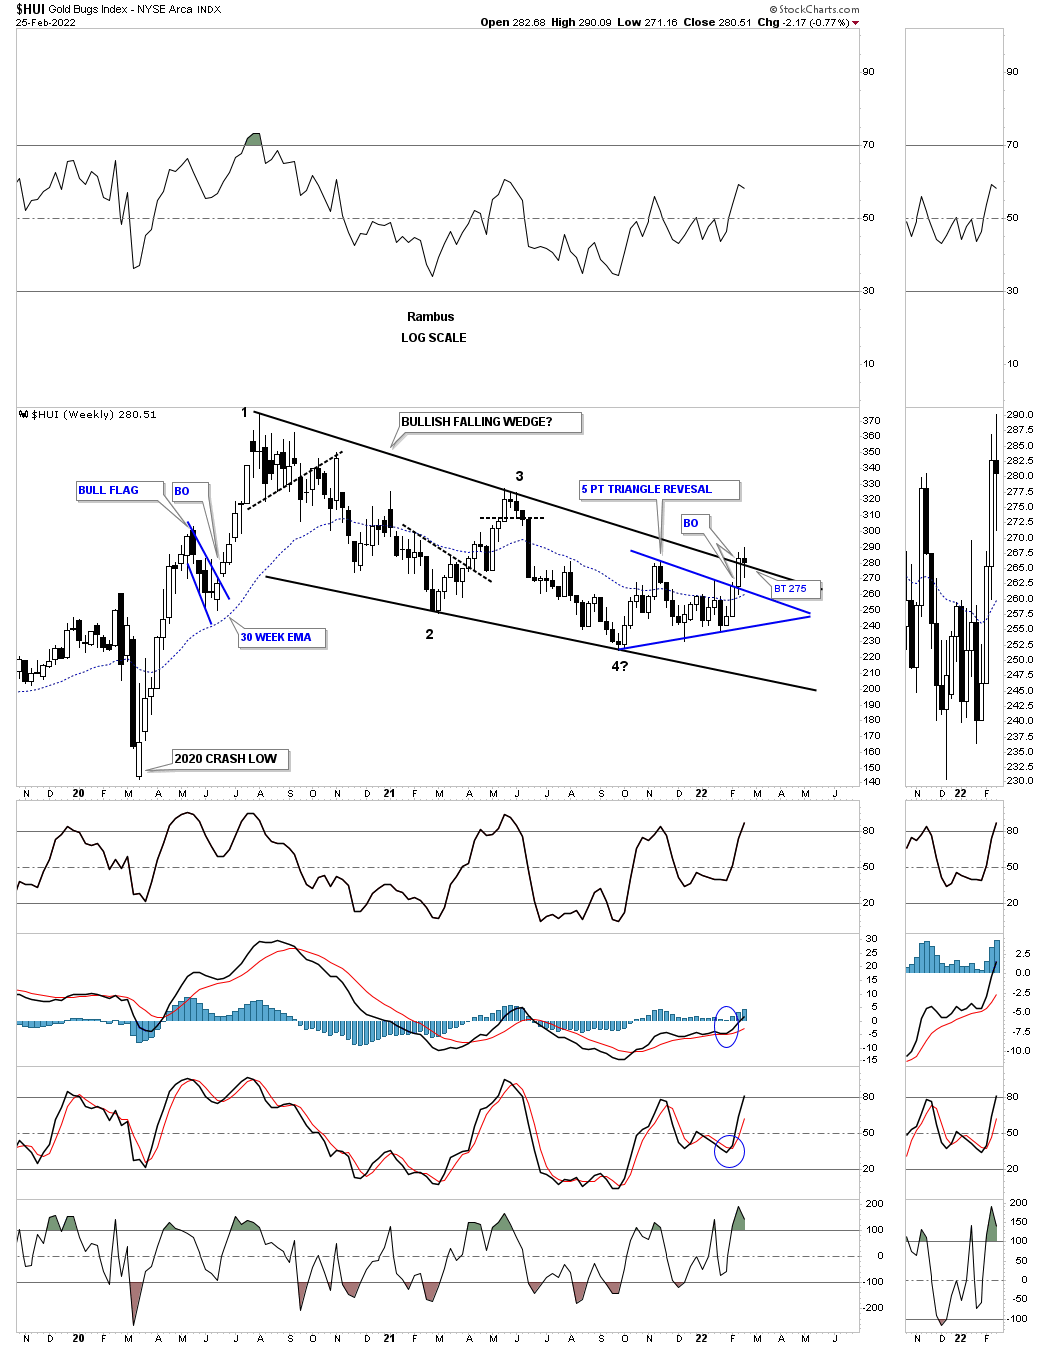
First lets recap where the HUI is now vs two years ago at the March 2020 crash low. In some respects a lot has happened and on the other hand not a lot has happened. A lot happened during that very strong impulse move out of the 2020 crash low as shown by all the white candlesticks all in a row. There was also a nice bull flag that formed about in the middle of the impulse move up to the August 2020 high.
After the August 2020 high was in place not much happened for the bulls until the October 2021 low which ended up being the 4th reversal point in the 2020 bullish falling wedge and the first reversal point in the blue 5 point triangle reversal pattern. The HUI is now in the process of breaking out from the 2020 bullish falling wedge which will lead to a lot happening once again.
Keep in mind that the 18 month bullish falling wedge is typical in a bull market. Sometimes they can be smaller or bigger but after a strong impulse you have to expect some type of trading range to form. It isn’t any fun when these consolidation patterns form but if you are aware of the possibility you can trade accordingly by not overstaying your welcome if you go long somewhere during the consolidation phase. Cut your losses quickly and wait for the next setup.
The main point is to have as much capital available as possible when the correction finally runs its course and the next big impulse move up begins. Most investors that made nice gains if they got in early enough during the March 2020 crash low gave most of it back and then some during the 18 month correction, sound familiar?
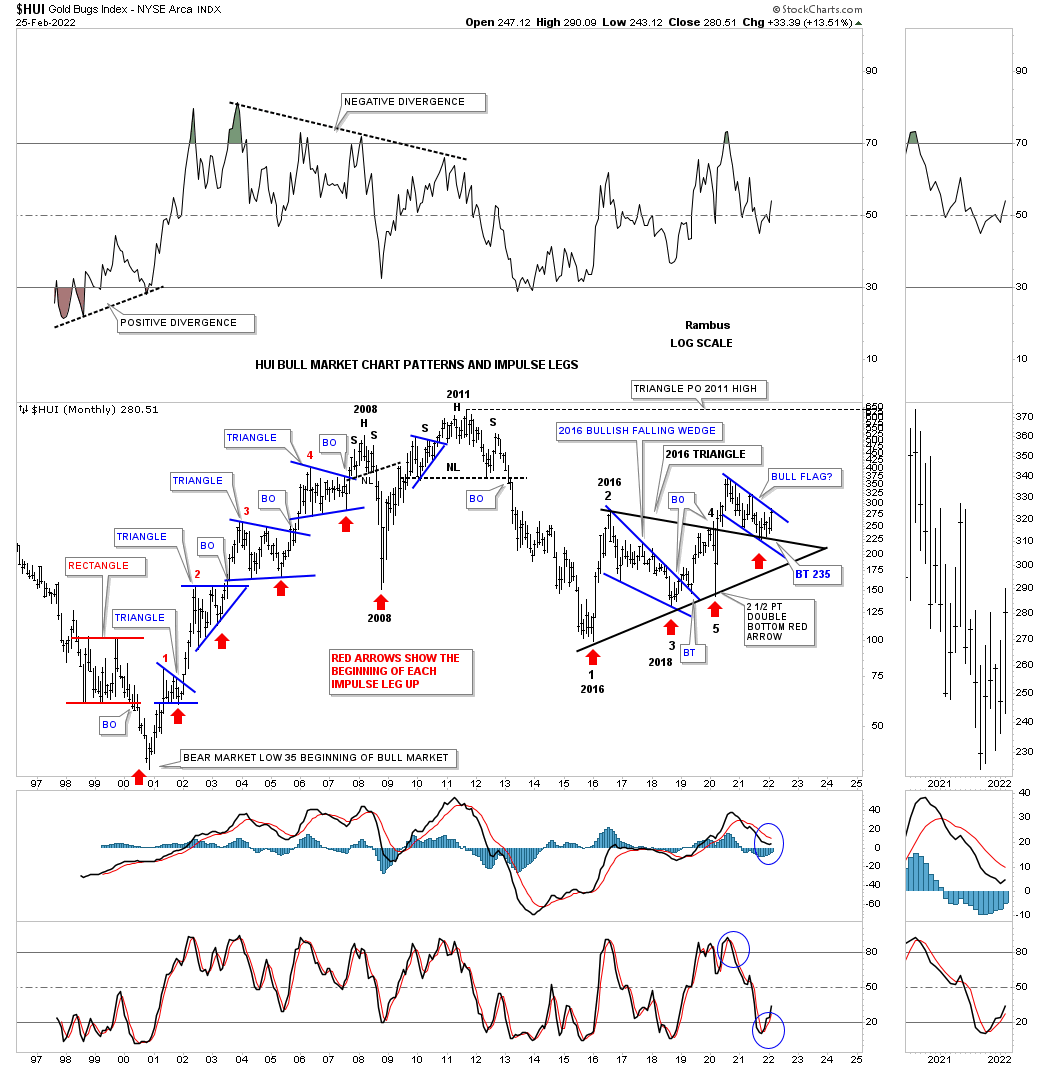
This next chart for the HUI is a long term monthly chart which shows most of its history. This chart shows you a good example of the three phases a stock can be in. One phase is the consolidation phase that forms after a consolidation or reversal phase. The 2nd phase a stock can be in is the impulse move between a consolidation phase or a reversal phase. The last phase is the reversal phase which reverses the previous impulse move. This is why it is so important to know what phase a stock is trading in before you decided to buy, sell or ride the impulse move.
The red arrows show where the actual impulse move begins which is the last reversal point in either a consolidation or reversal pattern. Looking at the black 5 point triangle reversal pattern how many remember that 2016 bullish falling wedge that seemed like it would never end? When the top rail was finally broken to the upside and the backtest was completed that was a very bullish development at the time. Then came the March 2020 crash which setup the 4th and 5th reversal points. Since that triangle was forming below the all time highs we needed to see some type of reversal pattern form which could have been a variety of different reversal patterns but we ended up with a 5 point triangle reversal pattern.
Similar to the 2016 bullish falling wedge the backtest to the top rail of the 5 point triangle took the formation of the blue flag which again in big patterns everything is big including the breaking out and backtesting process. So from the current perspective nothing looks bearish but bullish. If the HUI were to trade back below the top rail of that 5 point triangle reversal pattern then I would be wrong but until that happens the bulls are in charge even though it may not seem like it at times.
Many investors don’t like to look at long term charts but I find them fascinating from a Chartology perspective because they can show you so much information that you will never see on shorter term charts.
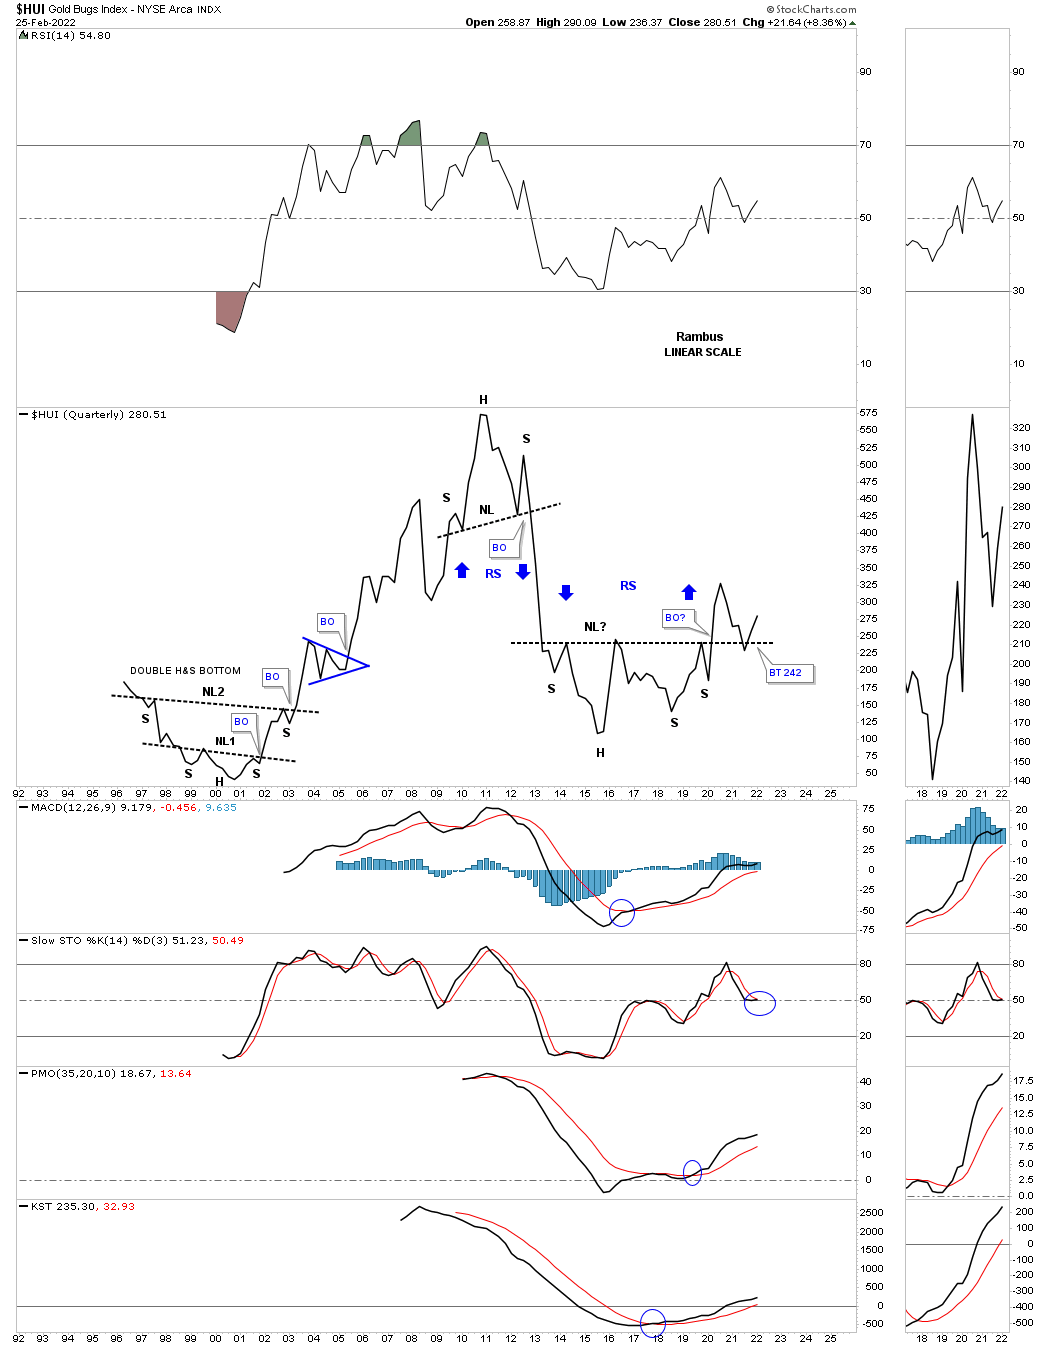
One of my favorite long term charts for the PM complex is the quarterly line chart. These charts do a great job of showing you the big trading ranges and where you might look for important breakouts and backtests points to the big patterns. Keep in mind a line chart can often times shows you the breakout before a bar chart does.
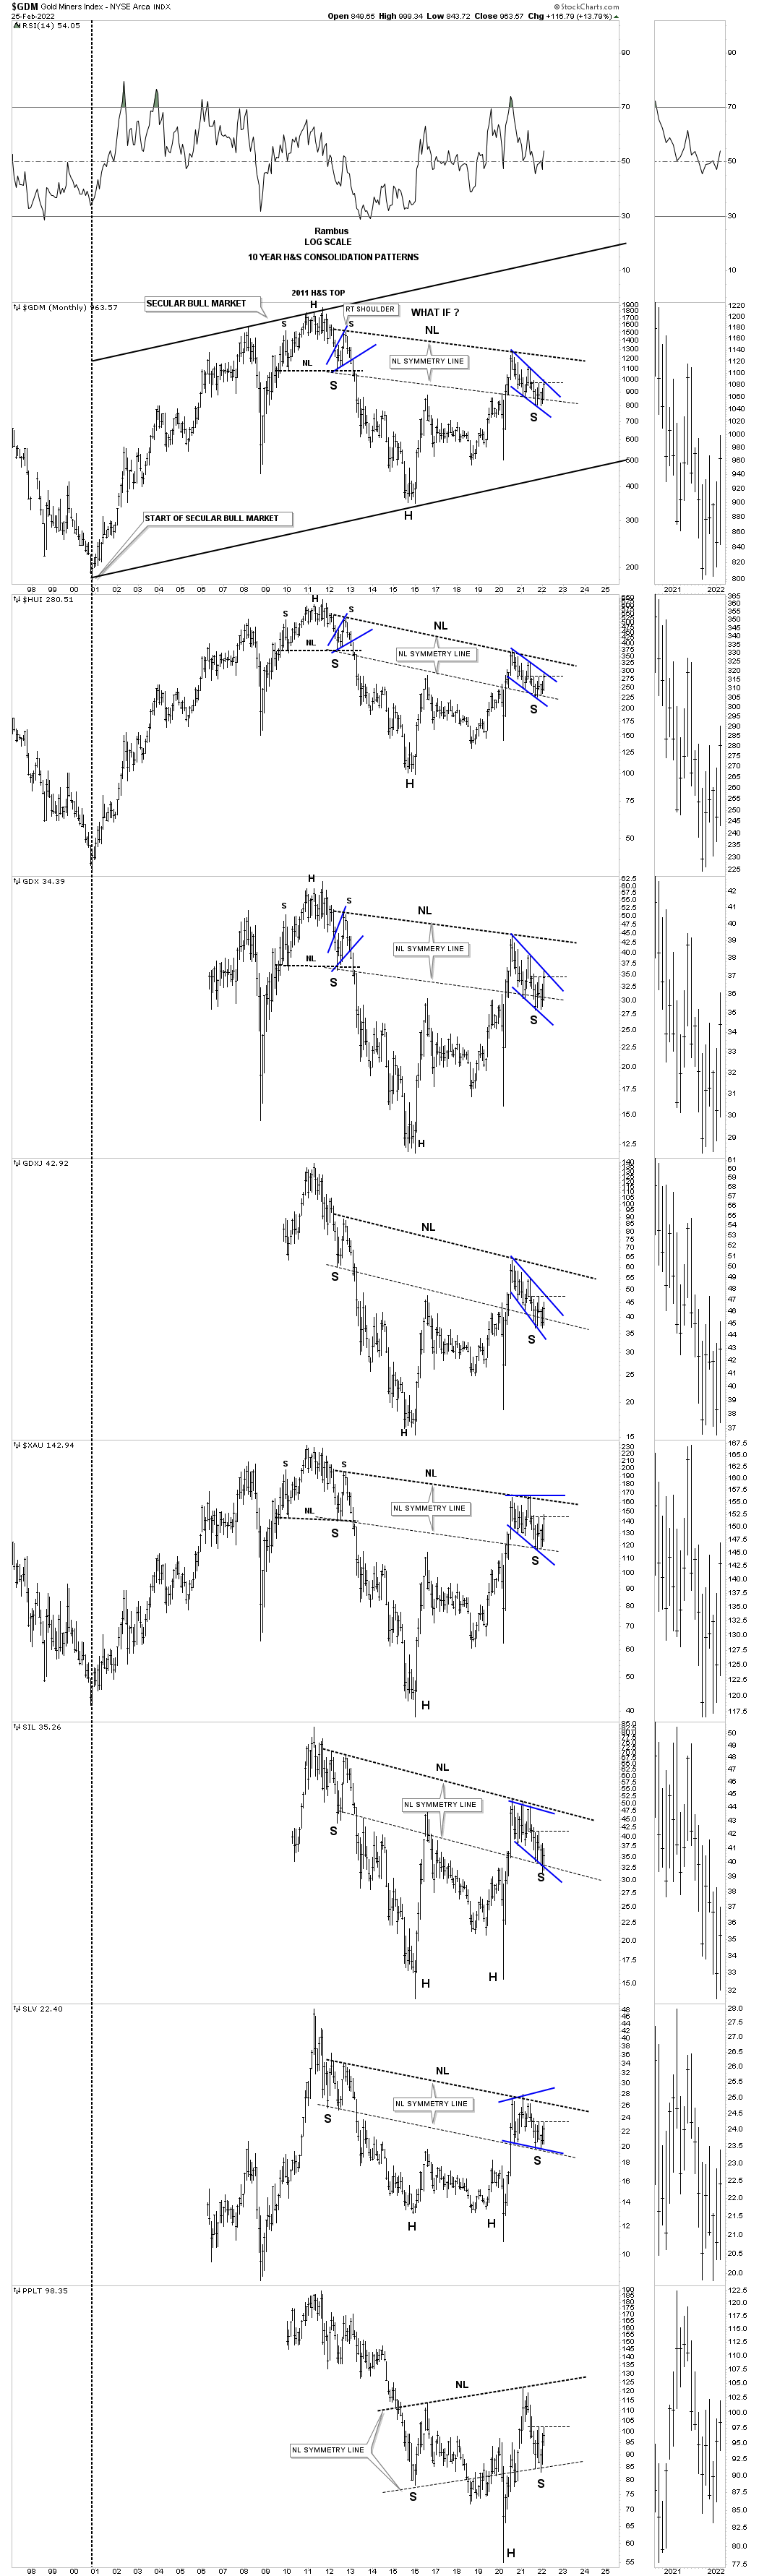
Keeping that in mind note the massive H&S bottom that has been forming since the right shoulder low in 2013 complete with the breakout and backtest already in place. This is the exact same H&S bottom that I’ve been showing you on the monthly combo chart which shows all of the PM stock indexes that are making those massive H&S bottoms which still haven’t broken out yet on the monthly bar chart.
The odds are very high IMHO that we are already in the early stages of the next major impulse move that has begun on the backtest to the neckline around the 242 area. This impulse move could be particularly strong because of the possible reverse symmetry to the upside as shown by the blue arrows. You can see how well it worked out during the beginning of the bear market to the downside.
This last chart for tonight is the monthly combo chart which I’ve been showing you with all the H&S bottoms forming. The quarterly line chart above already shows the breakout and backtest completed vs the monthly bar chart below. What if you were aware of the quarterly line chart above back at the 2011 all time high or the beginning of the bull market in 2000? You are now aware of the quarterly line chart in 2022. All the best…Rambus