Last week I mentioned that it might be time for the PM stocks to start consolidating their gains from the last reversal point in the blue 5 point triangle reversal patterns. It looks like it has now started after last weeks high.
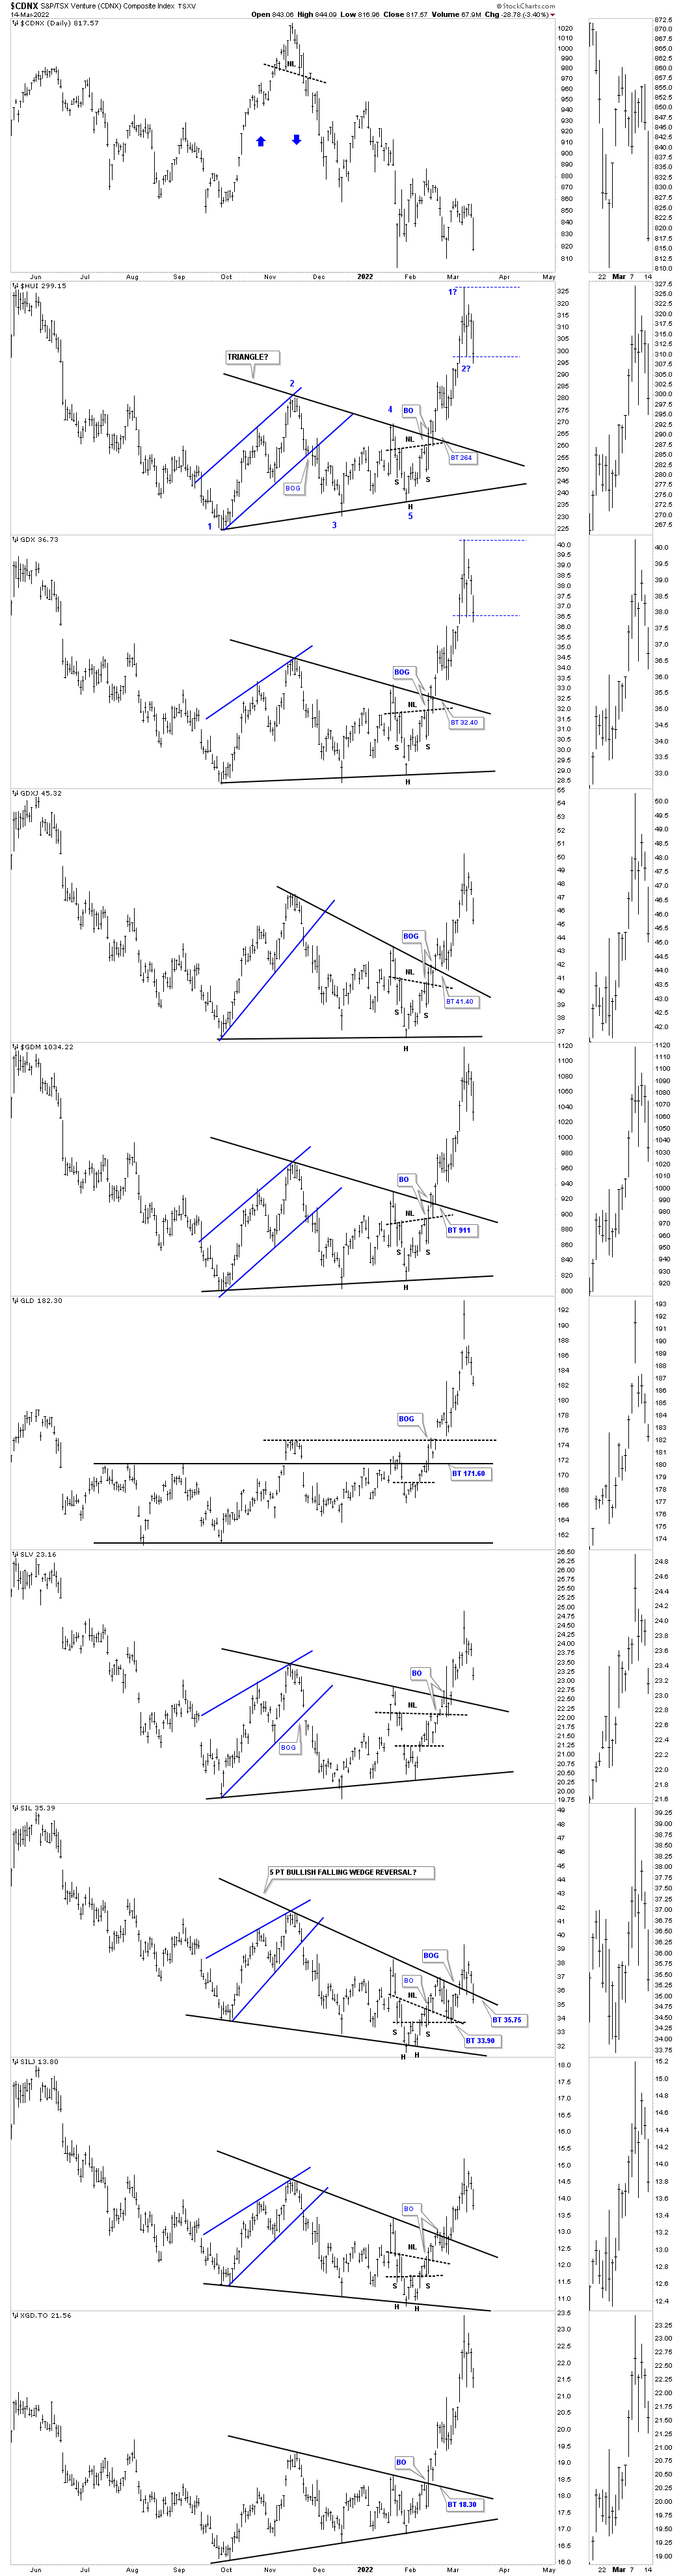
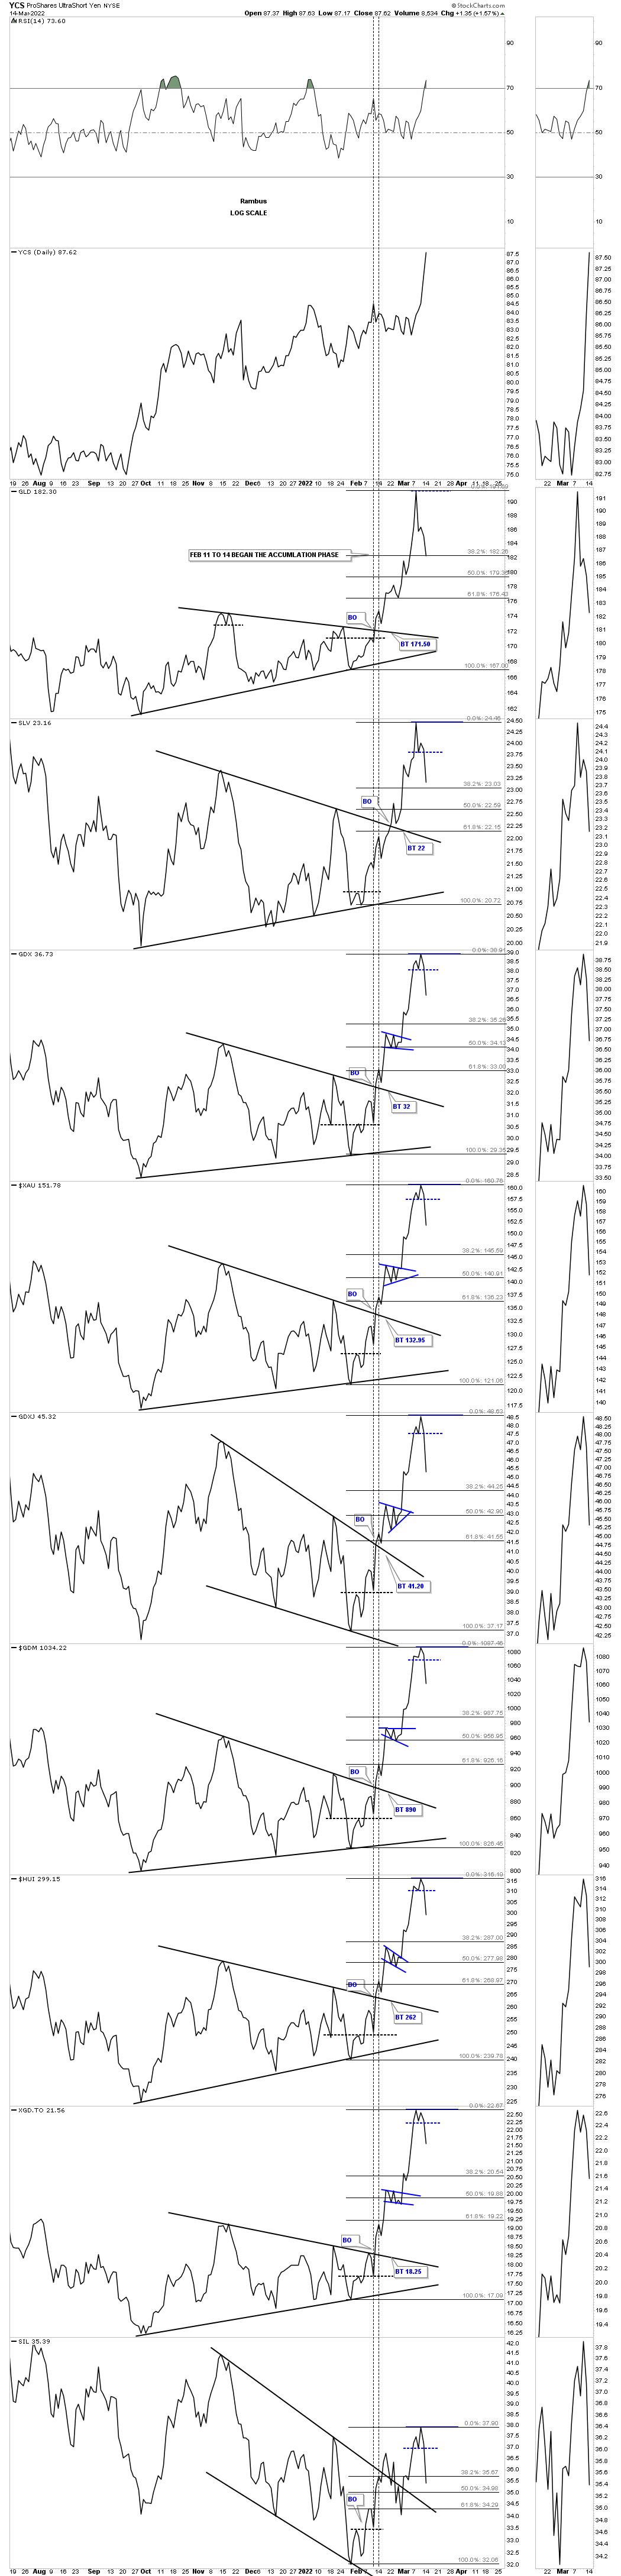
Next is the daily line chart which shows today’s move lower left a small double top suggesting the consolidation phase is beginning. I also added the Fib retracements to get a feel for where reversal point #2 may show up with the recent high being reversal point #1.
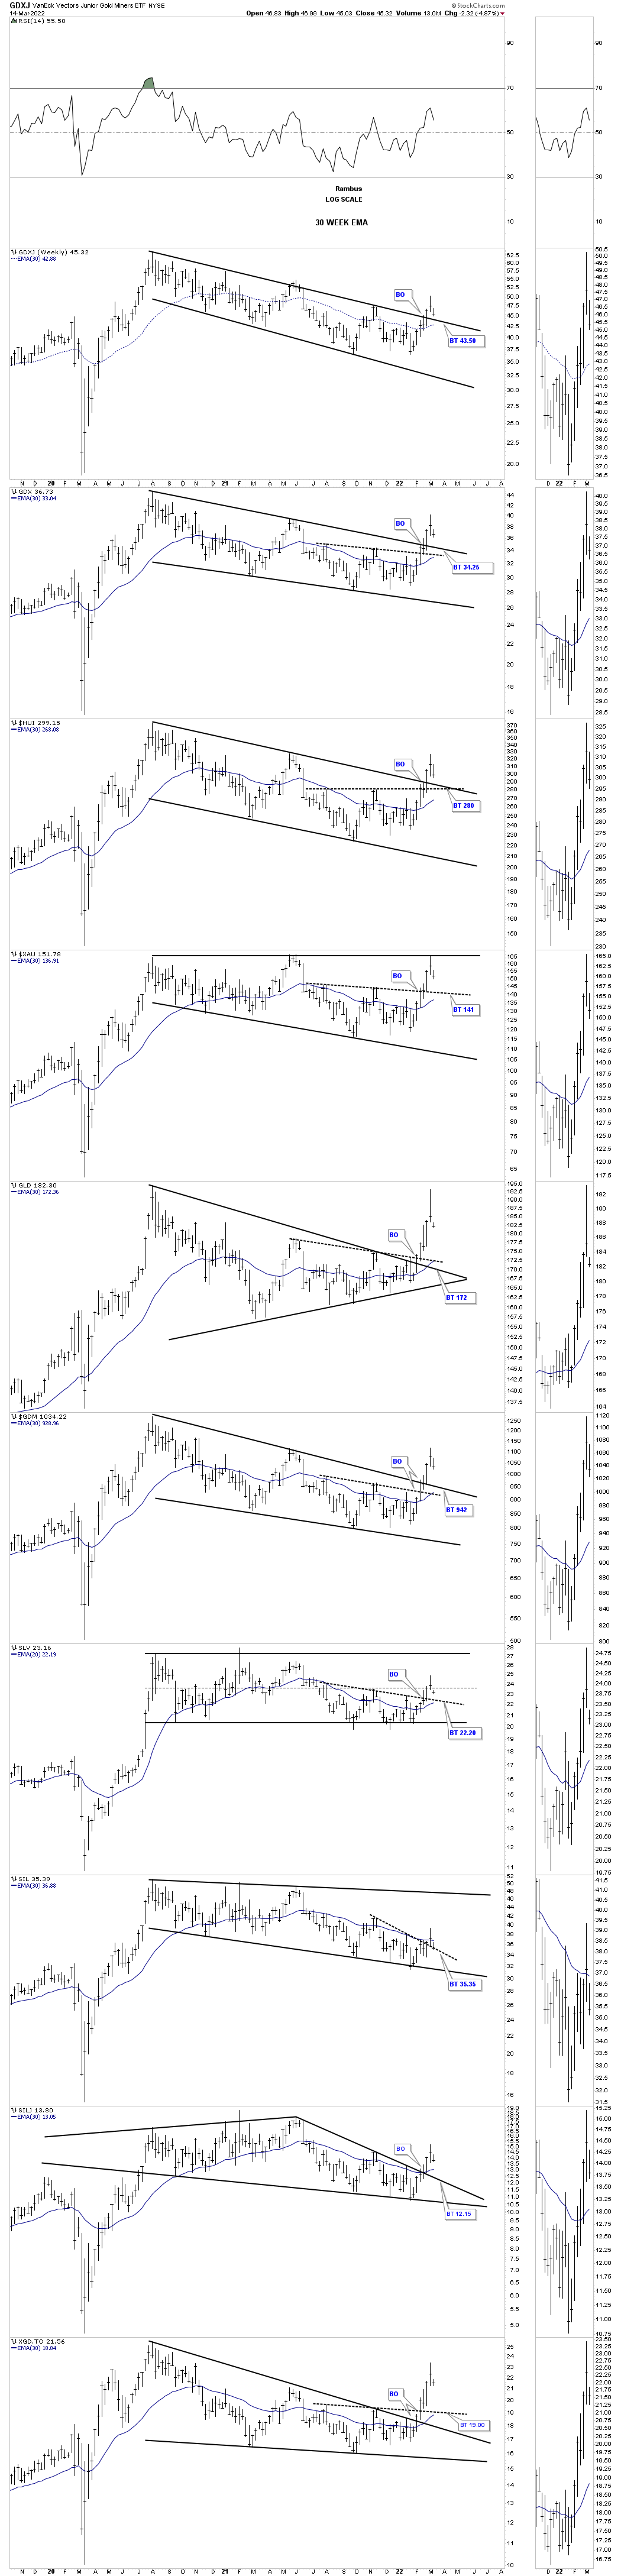
I also mentioned last week that we shouldn’t be surprised to see a backtest to the top rail of the August 2020 trading range. This weekly chart shows three areas to look for possible support. First is the top rail of the 2020 trading range. Second is the black dashed S&R line with the 3rd area being the 30 week ema.
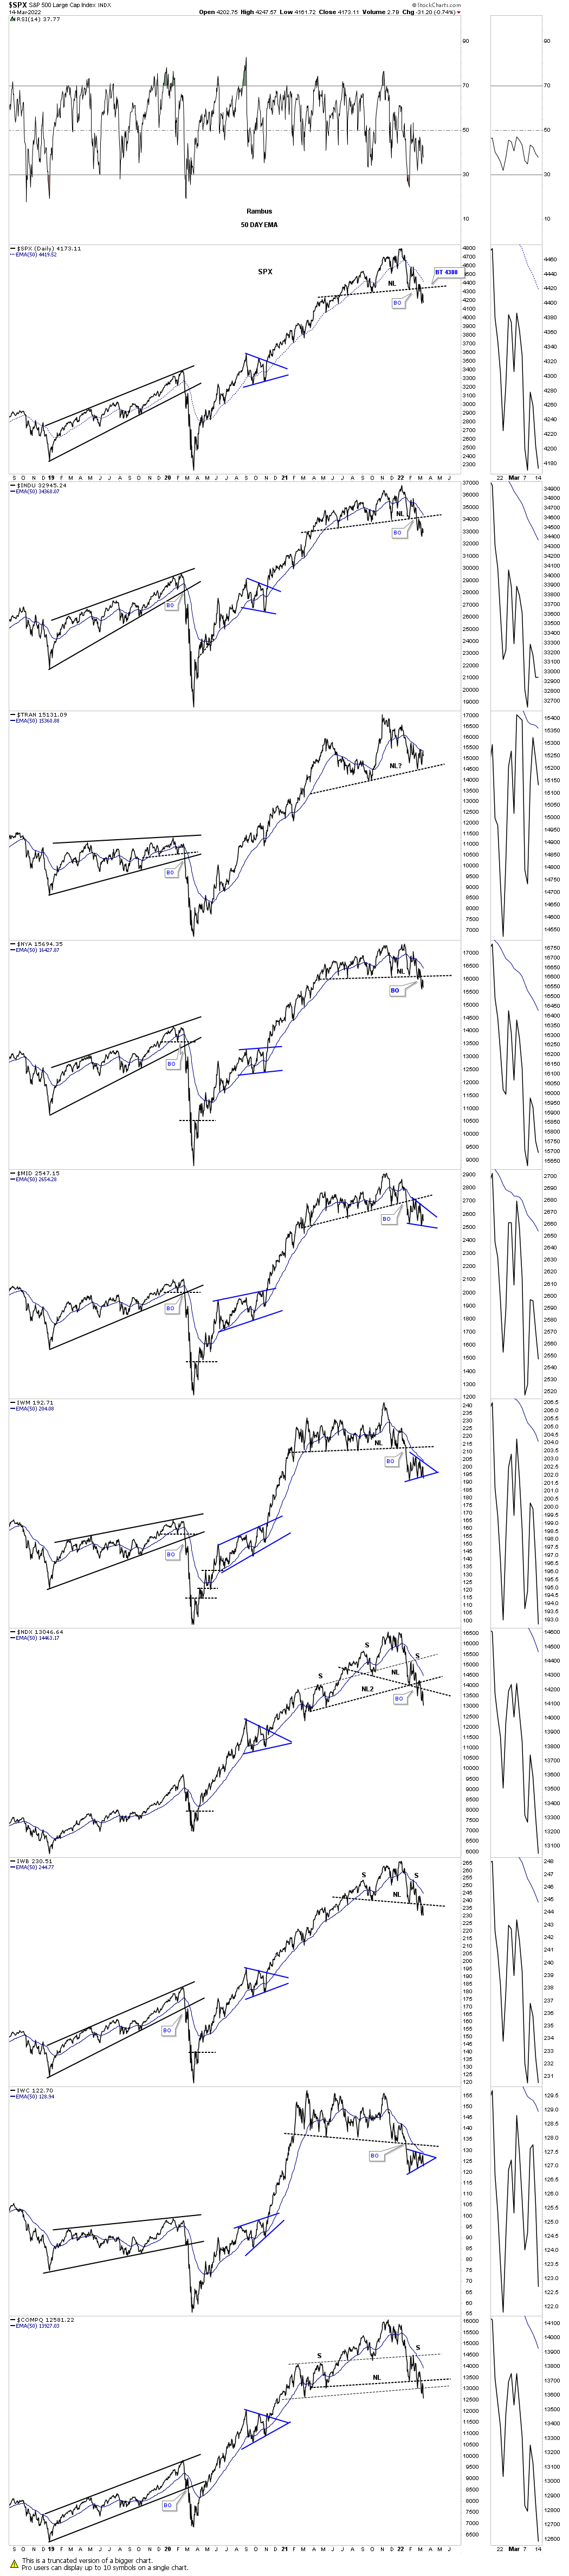
This short term daily line chart for the US stock markets show the H&S tops which are trying to finish up the backtesting process. The IWM is attempting to breakout from its blue triangle which will either be a halfway pattern to the downside or if things get really nasty it could be the first of several consolidation patterns that create the impulse move lower. Several of the indexes are showing a lower low which is what we want to see to help confirm the new downtrend.
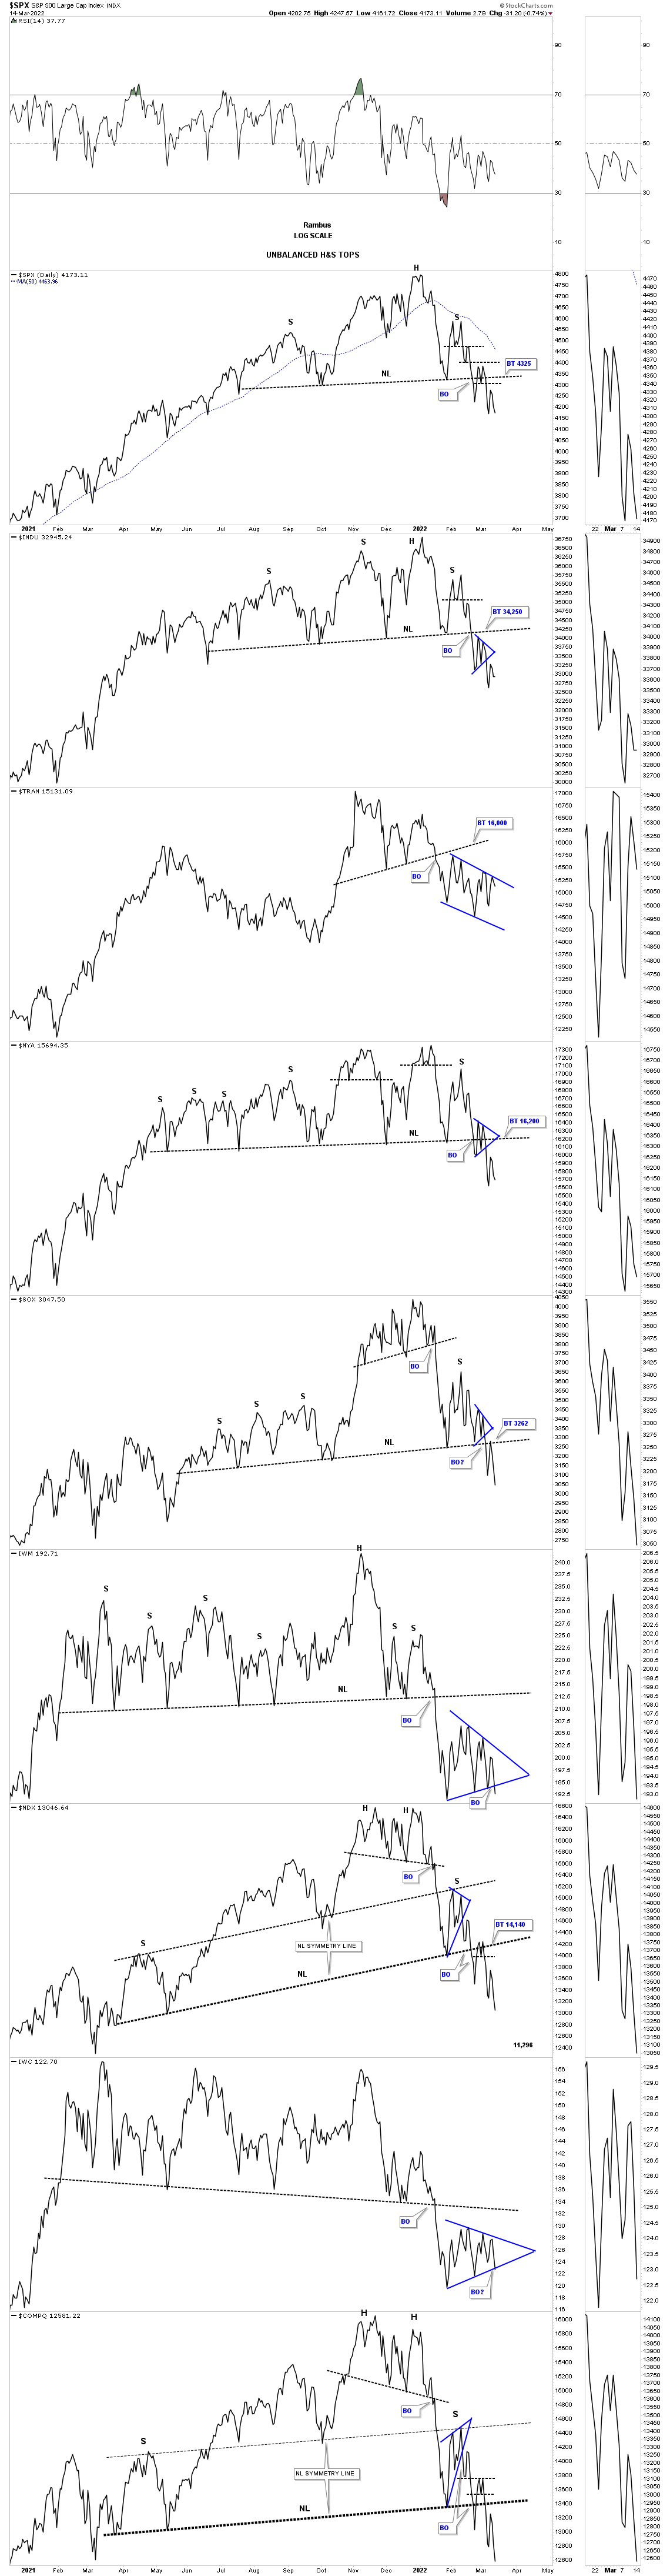
This last chart for today is the longer term daily line chart. What stands out the most for me is the rally leading into the H&S tops. If there was ever a place to look for some reverse symmetry to the downside these charts show that possibility. One step at a time. All the best…Rambus