
We got a little more follow through to the upside in the PM complex today. Not a very exciting day but that is good. You don’t want everyone jumping in at the bottom. The indexes with the H&S and double bottoms are still looking the best. The GDXJ and SLV which have been leading the way higher are now approaching their first real test of resistance which is at the neckline where we may see some hesitation.
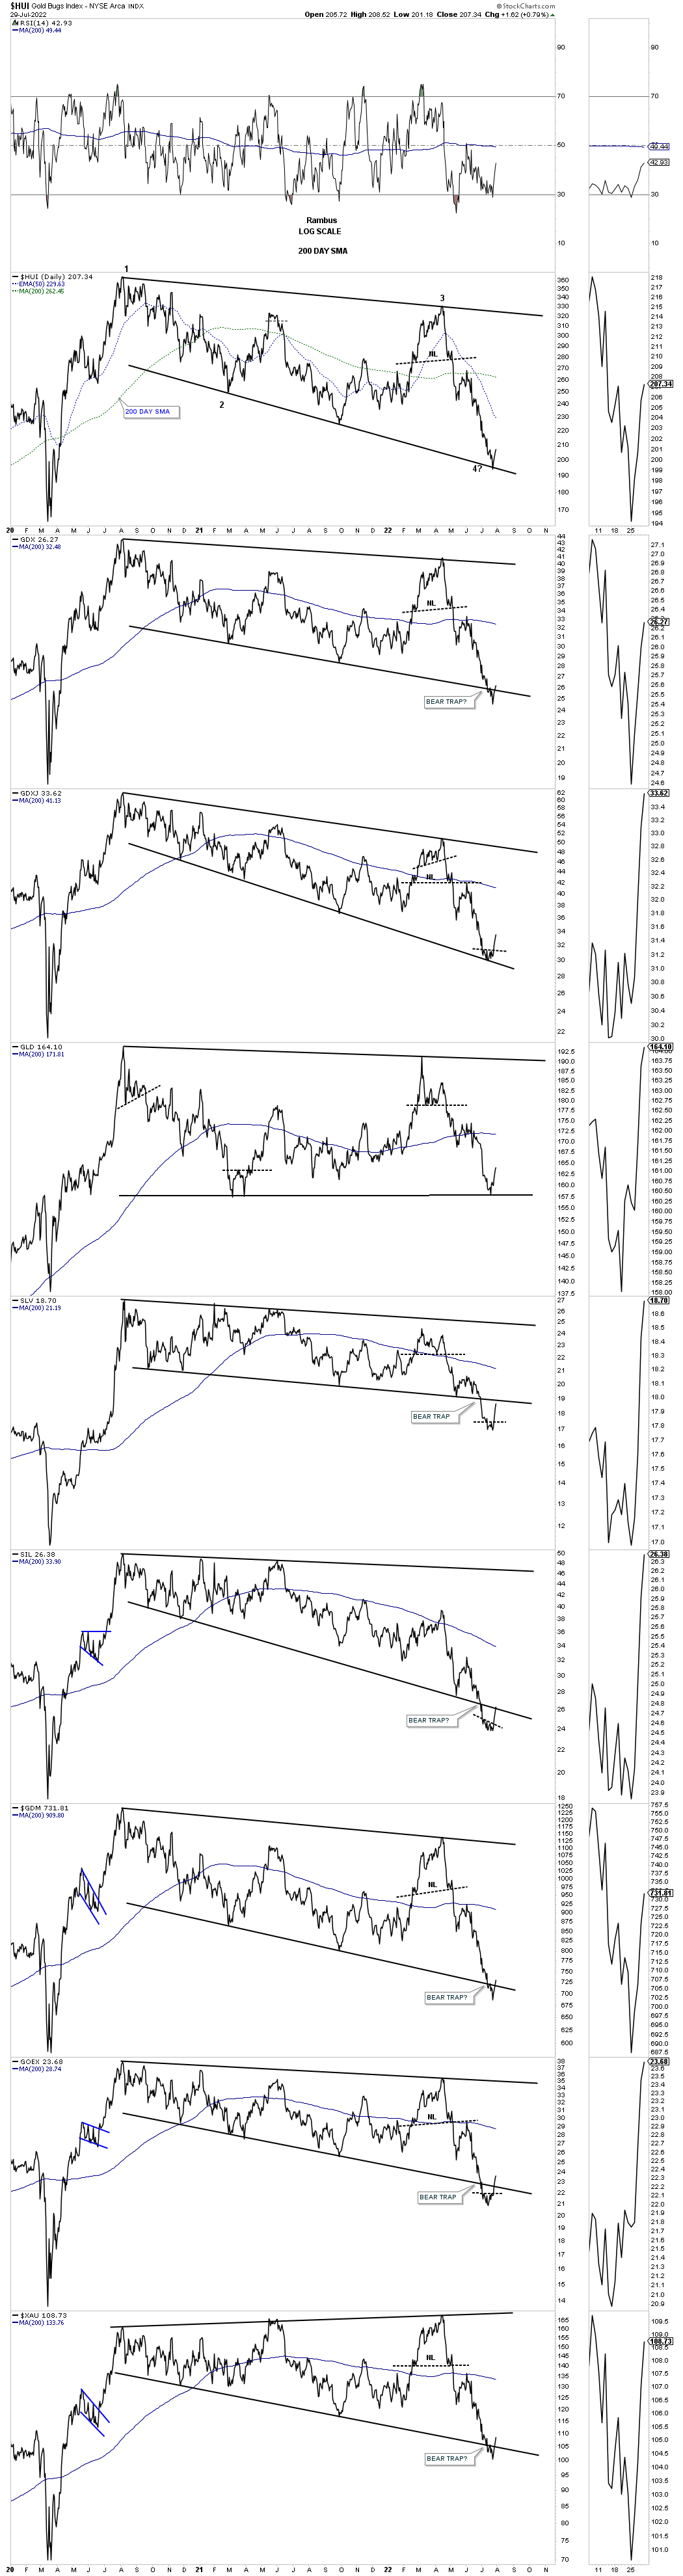
Below is the daily combo chart which shows the 2020 trading range with the possible bear traps on the false breakout below the bottom rail. What don’t want to see now is for the price action trade back below the bottom trendline. You can see the Silver area, SLV and SLI are very close to testing overhead resistance.
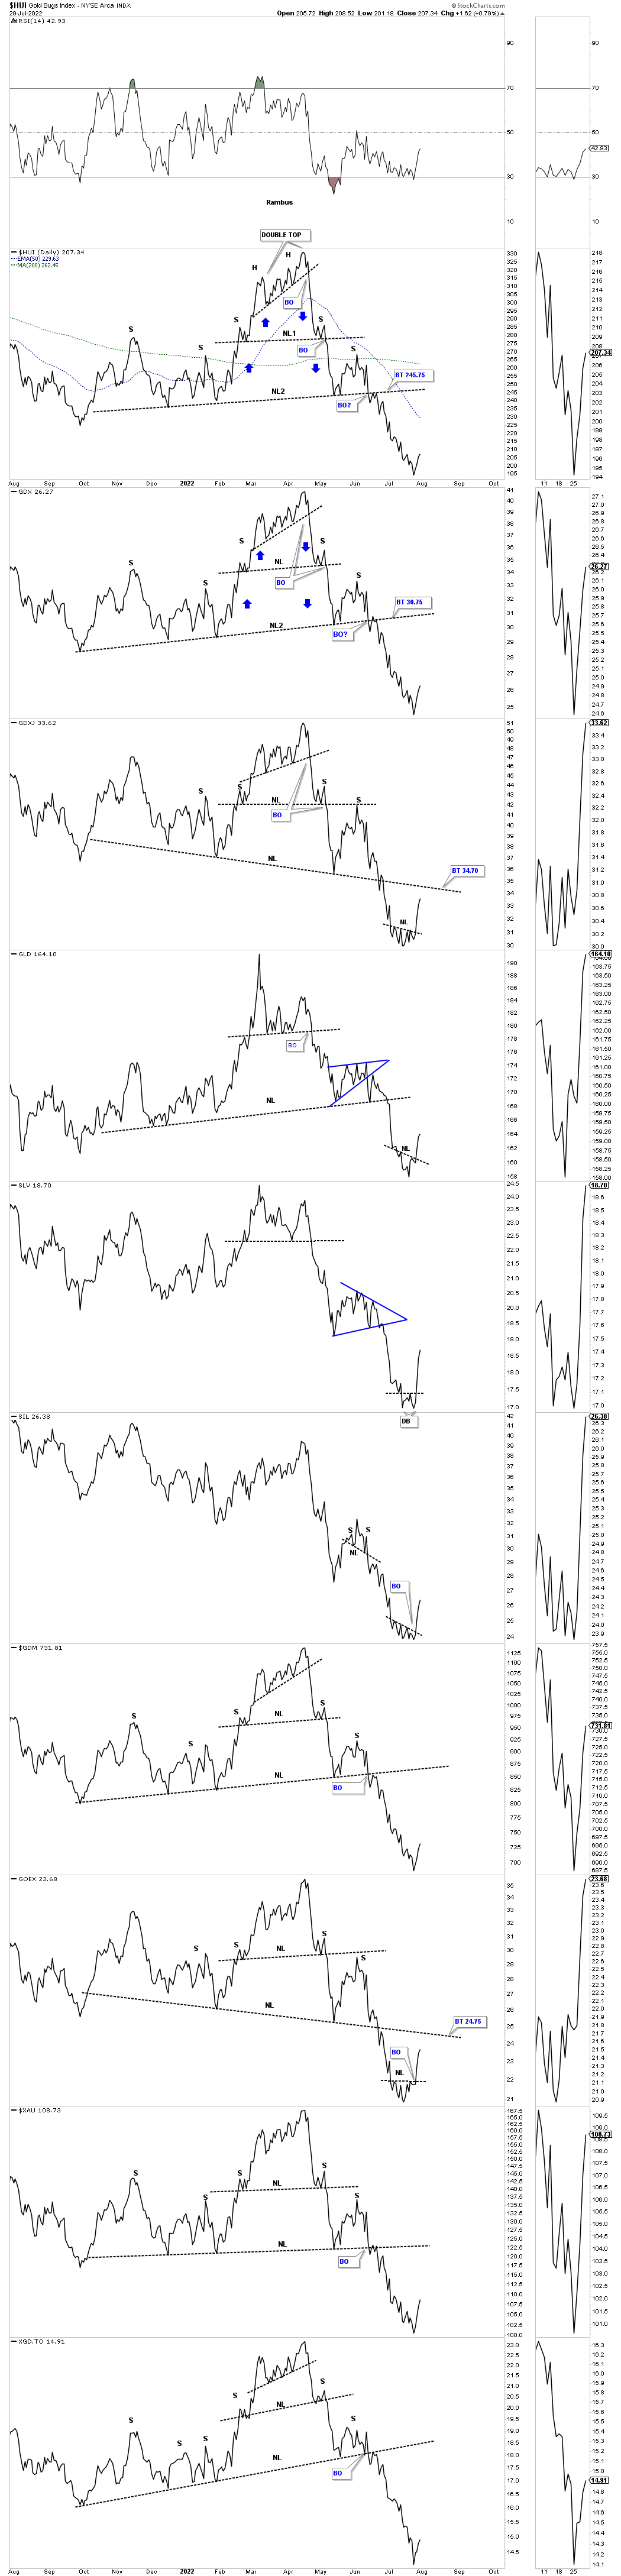
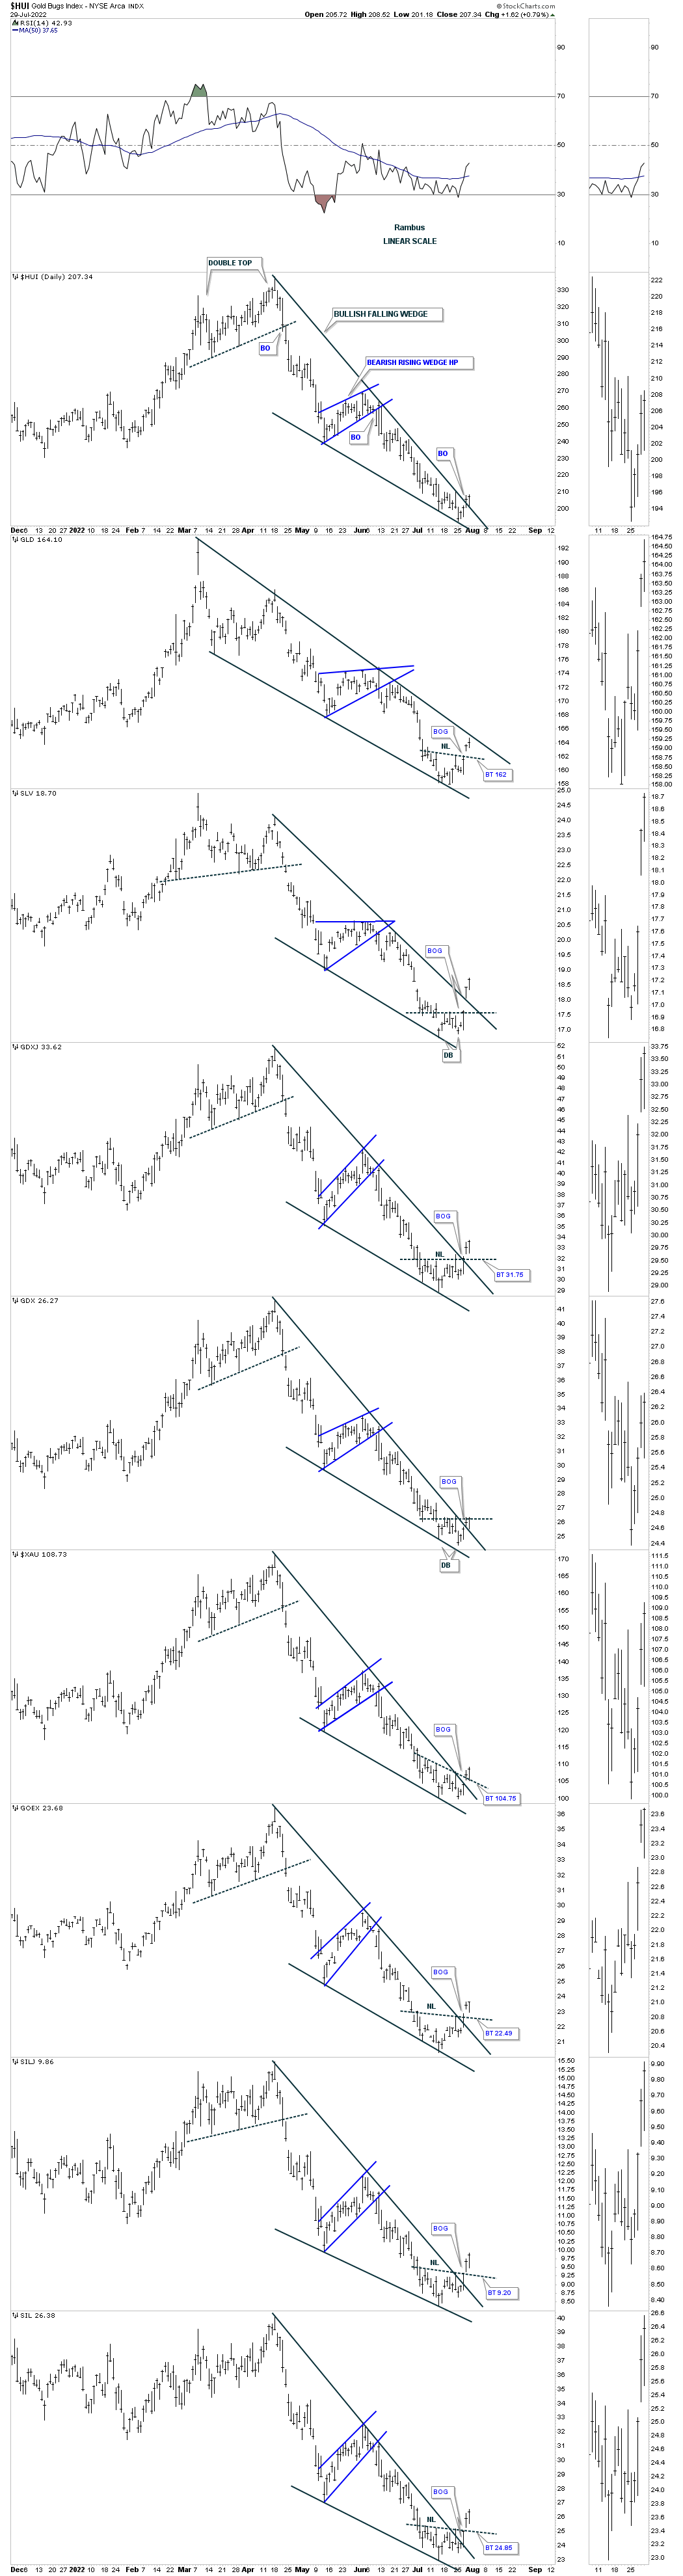
This next combo chart is the most important chart to follow on a daily basis for now. So far the Chartology has been playing out as expected with the small reversal patterns and the top rail of the falling wedge being broken. The weaker indexes are the HUI and the GDX. The XAU had a nice backtest today which held support. It is possible that these small H&S bottoms could end up being the head of a bigger H&S bottom. If that ends up being the case then the low is still in place.
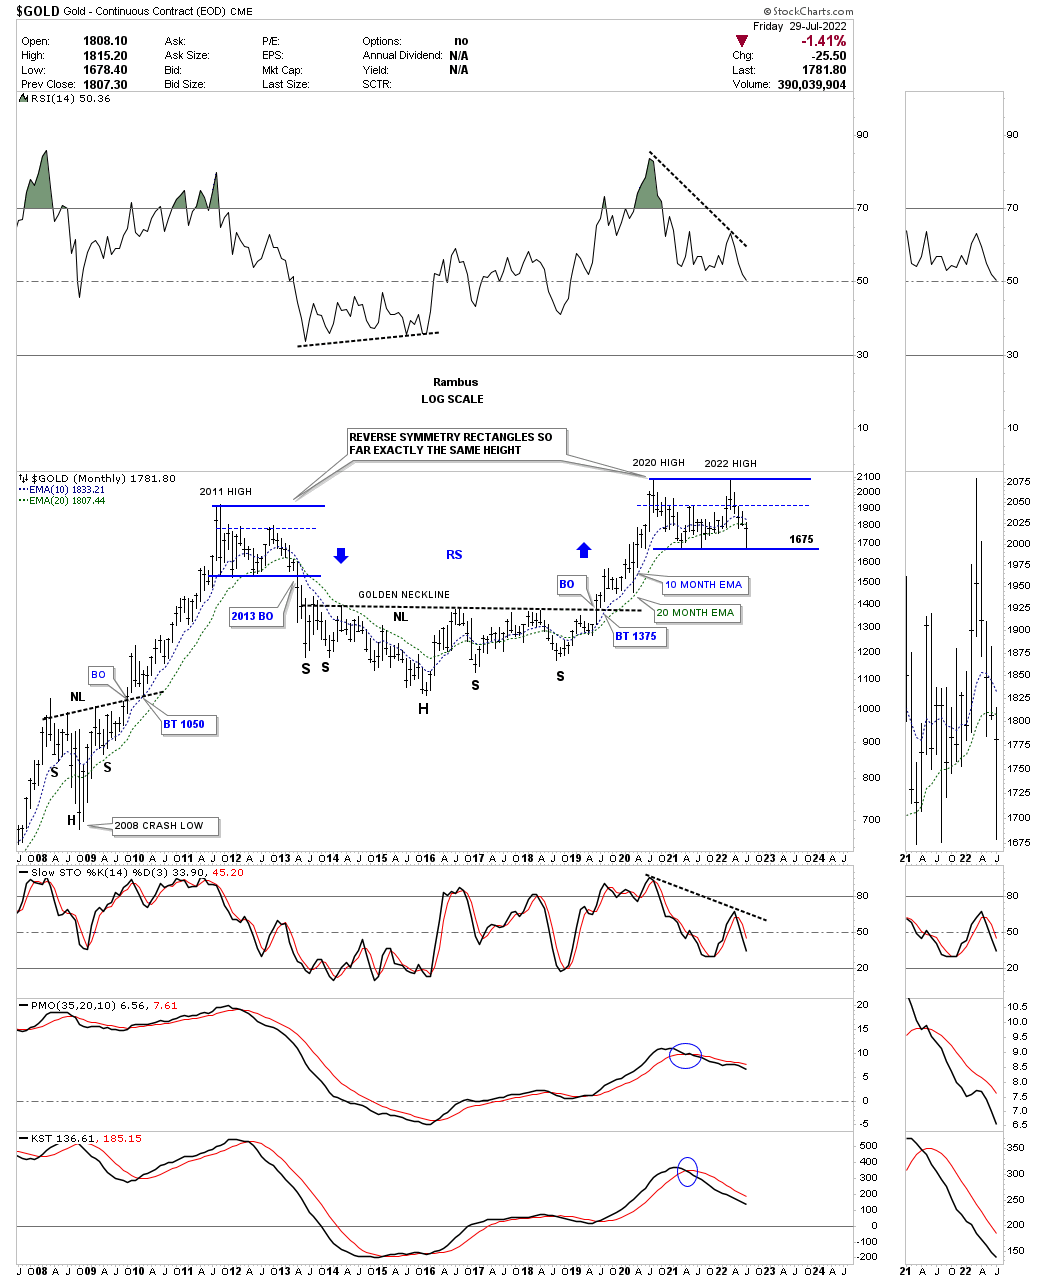
I mentioned that when Gold was testing the bottom of its 2020 trading that we should expect to see a bounce initially even if the bottom failed to hold support. We have gotten the bounce, now the 10 and 20 month ema’s are coming into focus which is the one negative I can see for Gold.
It is also possible we could see a double bottom similar to the last time Gold was trading down to the bottom trendline. On the other hand if this is the start of the next important impulse leg up Gold could go straight up leaving investors behind that were looking for a better entry. The point is we don’t know how this is going to play out only that we are seeing the small H&S reversal pattern forming on the bottom rail. No guts no glory.
The US stock markets continue to move upward off the last reversal point in the expanding falling wedge. The IWM and the IWC are now strongly testing the top rail of their expanding falling wedge and their 30 week ema along with several other indexes.
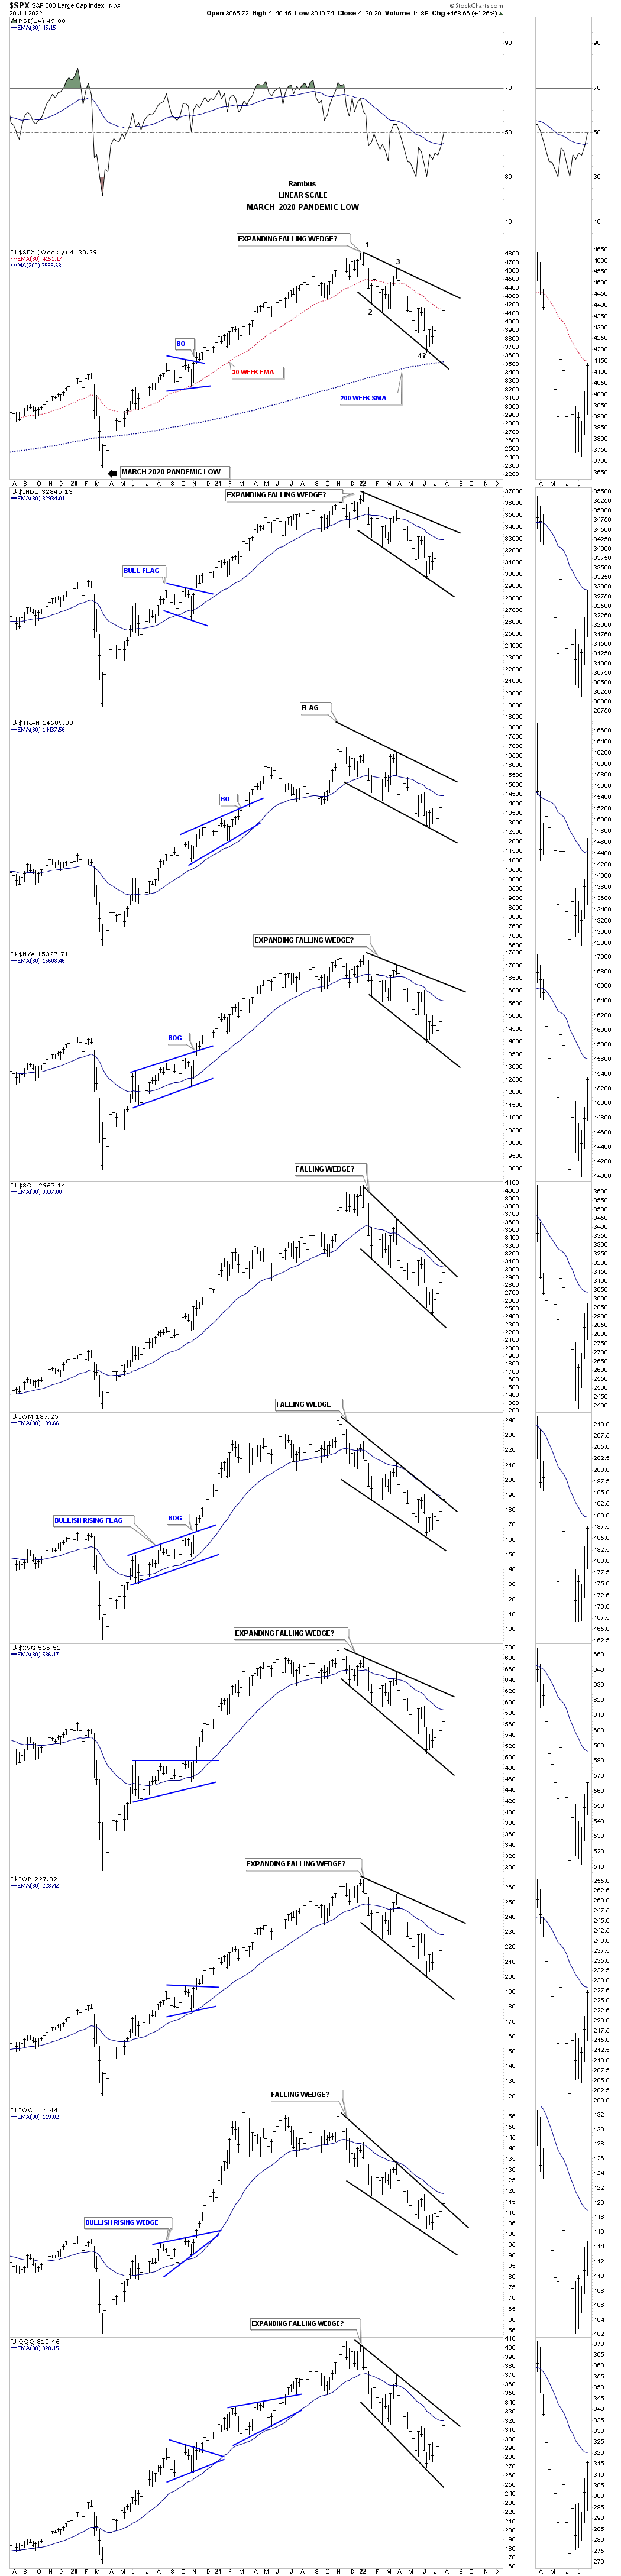
This last chart for today is the original weekly line chart for the SPX which shows the H&S top which actually reached its price objective which is conservative as this is a line chart. When I took those short positions, that lasted about a day, the price action was trading just below the previous low forming that tiny trading range. That low should have held resistance which it did initially but once the price action broke above the black dashed S&R line the trade was over because the bulls were in charge.
Now the SPX should be coming into some overhead resistance in regards to the 30 week ema and the H&S neckline. I know it feels like the end of the world and things are going to get really bad, but that is what a bottom feels like. It never feels good at an important bottom. Have a great weekend and all the best…Rambus
