
Of course I am referring to the first leg up in the long awaited bull market in the gold and silver stocks. It seems like the wait has been forever. One could say since the absolute bottom in January 2016 we have been waiting and waiting for its arrival. Mr Market has tantalized investors with 2 significant up legs since then, but I am referring to an honest to goodness 1970’s style organic bull market in gold and silver stocks. That is a long term bull market based on earnings and not just a flash in the pan uptrend. My work points towards a launch of this type of bull market by mid summer this year.
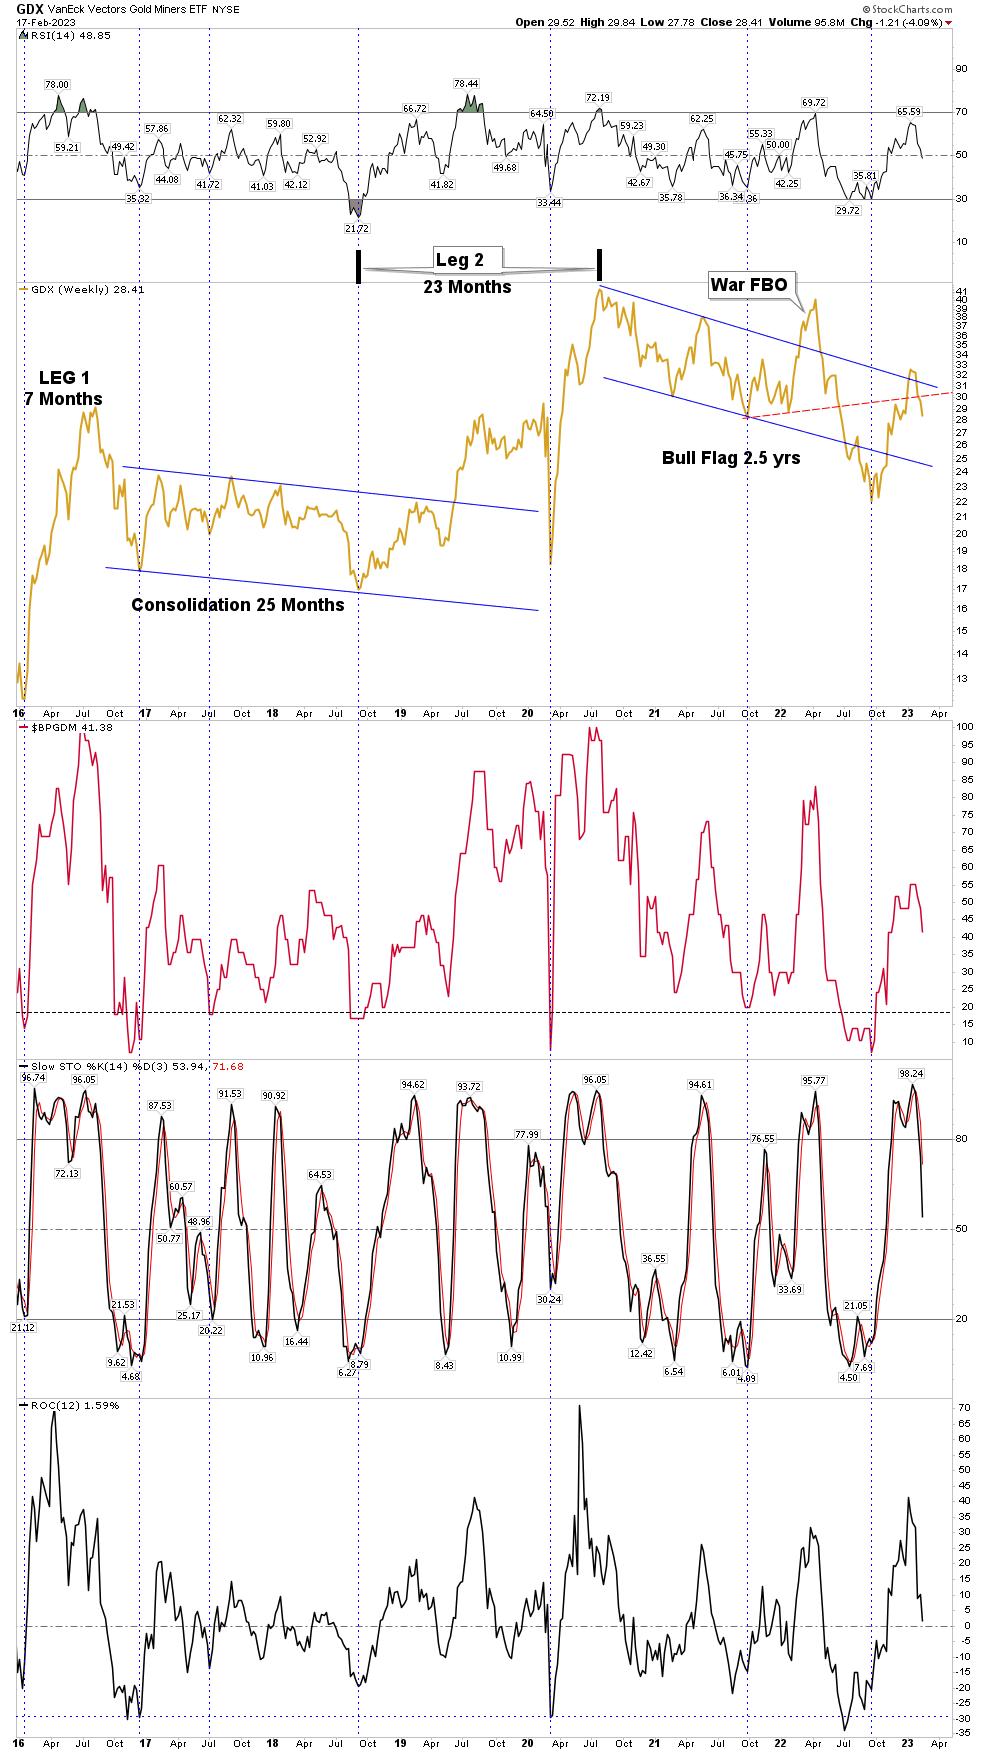
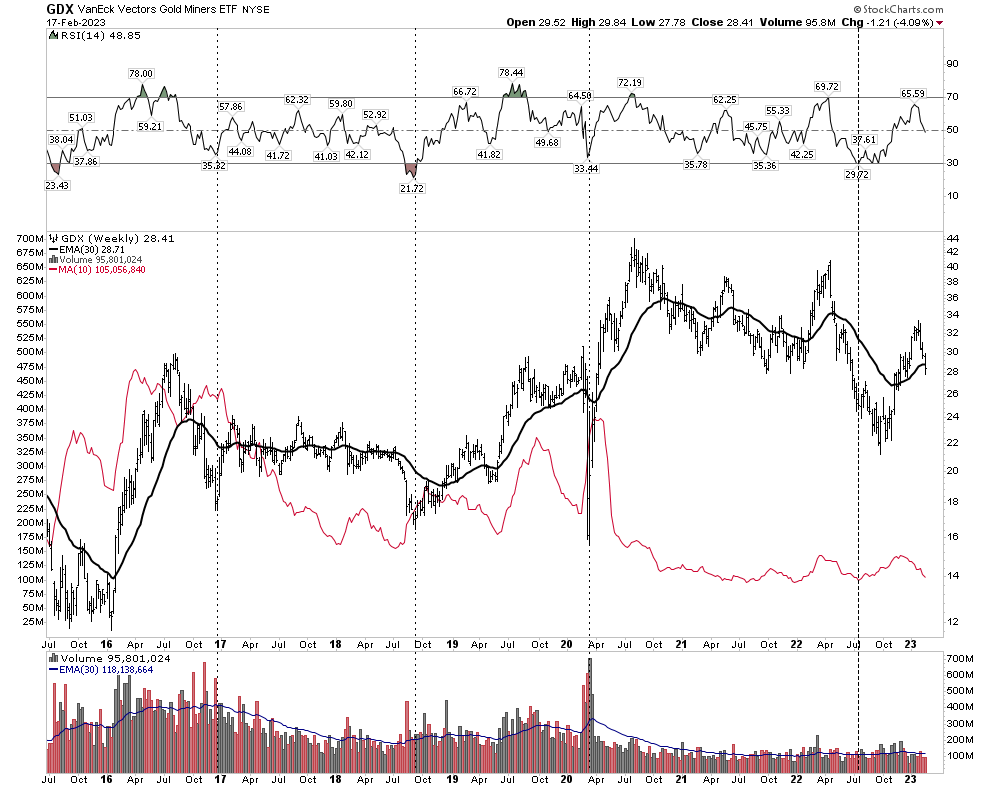
Let’s take a step back and review the base building process over the past three years. PM stocks topped in August 2020 with silver doing an end game blow off. The action since then is best described as a cyclical bear market which has now corrected the excesses and upside movement of the 2018-2020 cyclical bull market in gold and silver stocks.
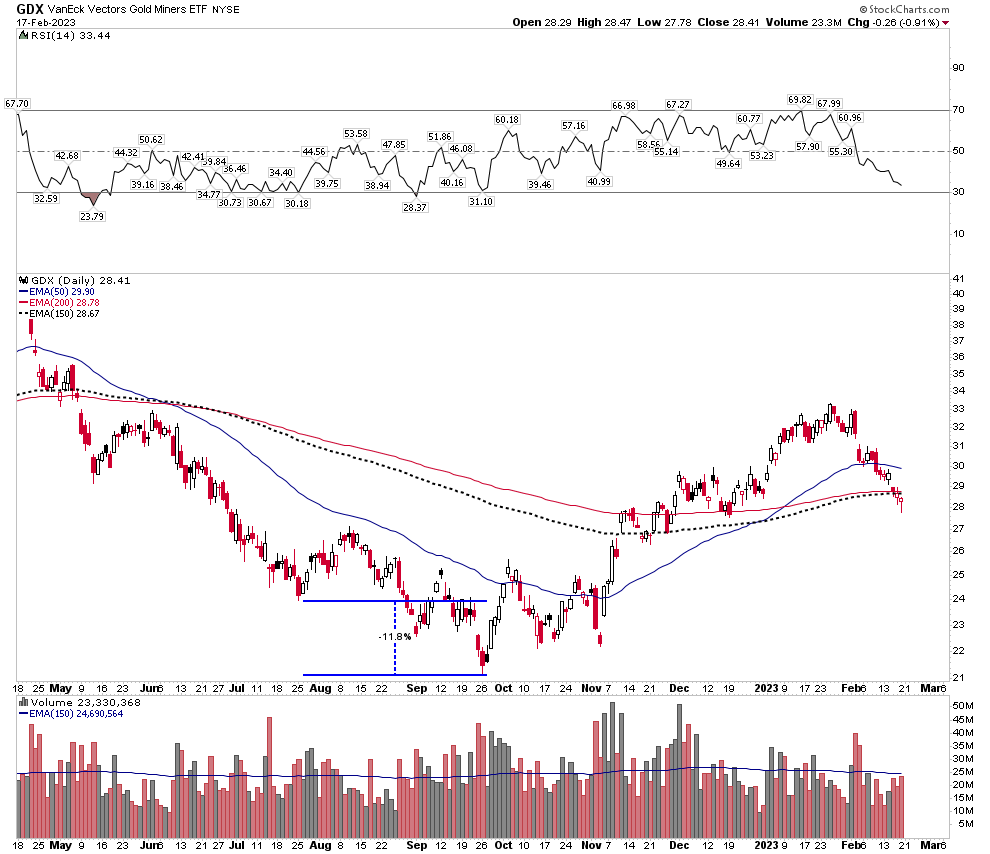
Recall I wrote a front page piece at the July 2022 lows suggesting that those lows had the possibility of being the bottom of the bear market. This was based on the extreme oversold levels of all sell side indicators. However I also mentioned that the July lows would likely be tested in a few months in the fall. That test would likely be in the form of a double bottom or a slightly lower second bottom. What actually occurred was two months later on Sept 26 the final bottom was put in 12% lower at GDX 21. It was a massive full scale capitulation of gold stock investors. The last 2 bottom days were 2X capitulation volume with investors finally throwing in the towel.
Below we see the failure of the July lows and a 12% drop below them:
The chart below shows, in unison, a few indicators of just how oversold and washed out that bottom was. Amazing that ROC was even greater than the covid smash.
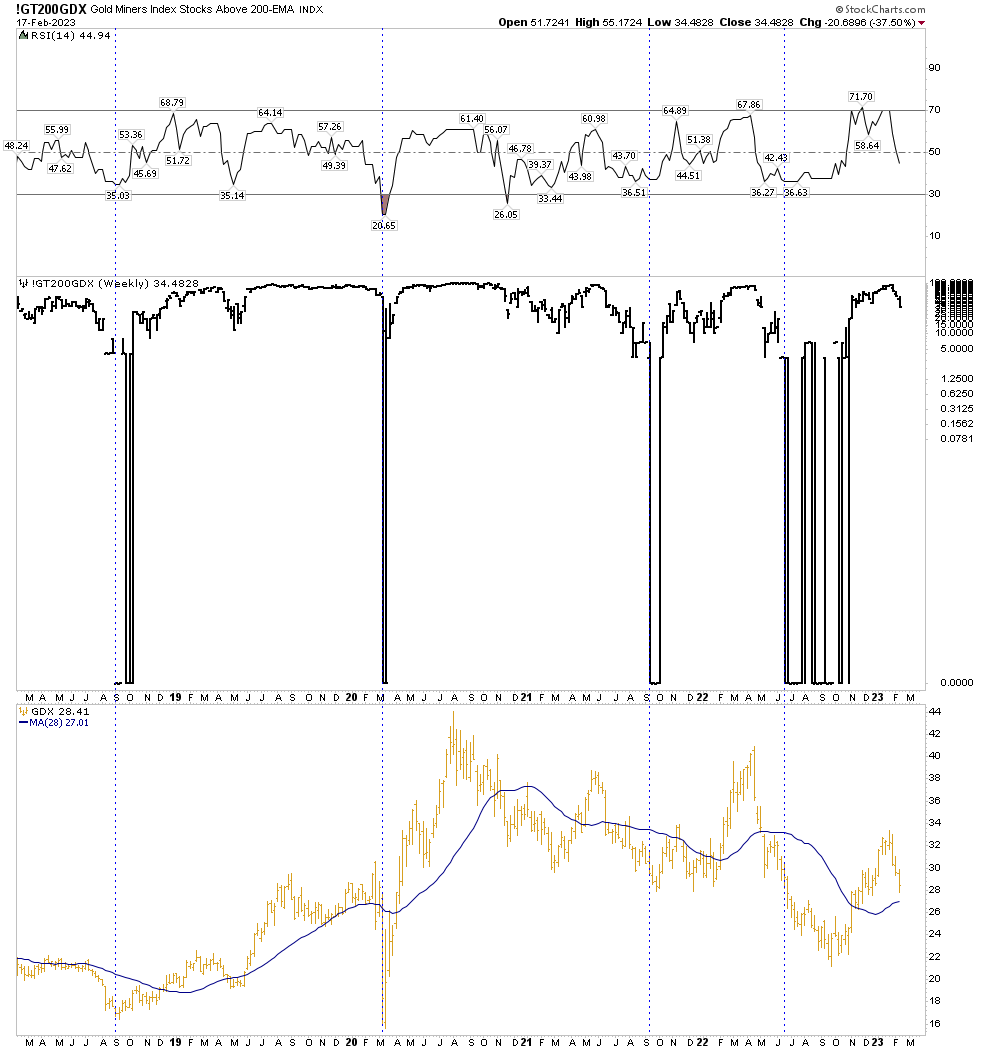
Shown below is how the percent of shares above the 200 MA was essentially pegged at zero for 5 months. This led to investor psychology getting absolutely blown out.
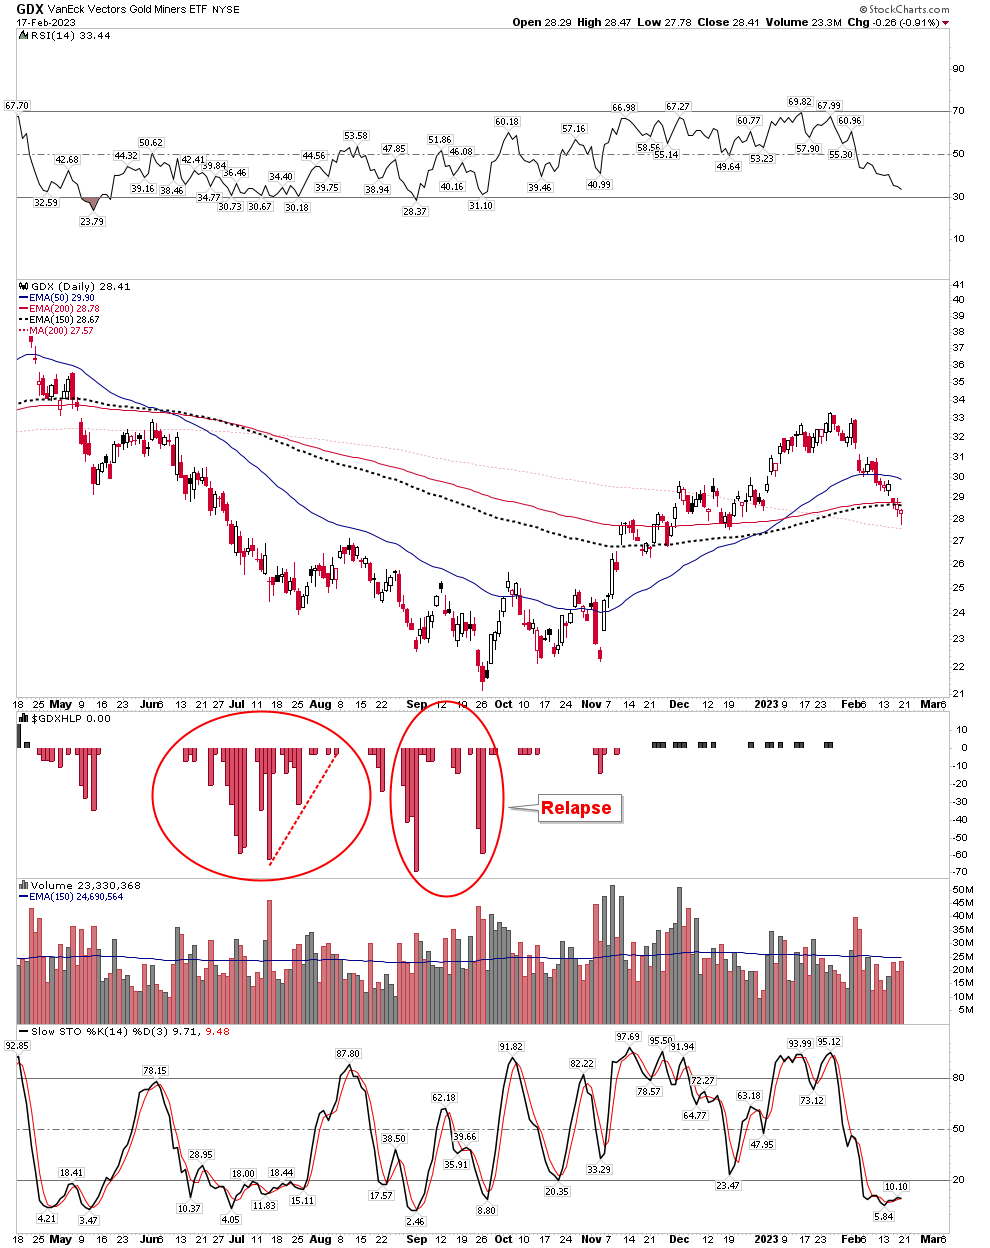
Below we see another view of massive capitulation with two series of high/low bars blowing out to the downside. The bars represent the percent of new lows. Note it reached up to 70%. It was a puke fest.
The bottom was lead by gold putting in 7 down months in a row. That hadn’t happened in 40 years. Junior miners didn’t just get hammered they got obliterated. It was the classic bear market annihilation drive I have written about only seen at the end of epic bear markets. The actual bottom had 2 high volume days, however overall volume had dried up in GDX as can be see by the average volume red line in the chart below. A classic sign of a bottom:
All gaps in the GDX had now been filled, my Sprott broker told me he was getting 2-3 account terminations a day. Simply put psychology was wiped out. This is what bottoms look like. So now 5 months later I still think it will prove to be the bottom of the bear and the beginning of the bull market in gold and silver stocks.
The Cycle is about to turn up
So September 26th was likely THE bottom in the stocks, but the gold/silver cycle has yet to turn up. Charles Nenner, a good cycles guy sees the daily gold cycle turning in March and the weekly in May. Seasonality normally has gold bottoming sometime in the summer. These observations are consistent with my view that the GDX bottom will be tested over this period and I see it likely to be a hard test. Maybe it will be close to a double bottom. Note almost all gold and silver indexes have open gaps down around the September lows. 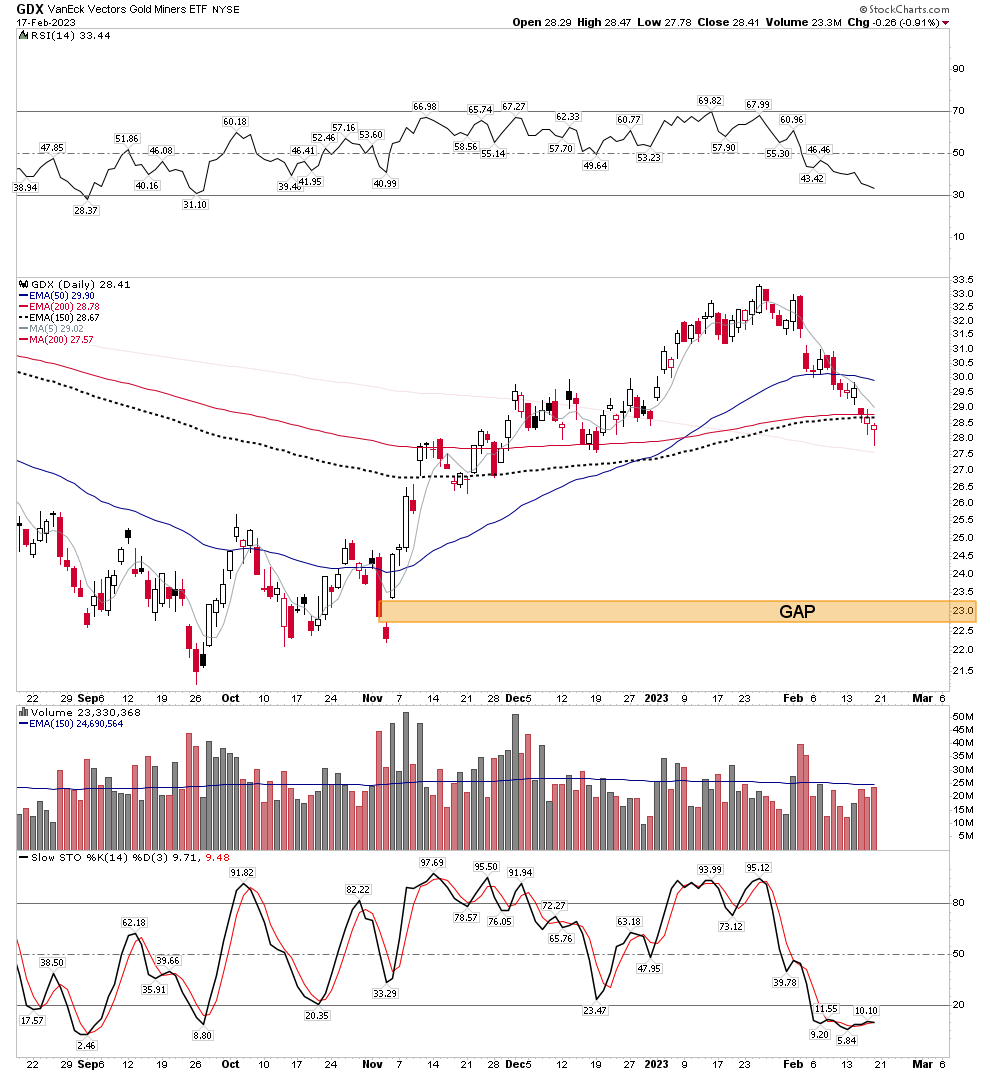
Frankly, I think it is high odds that this gap gets filled, between now and late summer. What would cause such a sharp decline after such a promising bottom so painstakingly put in last year? Who knows, but it is my view that it could be caused simply by a decline in sympathy to a hard sell off in the general stock market. A drop to 3,200 in the S&P could be enough to take the GDX down as well to the 22.5 level thus filling the gap.
Summer 2023 launch of a 2-3 year bull market in gold and silver stocks
You’ve heard it before “the bigger the base, the bigger the space”. By summer 2023 these stocks will have a massive base broad enough to support an extended move to the upside lasting a few years. That is a move with solid fundamentals propelling it, not just a 2016 style flash in the pan. First off gold responds best to a breakdown in faith in monetary systems. It’s easy to see this is now finally occurring with the economy softening and the FED no longer able to play the QE card without stoking inflation. That alone should begin to run the gold price higher. But the big driver which many don’t understand is the dynamic which occurs in a post bubble contraction. That is, the relative price of gold to other mining cost inputs goes up. The price of gold relative to the price of energy and the CRB rises leading to profits flowing to the bottom line of miners. Below we can see how gold vs the CRB has put in a bottom and is now turning up. This is the engine to a bull market in the PM stocks. But it takes time to flow down to the p/l sheet and it’s just beginning.

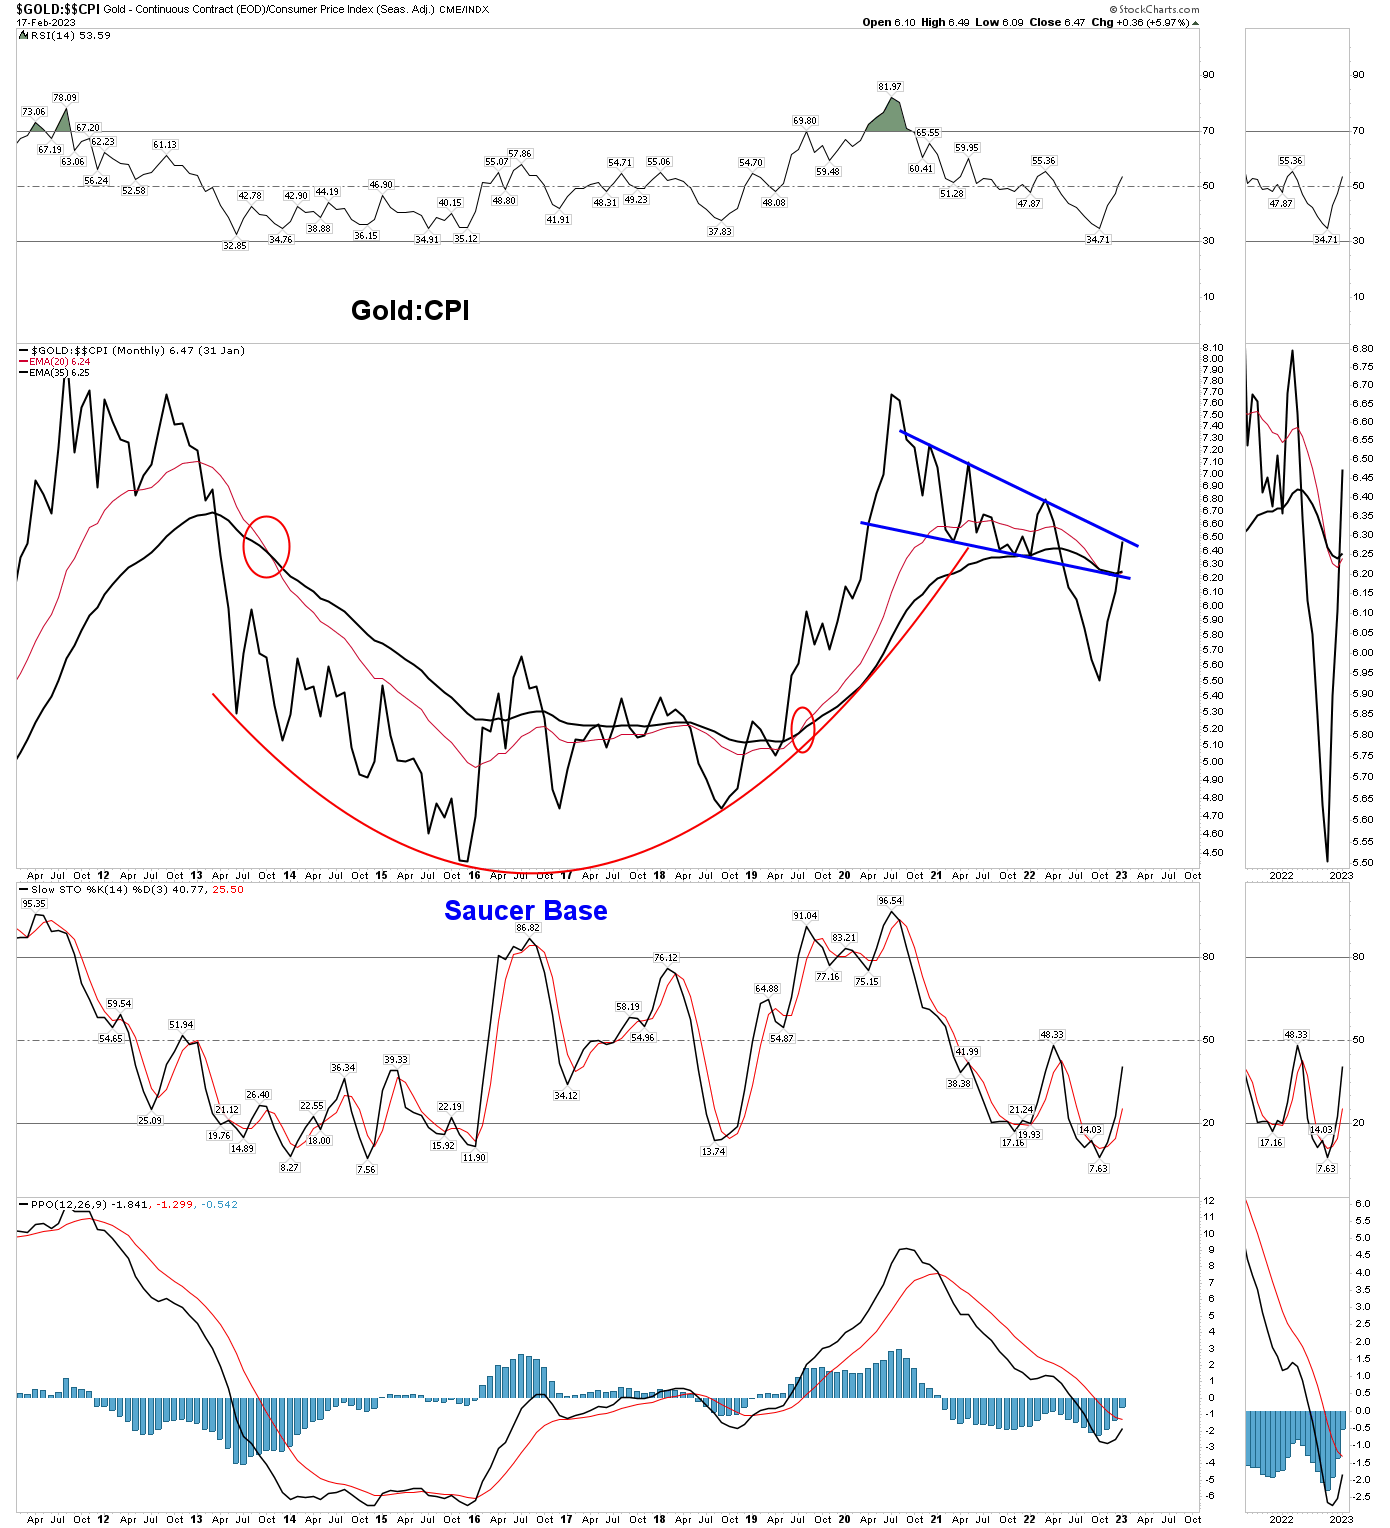
Another longer term look at this concept is gold vs CPI. Below you can see a massive Cup & Handle formation ready to break out:
So that is a short review of where the gold and silver stocks have been and what likely lies ahead. I plan on deploying most of my firepower down around the open gap level and directed towards beaten down production companies and a handful of silver companies. That’s where the biggest bang for the buck is likely going to be in the first phase of the bull. There will be time later to play the juniors.
The General Stock Market
The big picture view of the general stock market is it remains in a bear market and will see lower lows this year. Robert Ferrell of Merrill Lynch taught us that bear markets consist of 3 phases. The first phase is a hard decline of most all stocks followed by a retracement phase. After the retracement then a long steady decline correcting the excesses of the economy unfolds. The rise in the S&P since mid-October has been that retracement of the initial phase. What lies ahead is the long steady decline. Analogs hardly ever work, but the bear market of 1973-1974 may offer a reasonable model for this present bear market. They both have numerous similarities. They share fundamental drivers such as inflation, overvaluation and political instability. After Nixon resigned in August 74 the final annihilation drive began. Will “Joe Biden” make it through 2023?
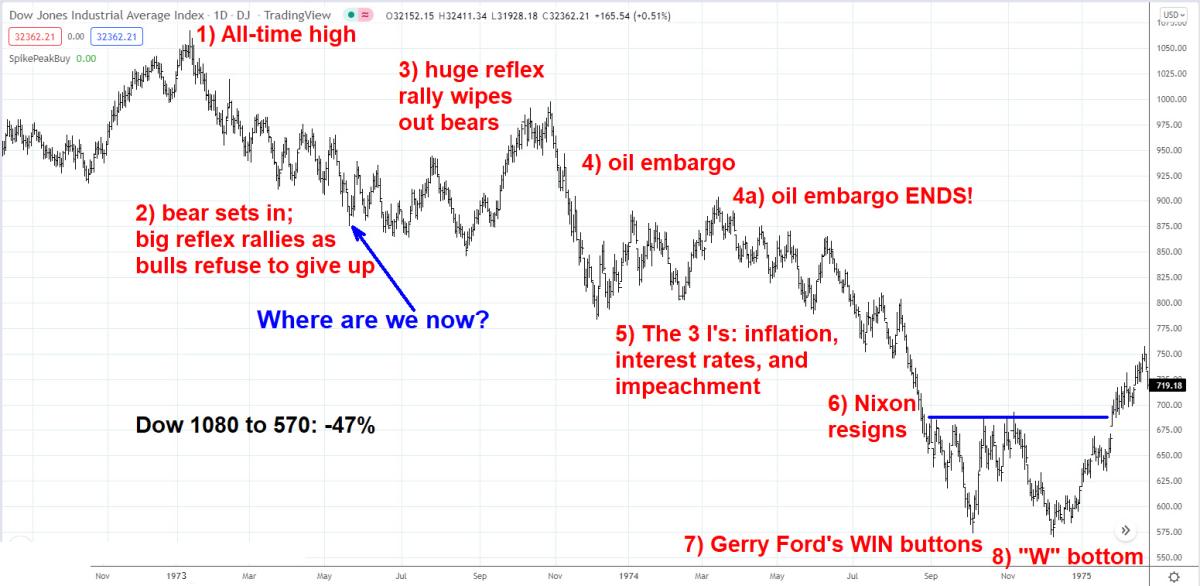
Disregard the blue “where we are now” as the market is more likely around the Nov 1973 period or April 1974. The point being the retracement is ending and the downward grind is about to begin. This could put downward pressure on the gold stocks until the flow of profits by the miners overcomes this force and the stocks begin their upward move.
So that’s how I see it unfolding from here. Markets are about to get real volatile once again, so be safe and most of all be patient just a little longer.