Its been awhile since I last did an in depth report on commodities which have mostly been in consolidation mode since their massive impulse move out of the 2020 pandemic crash low. Rising commodity prices usually signals inflation is not far behind. Even with all of the FED rate hikes I think they are going to have trouble keeping inflation under control.
Most of the commodity charts to follow show the big picture which is why inflation is going to be sticky moving forward. With the infrastructure build out taking place there will be a lot of demand for many commodities like steel, copper and energy to get the job done which won’t be overnight. Keep in mind, for the most part, commodities have been in a long drawn out bear market which began in 2008 in many cases with the 2020 pandemic low being the bottom of the bear market.
There are many charts tonight so lets get started. Most of the charts are pretty self explanatory so I won’t spend a lot of time dissecting each long term chart.
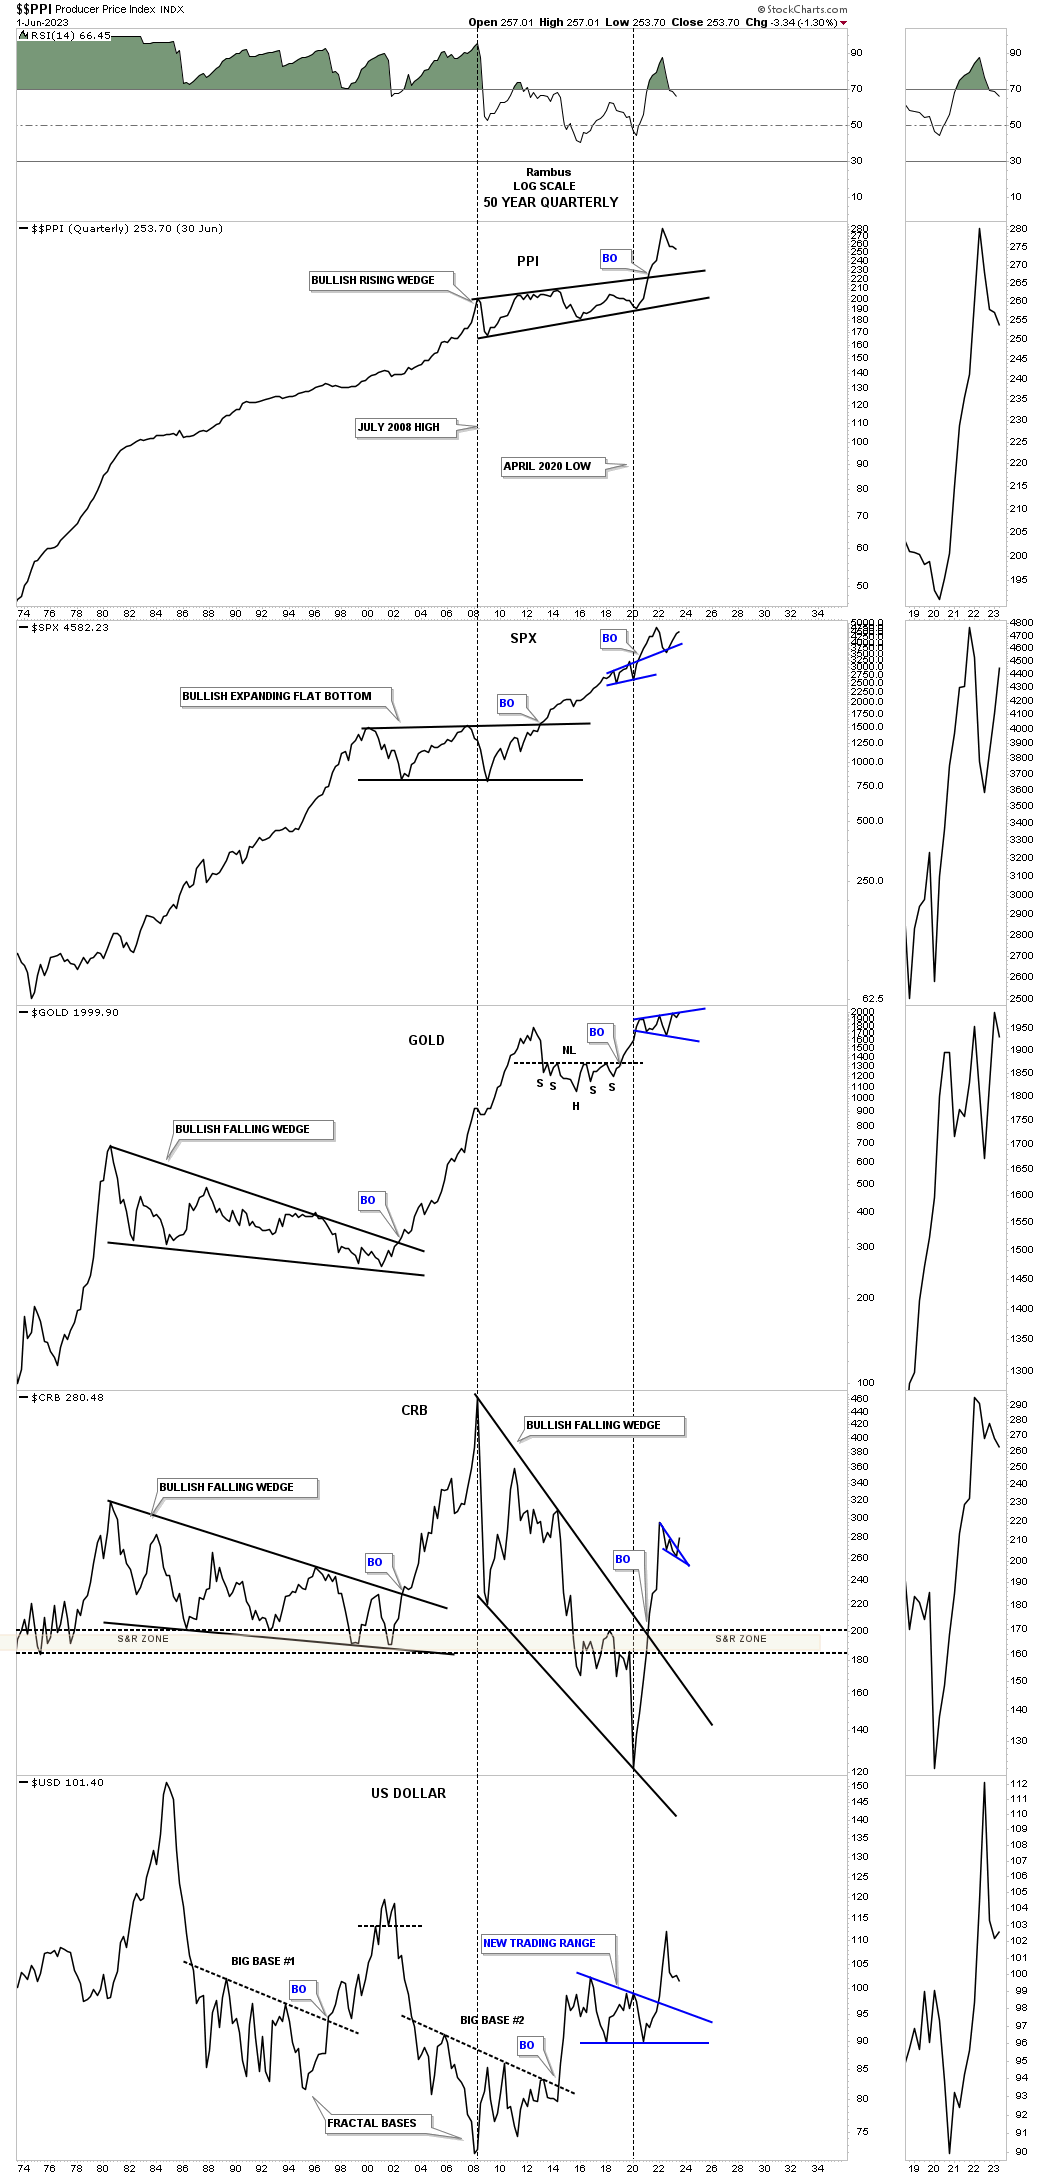
First I would like to start with the 50 year quarterly line combo chart for the PPI with the SPX, Gold, CRB index and the US dollar on the bottom. Looking at the PPI on top you can see inflation over the long term is just a fact of life as it has been steadily rising for the last 50 years.
In 2008 the PPI, Producer Price Index, began to trade sideways which led to the bear market in the CRB index. At the 2020 low is when the bear market ended and the first leg up in the new bull market began for the CRB index. That 12 year bear market formed the bullish rising wedge on the PPI which had a nice strong breakout completing the massive consolidation pattern.
The SPX doesn’t seem too affected by rising inflation as it is trading close to its all time highs. Gold just below the SPX is also trading very close to its all time highs. Note the CRB index which is in the process of breaking out from the small blue bullish falling wedge. On the very bottom is the US dollar which has been declining for most of 2023 which puts a tailwind behind the commodities complex.
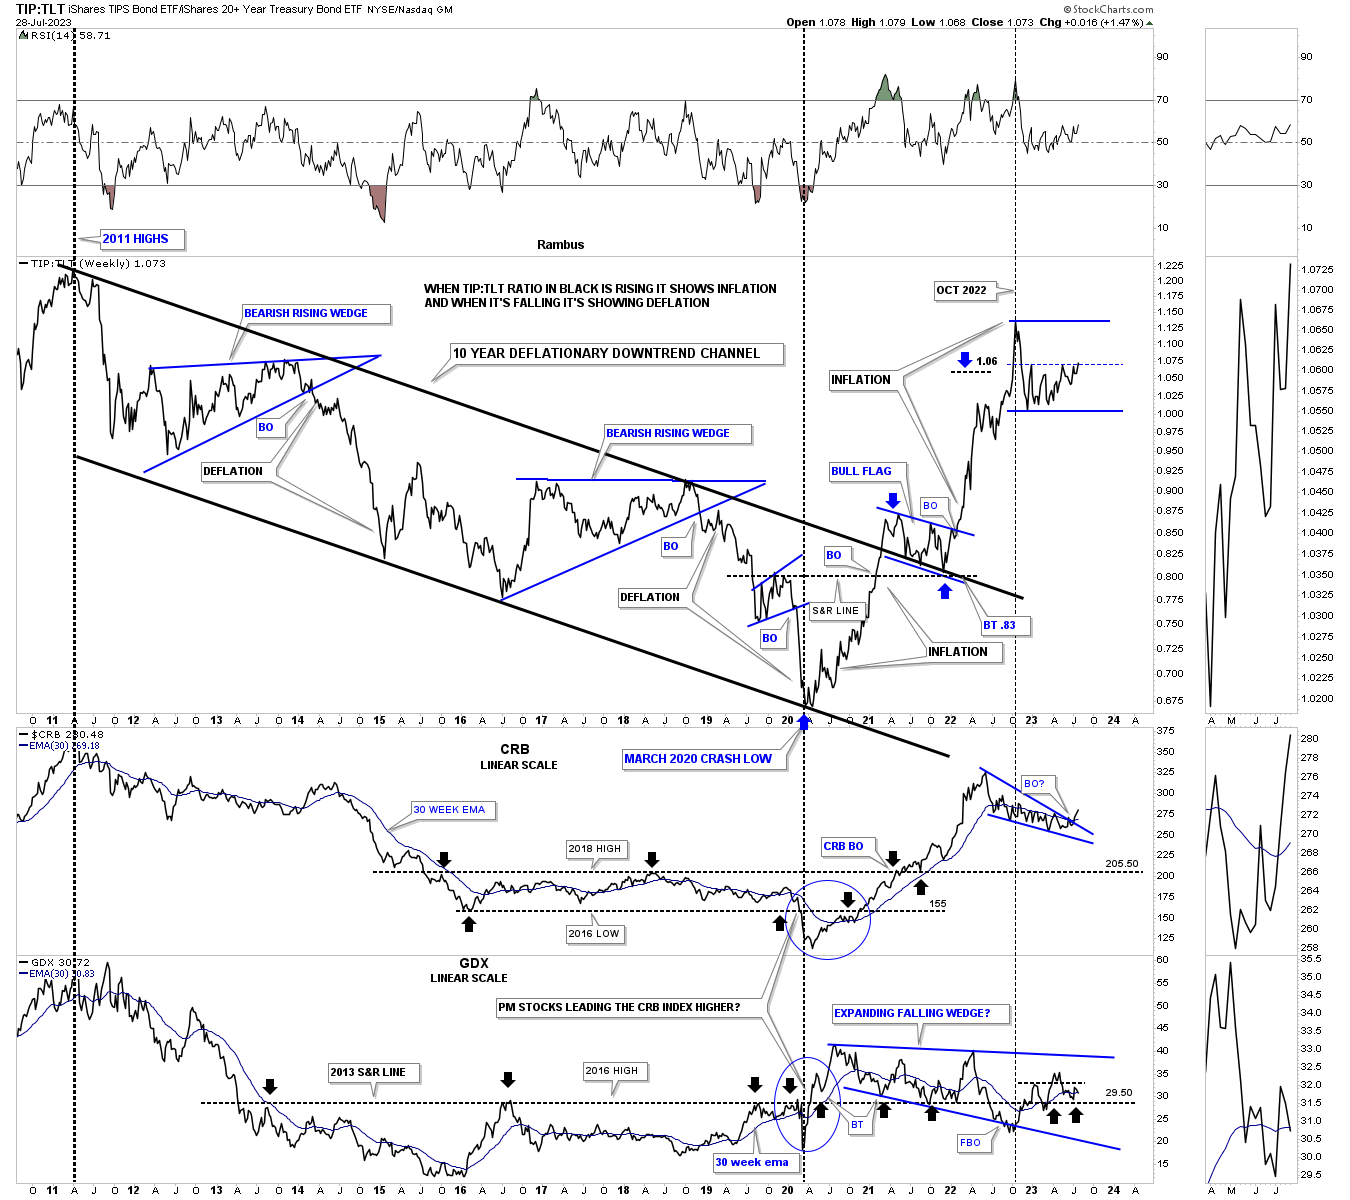
This next chart is a ratio combo chart which has the TIP:TLT ratio on top followed by the CRB index with the GDX on the bottom. When the ratio chart on top is falling that shows a general trend of deflation and when it is rising a general trend of inflation. You can see what happened after a nearly 10 year bear market decline in the ratio which bottomed in March of 2020 which has been rising steadily ever since. The CRB index just below the ratio shows it breaking out from the small blue falling wedge while the GDX on the bottom is in its own little world and is still trading sideways since its 2020 high.
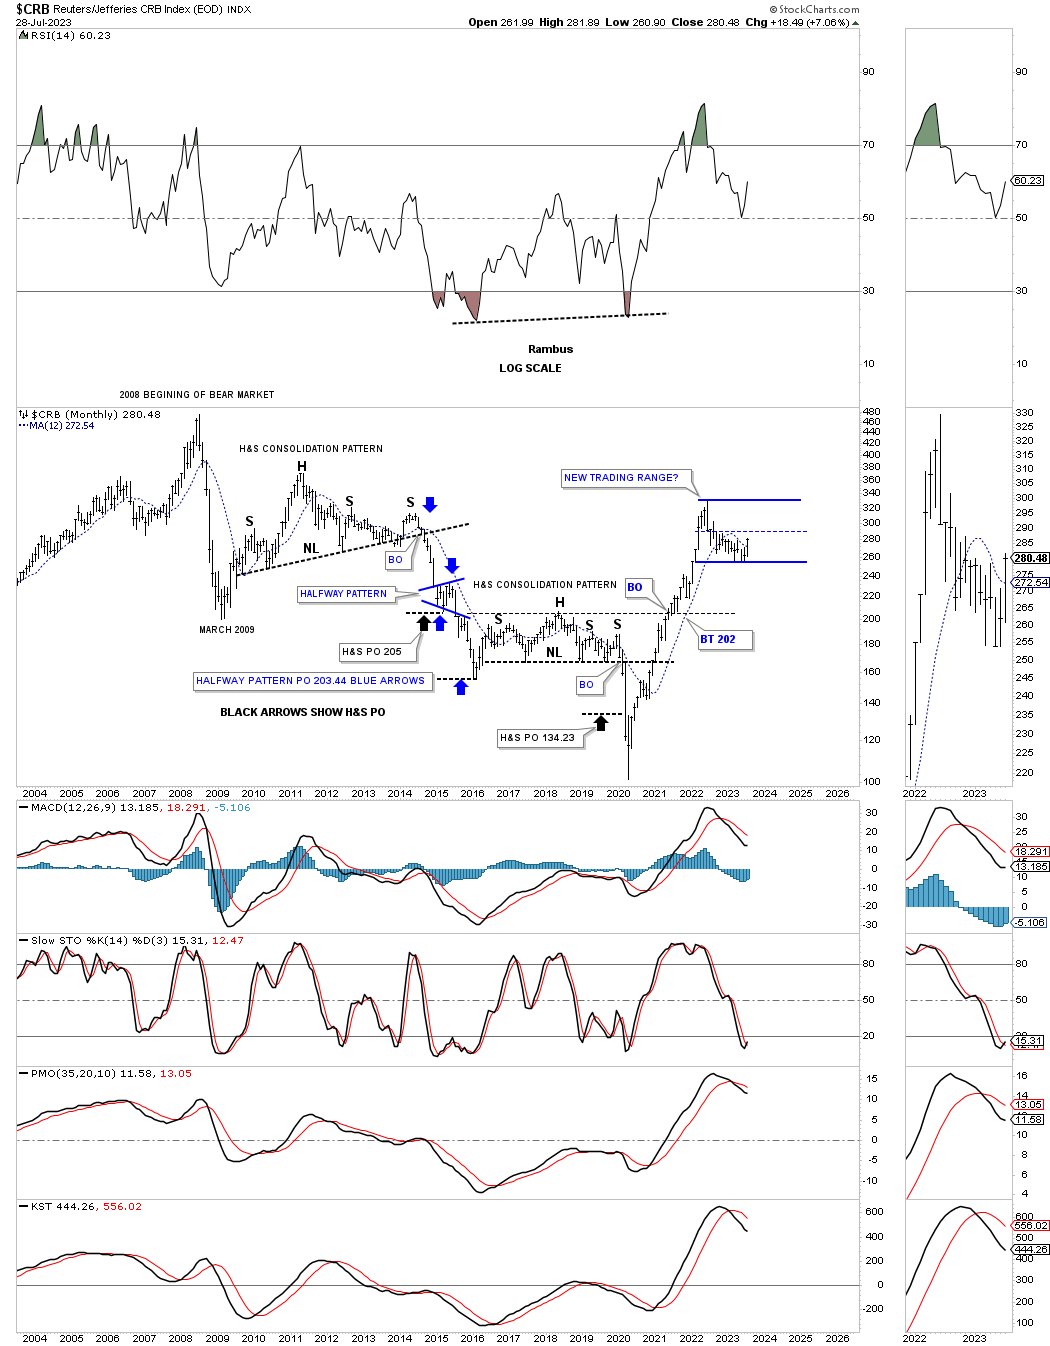
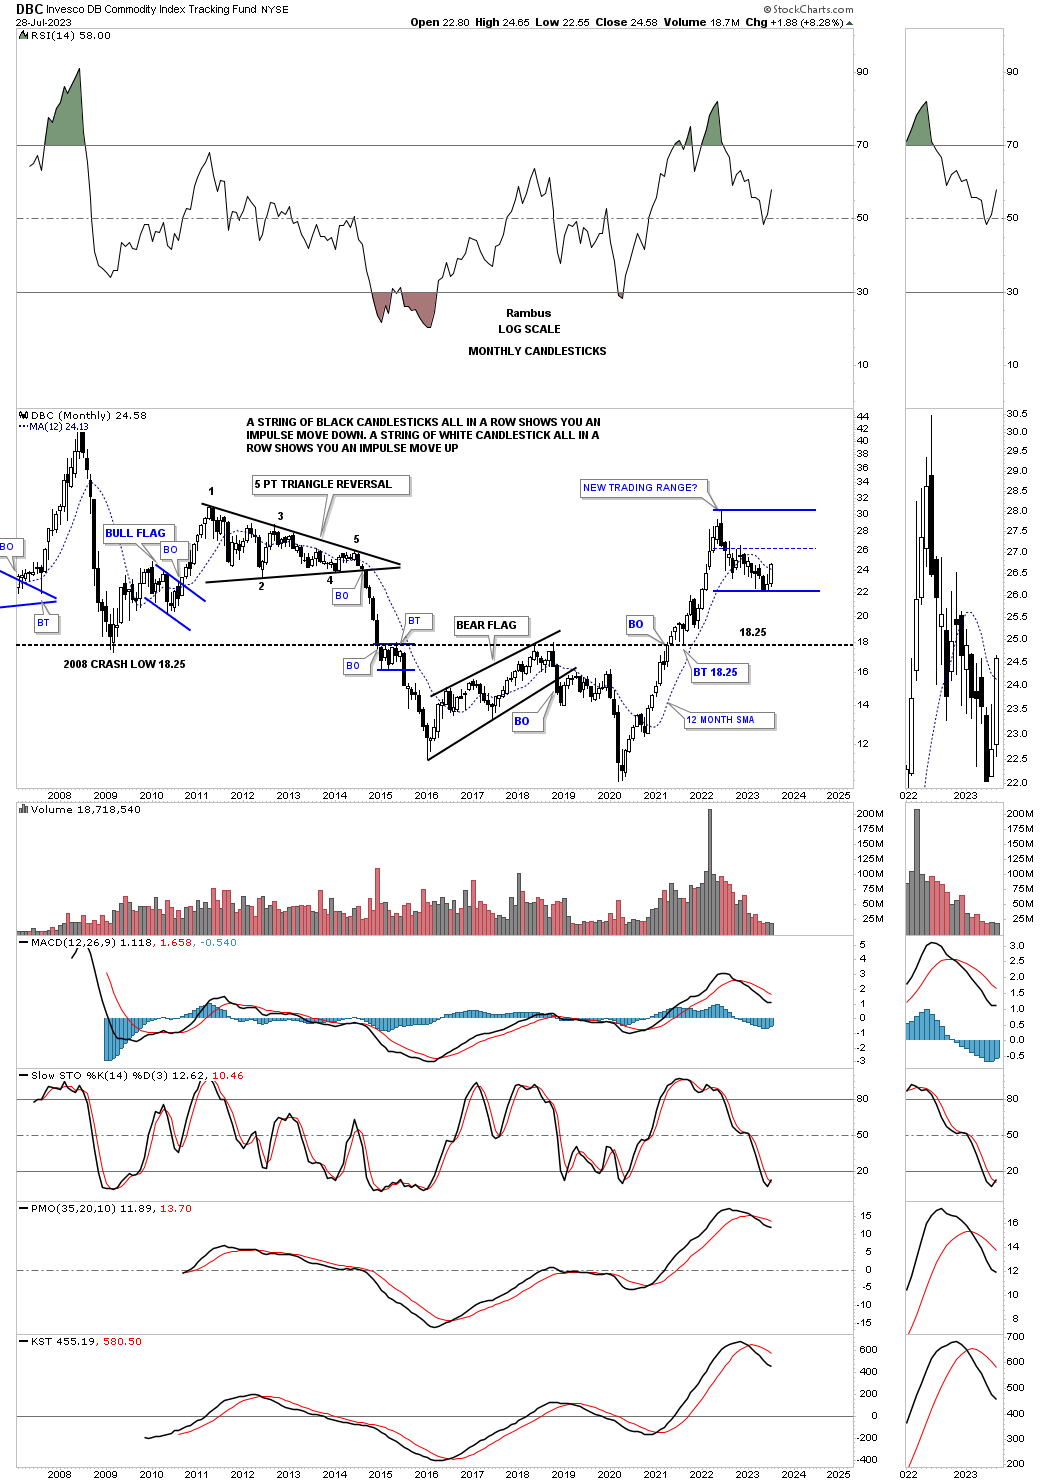
Now lets look at some different commodity indexes so you can see the rally out of the 2020 crash low which ended the bear market. This monthly chart shows the bear market which started at the 2008 high and ended at the 2020 low for the CRB index. Note how vertical that first impulse move was into the blue falling wedge. It was definitely time for the CRB index to start consolidating its gains which you want to see in a bull market.
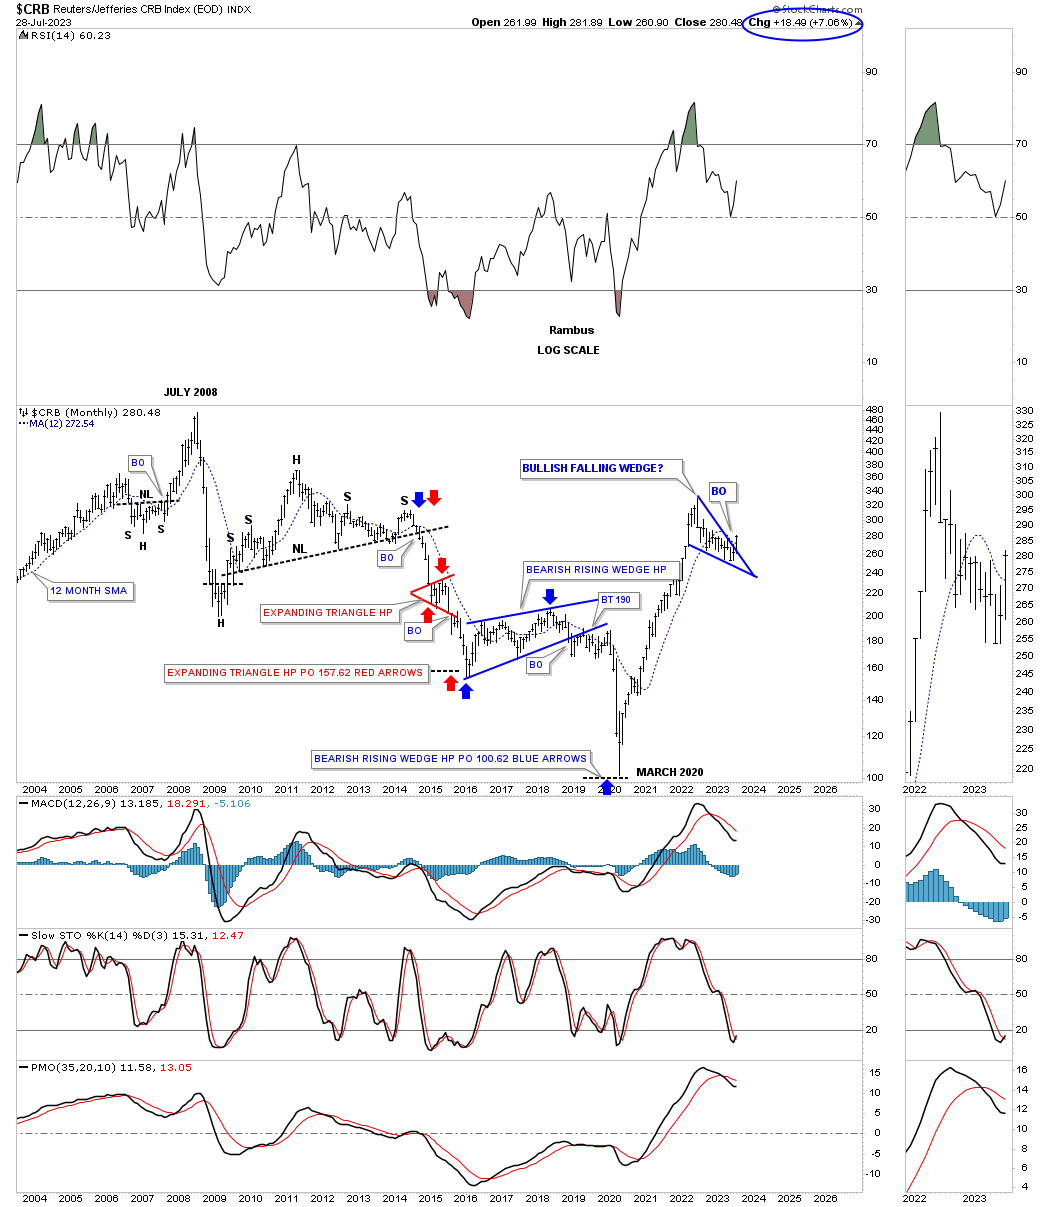
The weekly chart above shows the blue falling wedge which could be a stand alone consolidation pattern. On this particular monthly chart I’ve labeled the end of the first impulse move forming a bigger sideways trading range. At a minimum we could be seeing the bottom of the possible bigger consolidation pattern with one more rally up to the top and one more decline to form the all important 4th reversal point. At this point in time it is still too early to know if the smaller blue falling wedge is going to be “the” consolidation pattern that leads to the next impulse move higher or if we’ll see a slightly bigger consolidation pattern form.
The DBC Commodity index, from the weekly perspective showing its own blue falling wedge.
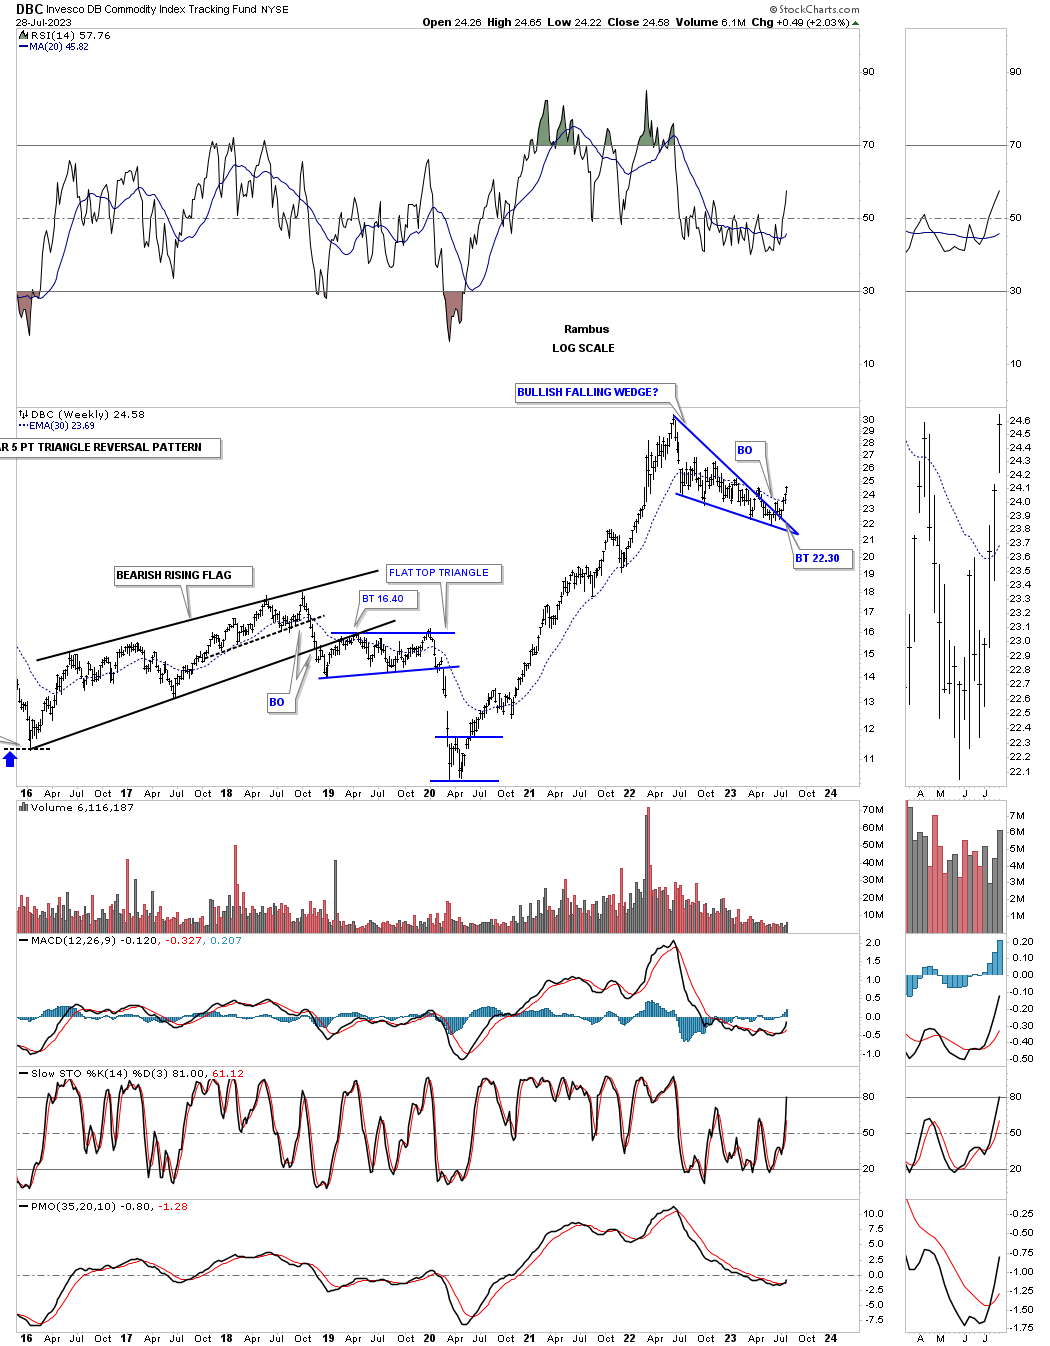
Again, similar to the CRB index we could be seeing a larger consolidation pattern under construction.
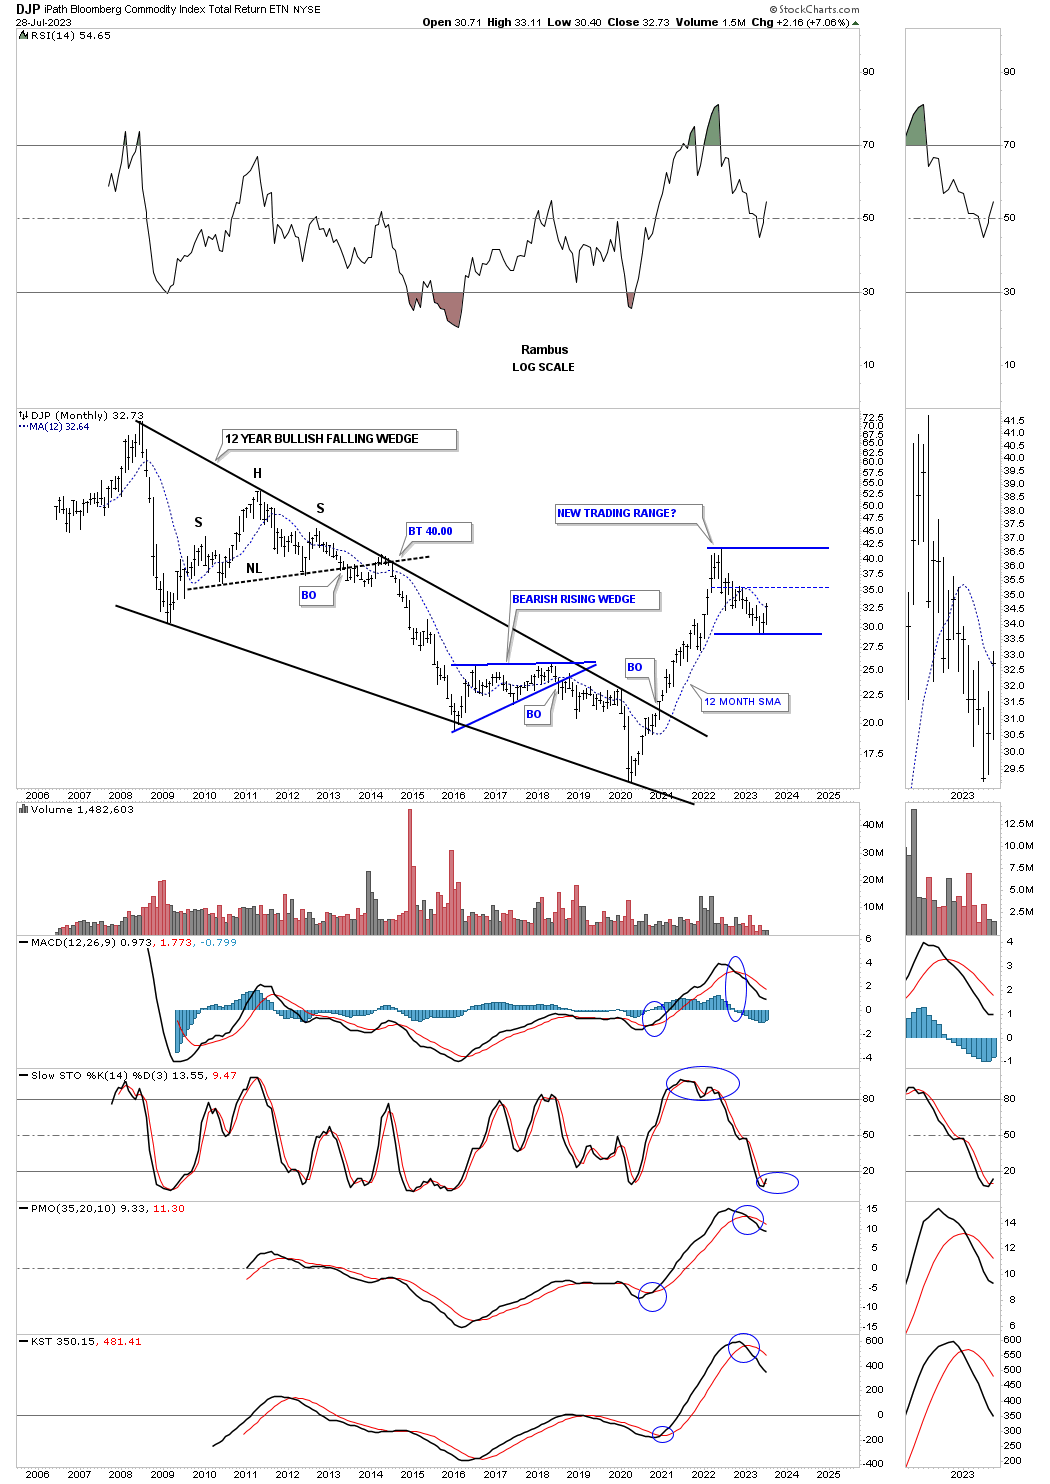
Next is the DJP, Bloomberg Commodity index, showing a similar 2022 falling wedge.
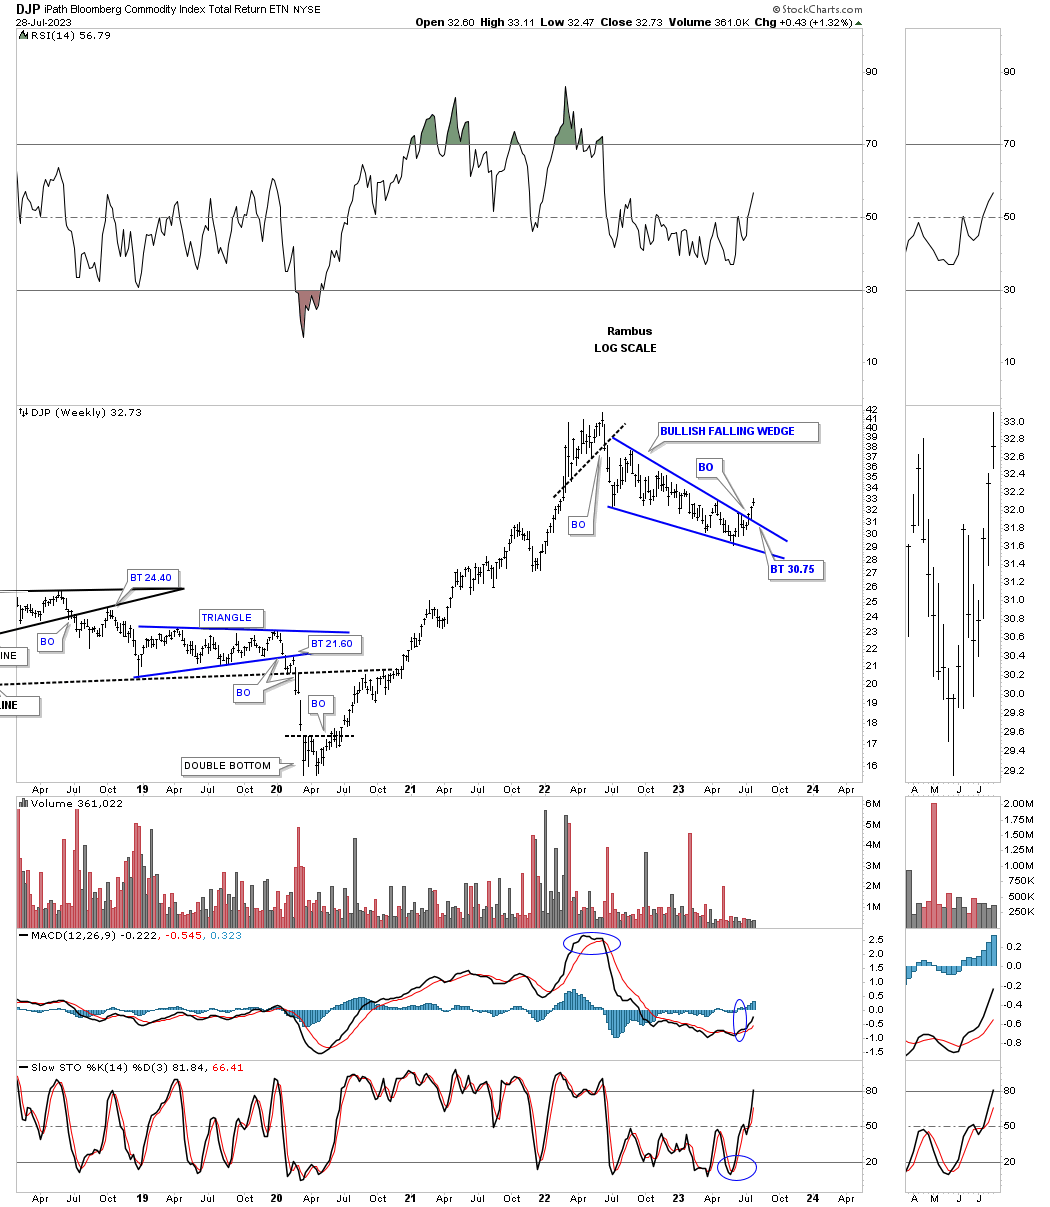
The rally out of the 2020 low broke out above the 12 year 6 point bullish falling wedge in no uncertain manner.
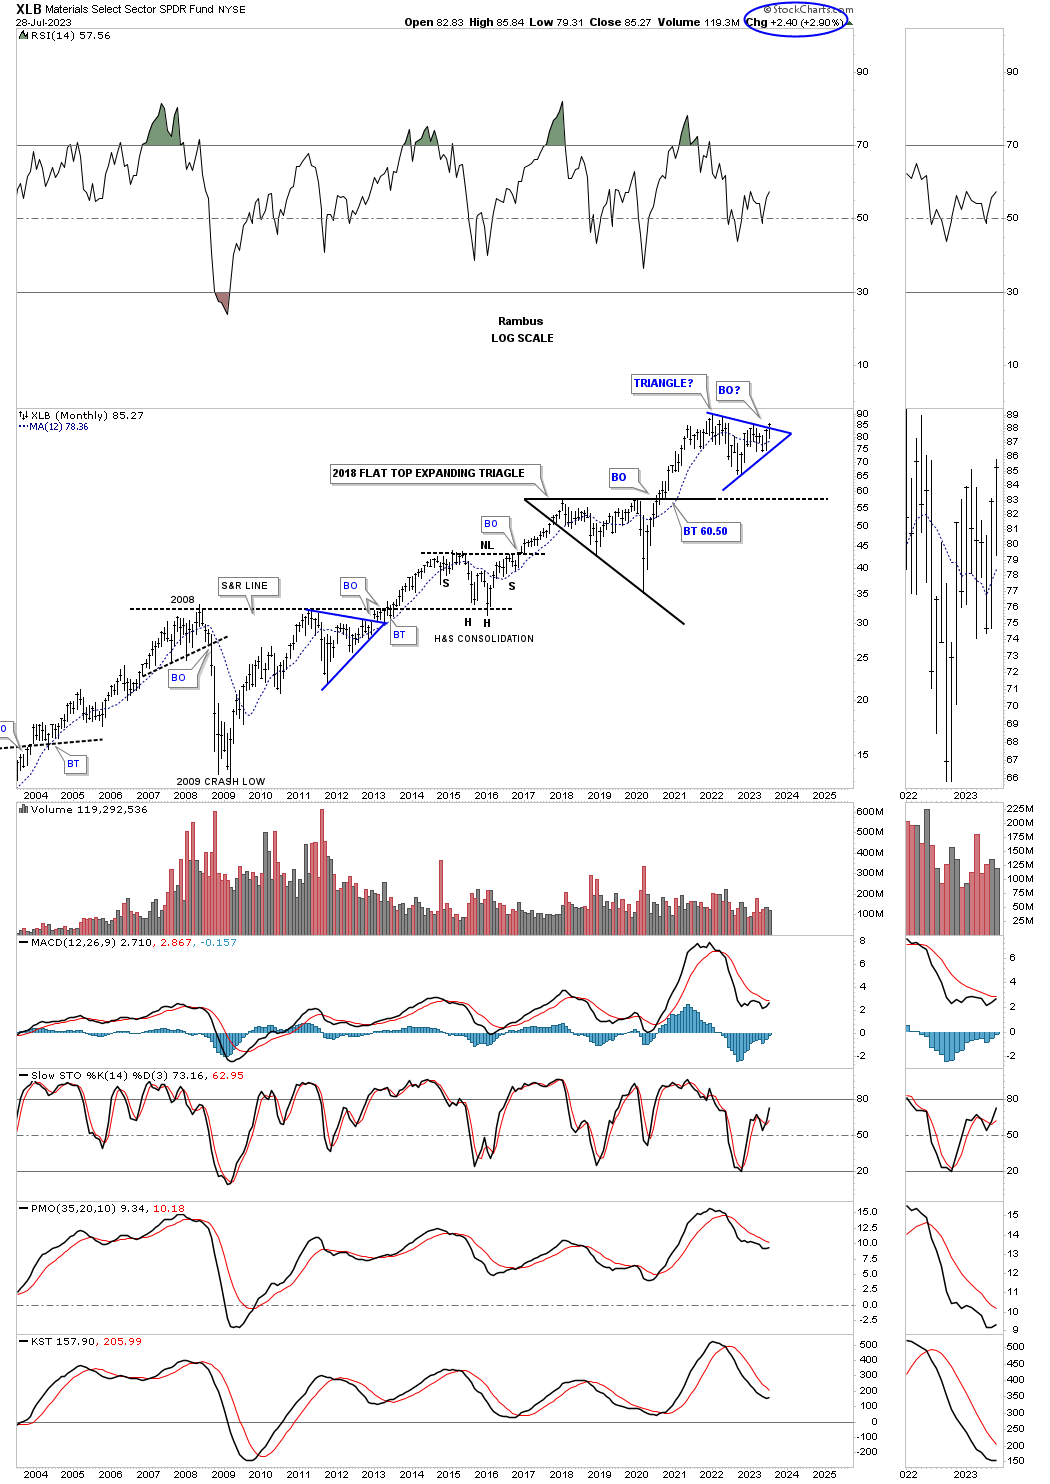
This long term monthly chart for the XLB, basic materials sector, shows the price action attempting to breakout from a nearly 2 year triangle consolidation pattern that has formed on top of the flat top expanding triangle. Note how well the secular bull markets looks out of the 2009 crash low with one consolidation pattern forming on top of the previous one. A triangle breakout now would bode well for the INDU as there are many basic material stocks in that index.
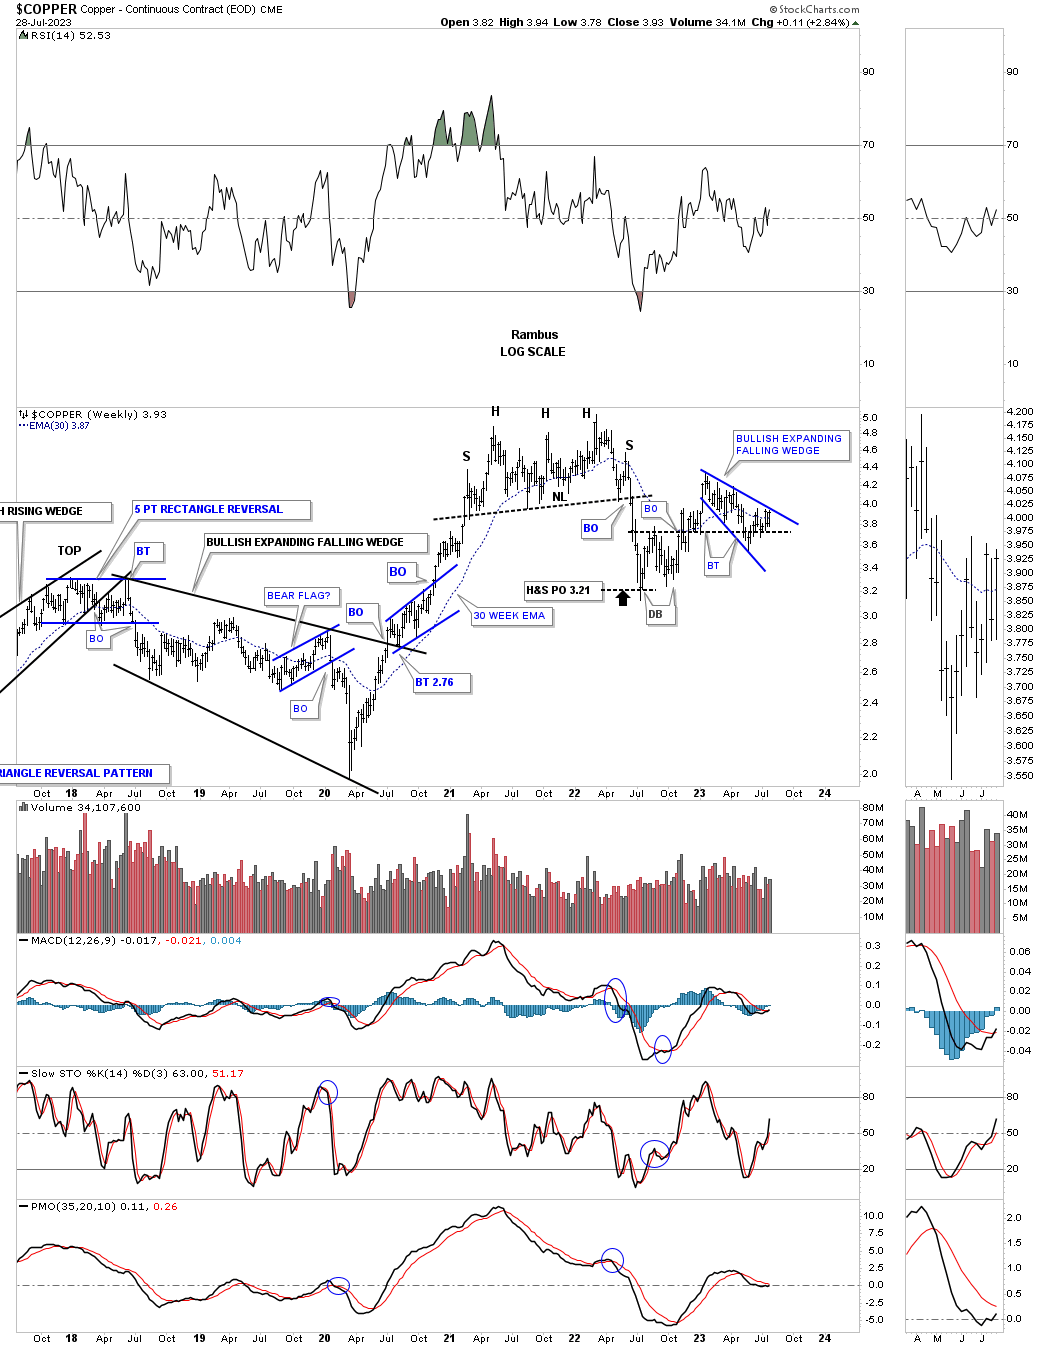
This shorter term weekly chart for Copper shows the double bottom that formed in 2022 with the blue expanding falling wedge forming on top of the double bottom trendline as the backtest currently.
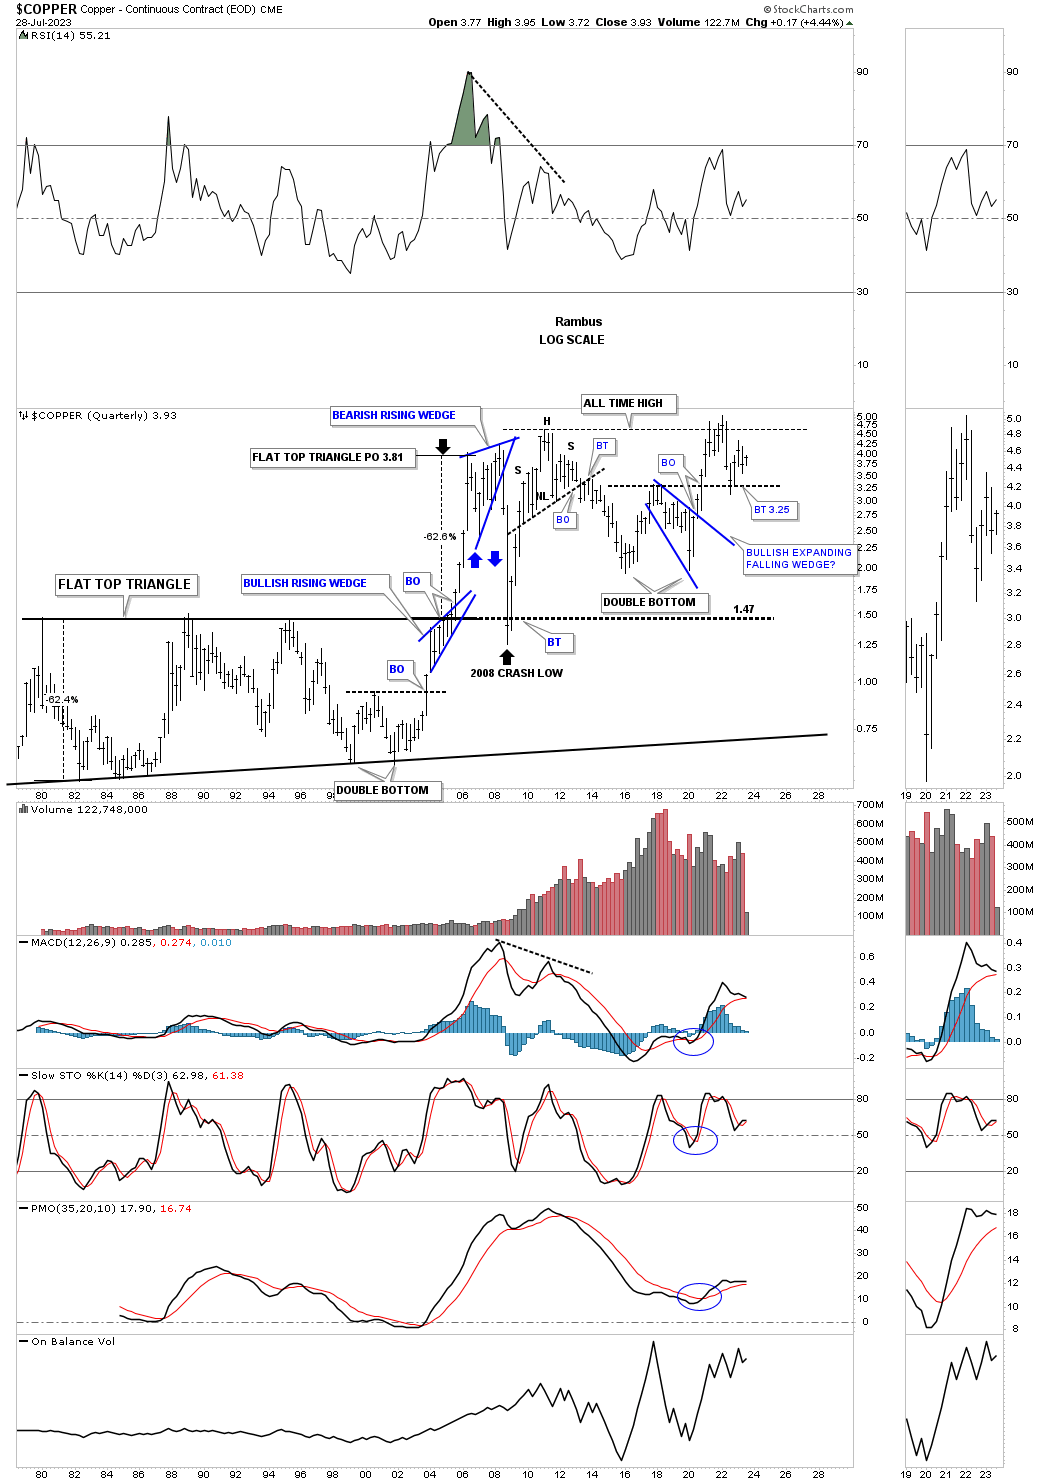
Copper is set up a bit differently from some of the commodity indexes we looked at above as it reached its all time high made back in 2008 after the 2020 low. It is now trapped between its old highs and the double bottom trendline. Note how close the price objective for that massive black flat top triangle was before the large decline into the 2008 low which held the backtest from above.
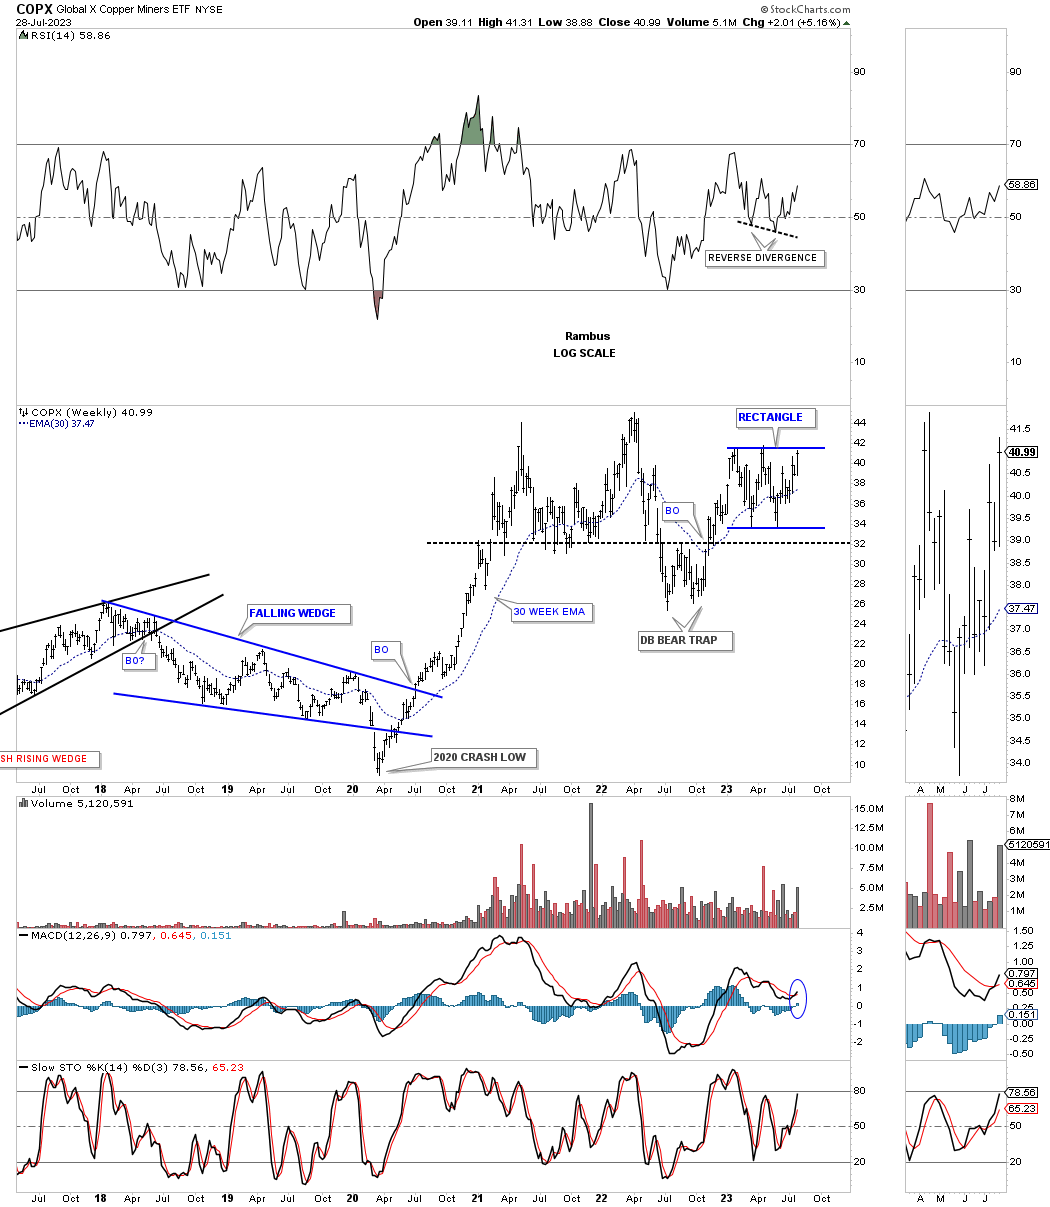
The COPX, Copper miners etf, is completing the all important 4th reversal point in the nearly one year rectangle with the double bottom trendline holding support.
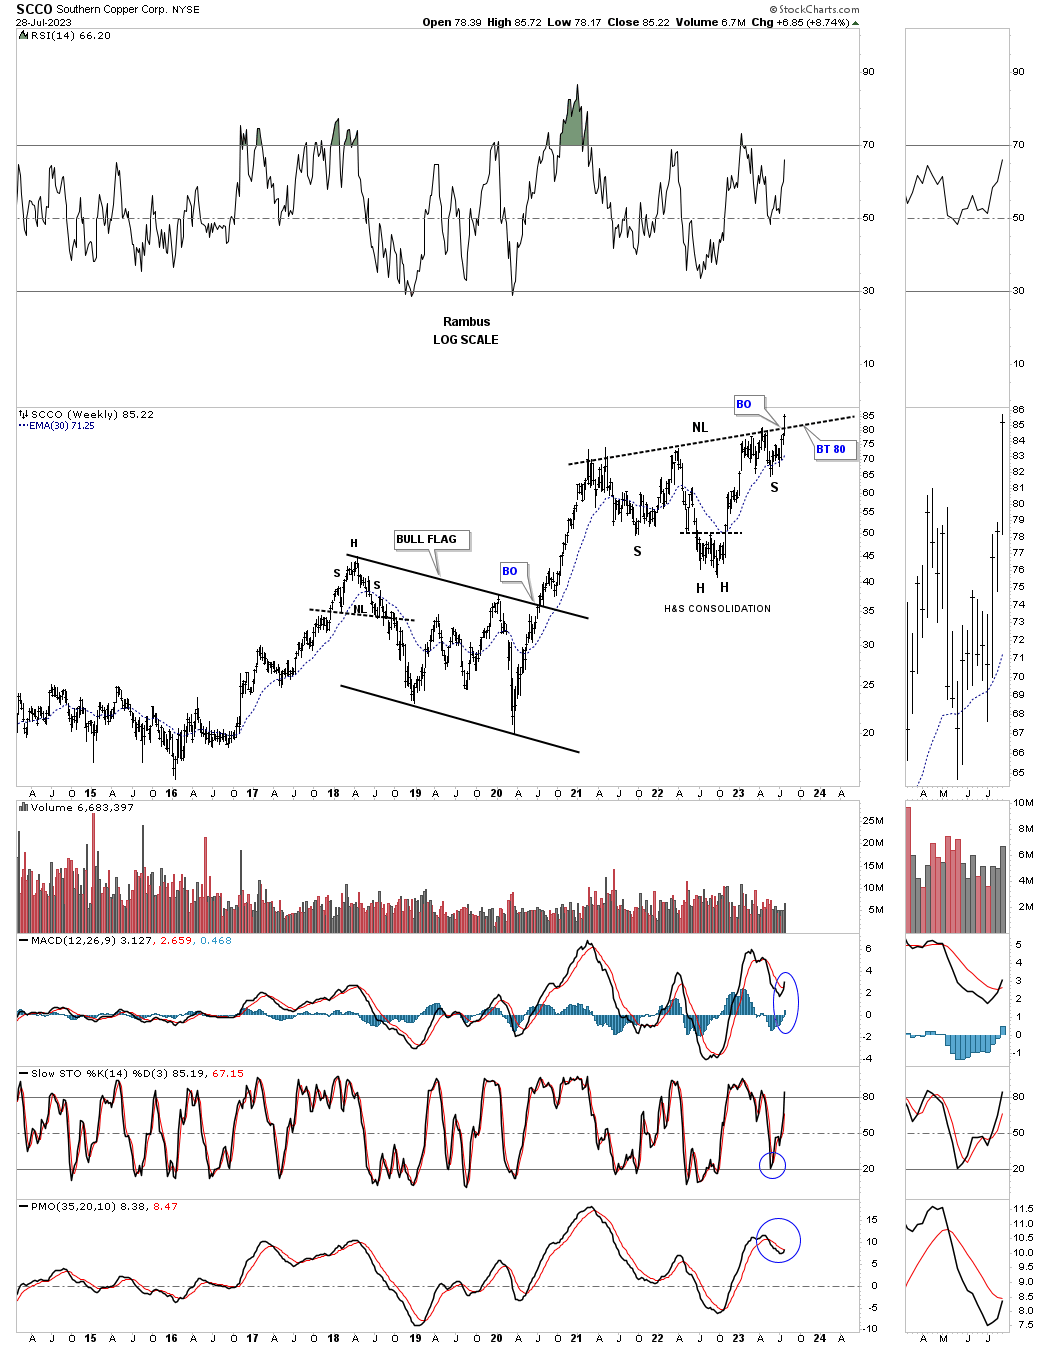
SCCO has always been one of the best Copper plays which is attempting to breakout from the H&S consolidation pattern forming on top of the previous bull flag.
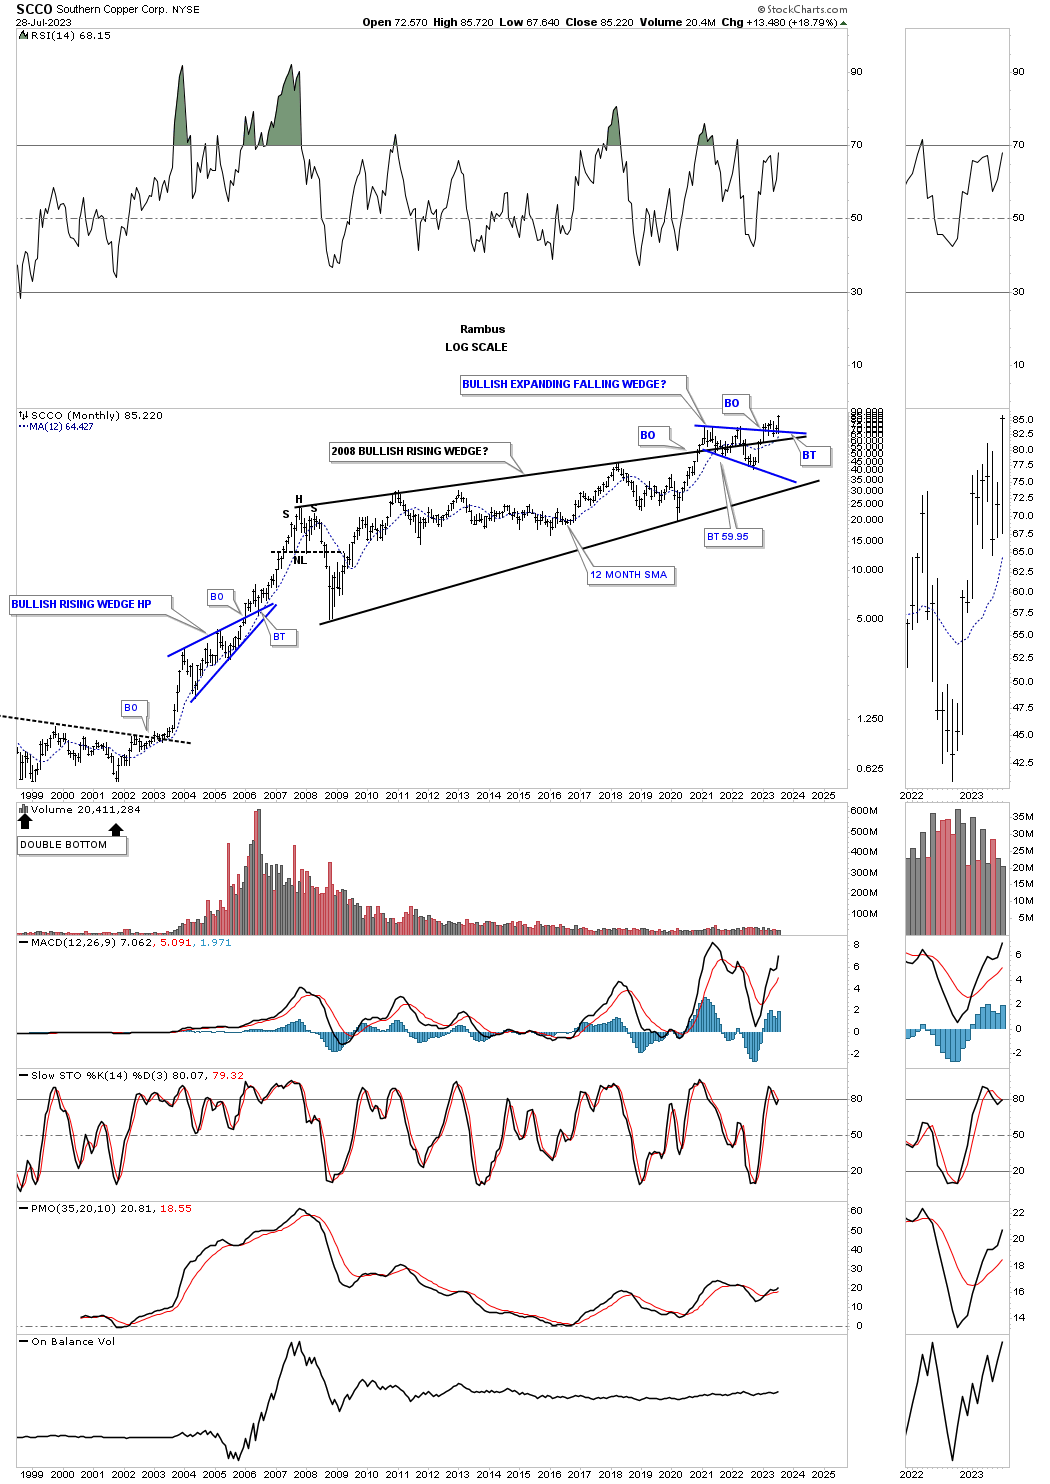
This much longer term monthly chart for SCCO shows the price action breaking out from the massive 2008 bullish rising wedge with the blue expanding falling wedge forming the backtest. It is now trading at a new all time high.
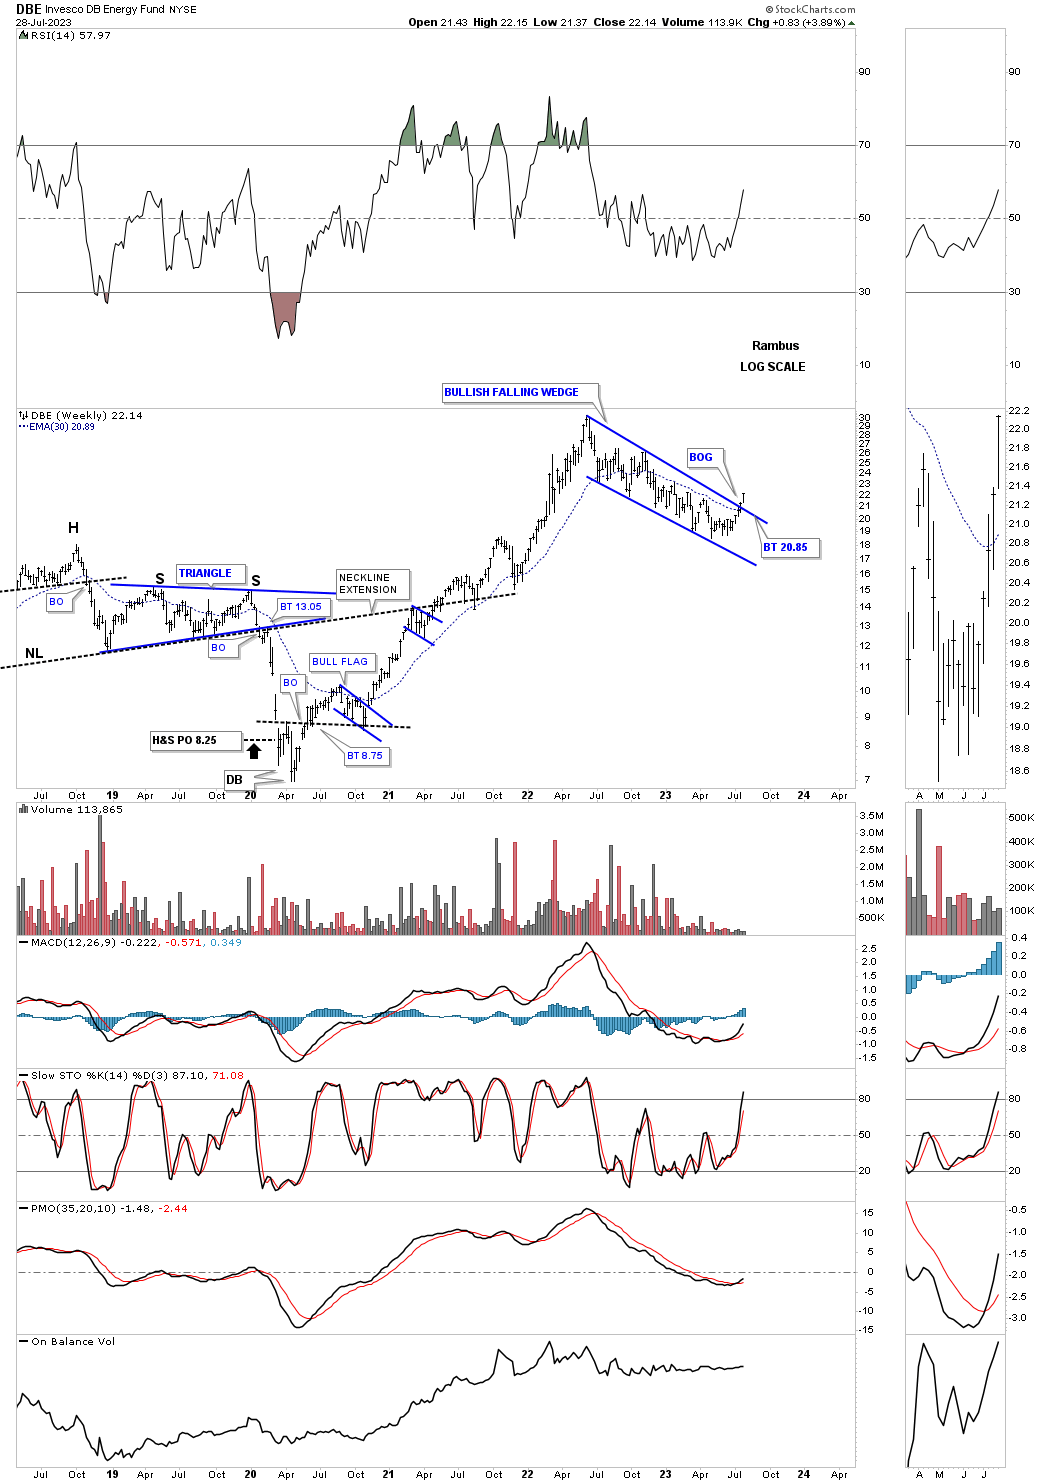
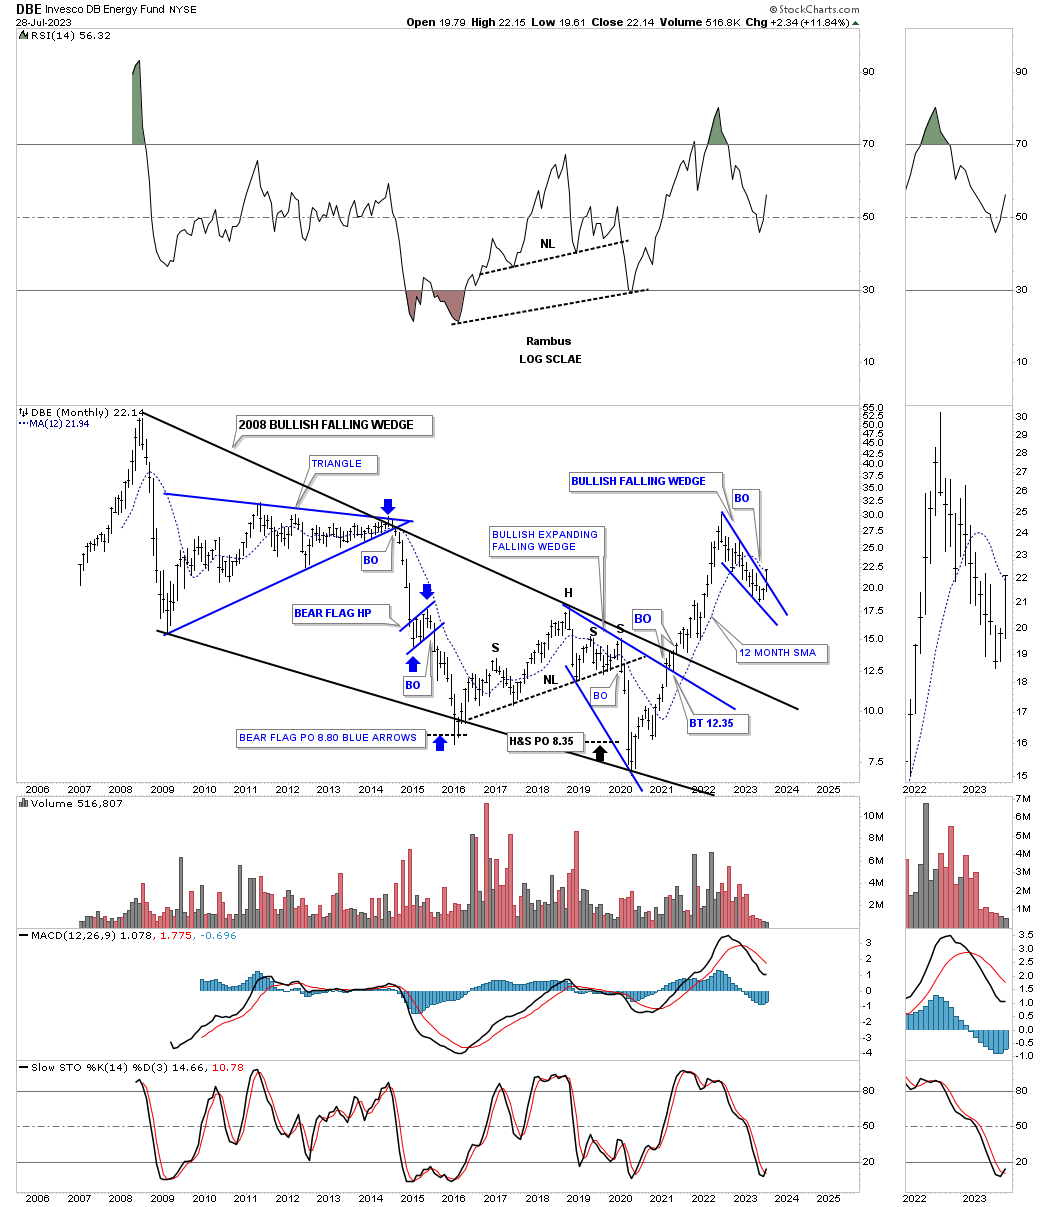
The DBE is an energy fund, which is attempting to breakout from its 2022 bullish falling wedge which looks a lot like the commodity indexes above.
This long term monthly chart going all the way back to the 2008 all time high shows the rally out of the 2020 crash low breaking out from the 2008 bullish falling wedge in one strong impulse move.
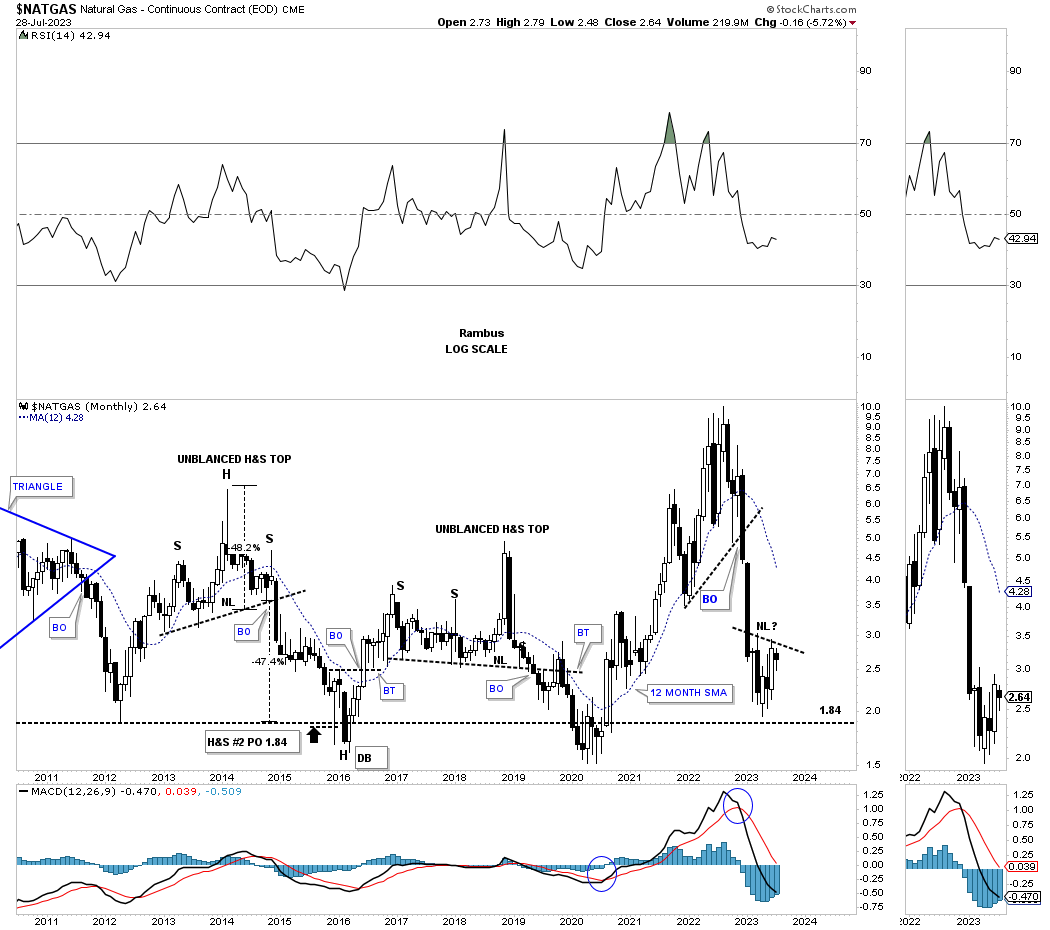
Natural Gas isn’t for the faint of heart as it can be extremely volatile. Earlier this year you can see the price action finding support where it has previously done three times since the 2012 low. It could also be forming a H&S bottom on top of the black dashed support line around the 1.84 area.
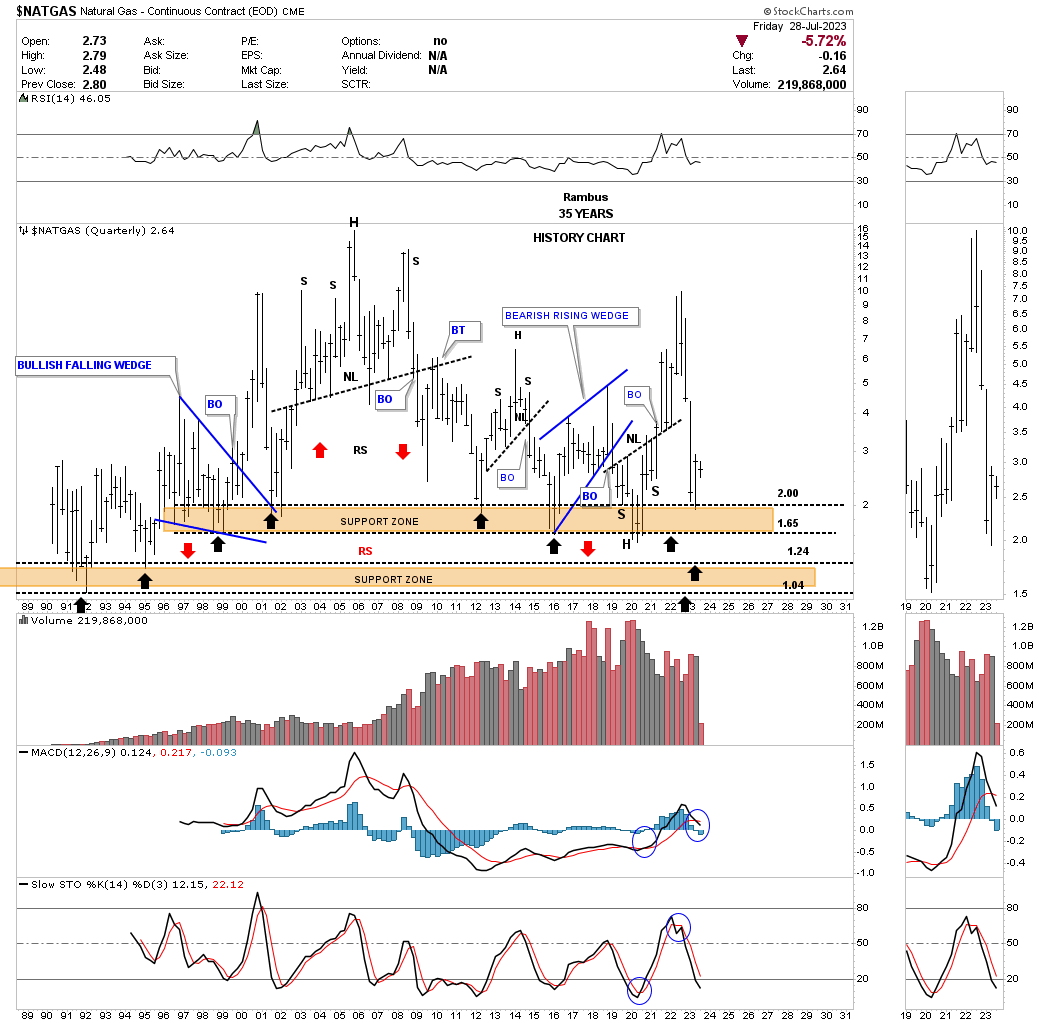
Below is the quarterly history chart for Natural Gas showing the brown shaded support zones.
The WTIC likes to form large trading ranges and once they are completed it spends little time fooling around.
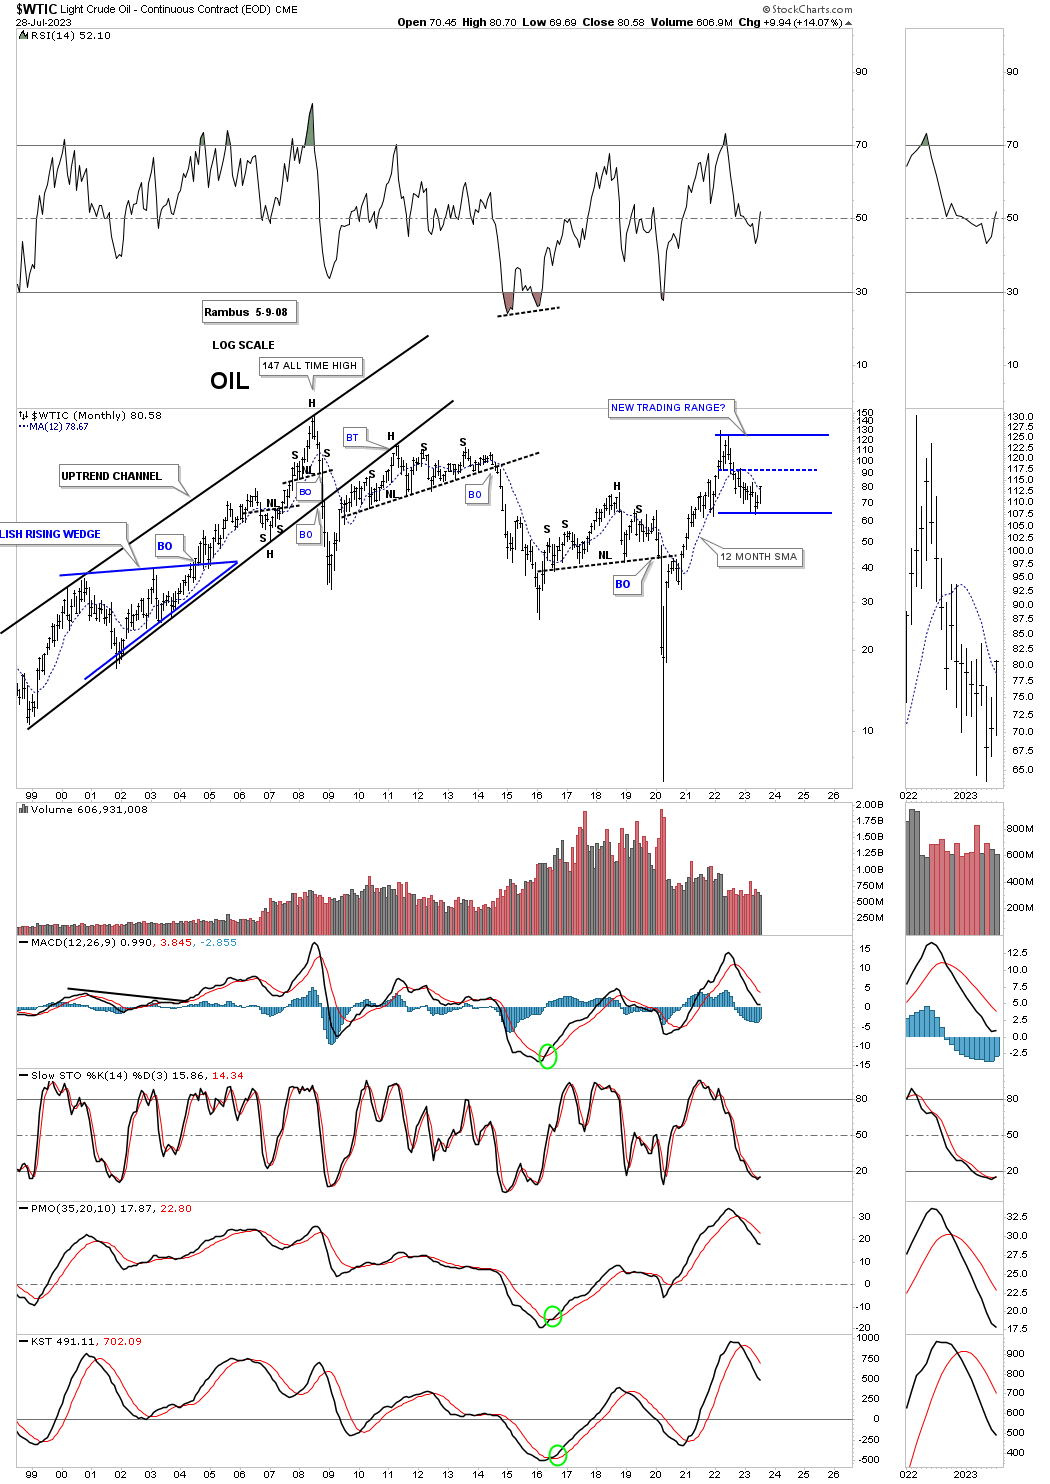
Once the price action rose above the brown shaded S&R zone the WTIC has been taking its time backtesting it from above forming a fairly large bullish expanding falling wedge.
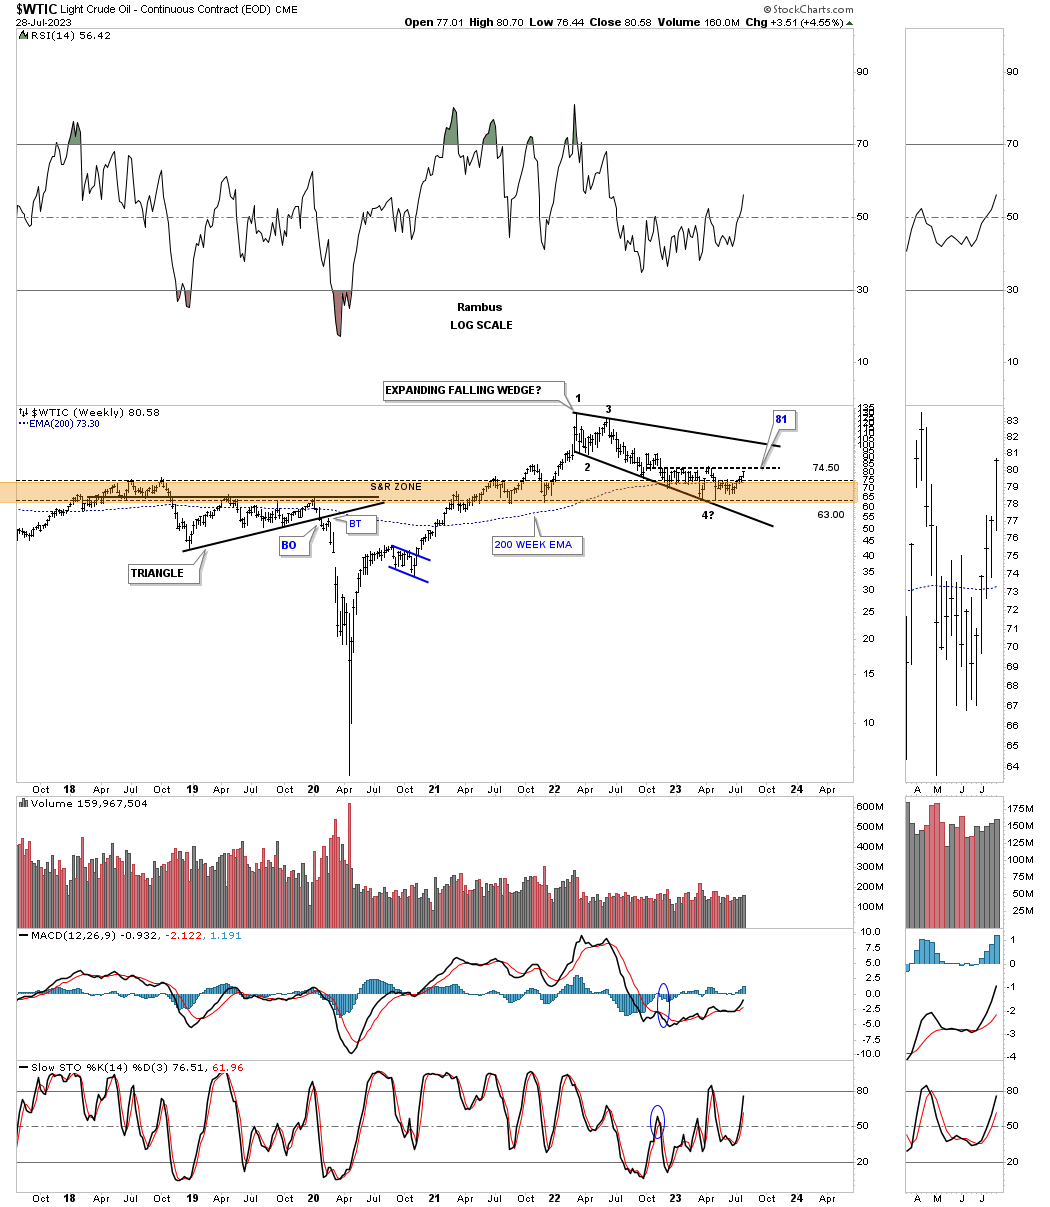
Note how the recent low formed on top of the blue rectangle for the second time as a backtest.
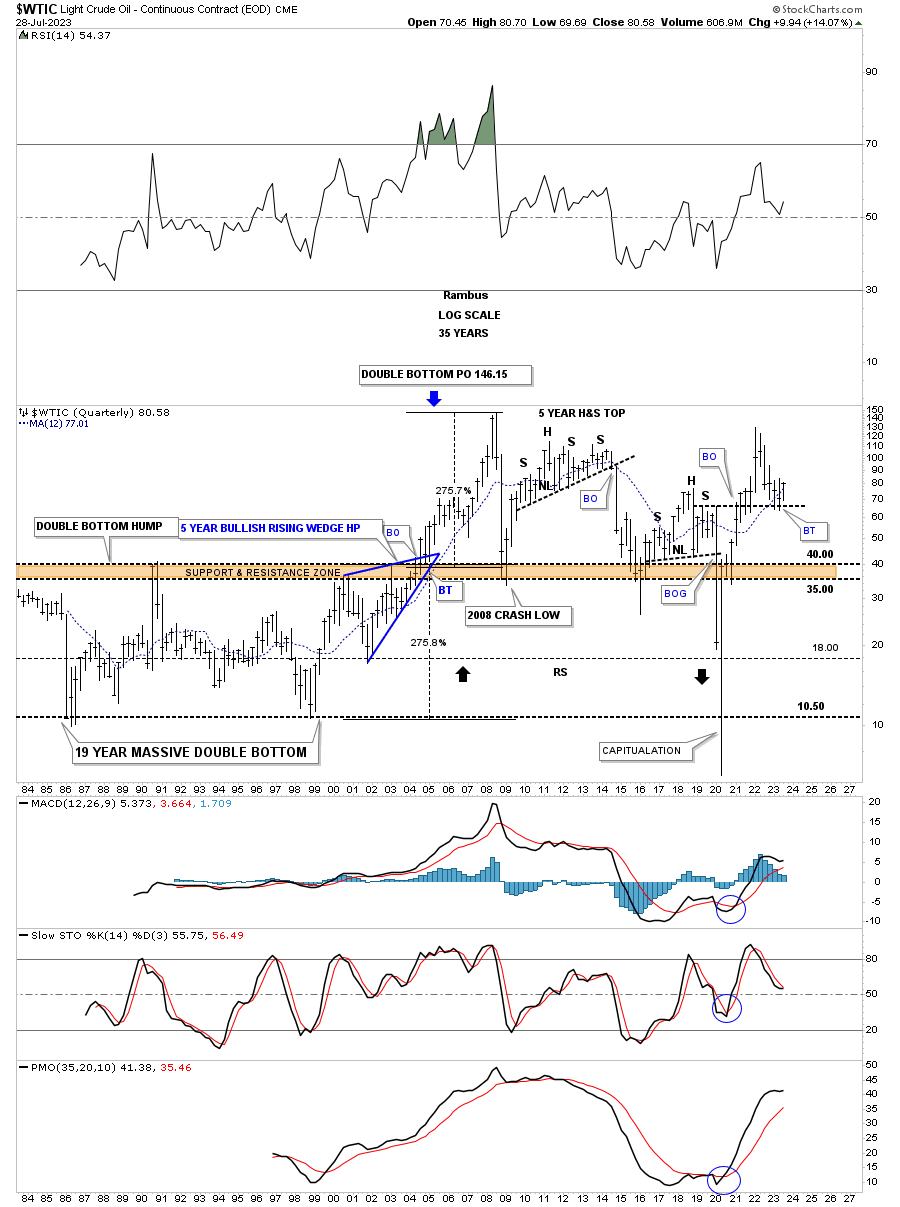
The old quarterly history chart for the WTIC shows the very large trading ranges from consolidation patterns to reversal patterns. Note the massive double bottom price objective which ended up showing the all time high back in 2008 at the 147 area.
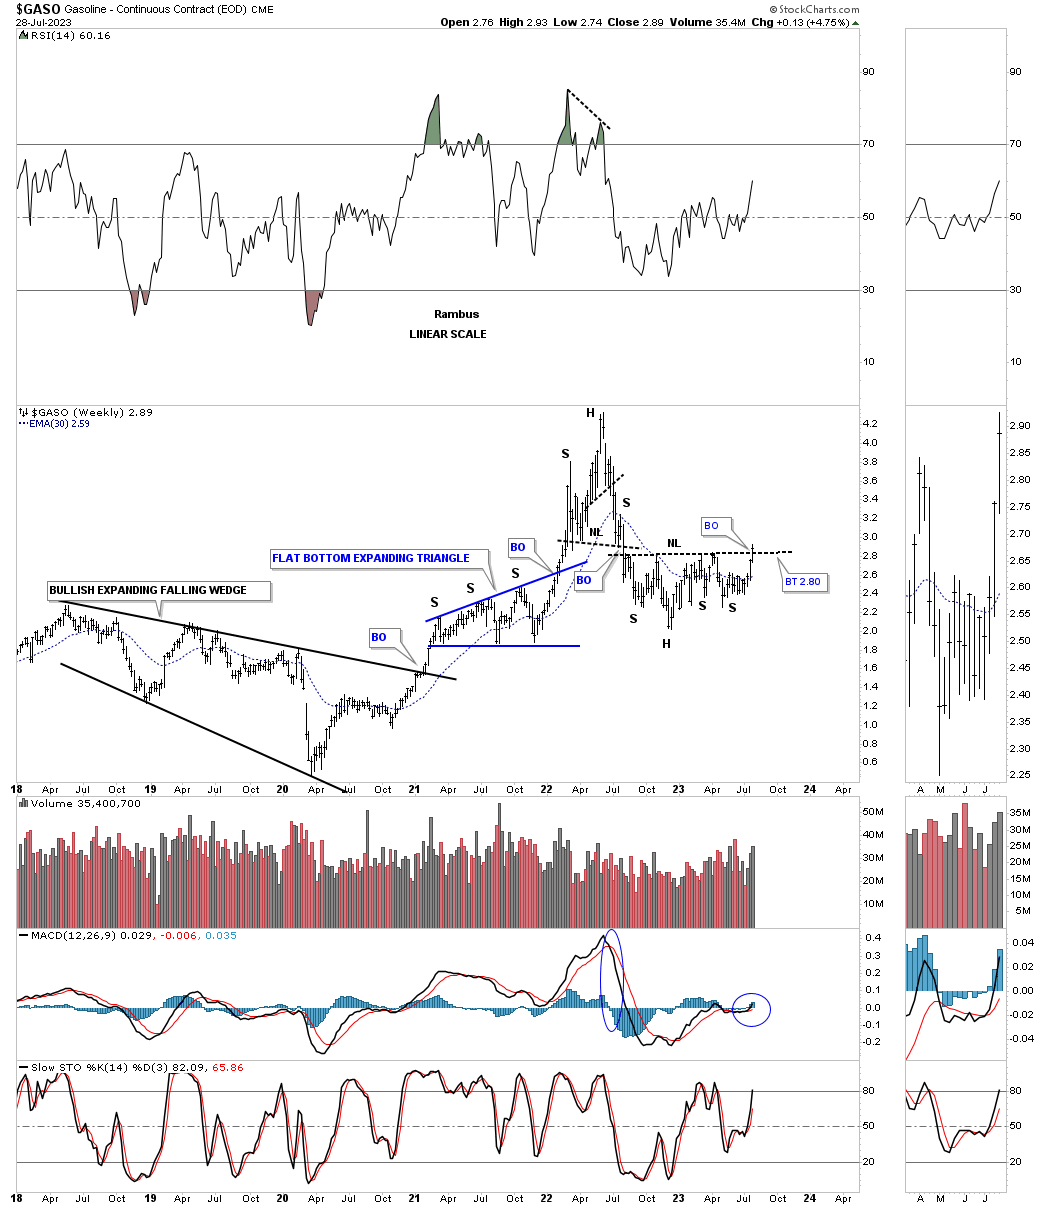
GASO, gasoline, is attempting to breakout from the nearly one year H&S bottom.
This weekly chart for the XOI, big cap oil stocks index, has found support on the bottom rail of its 2022 triangle.
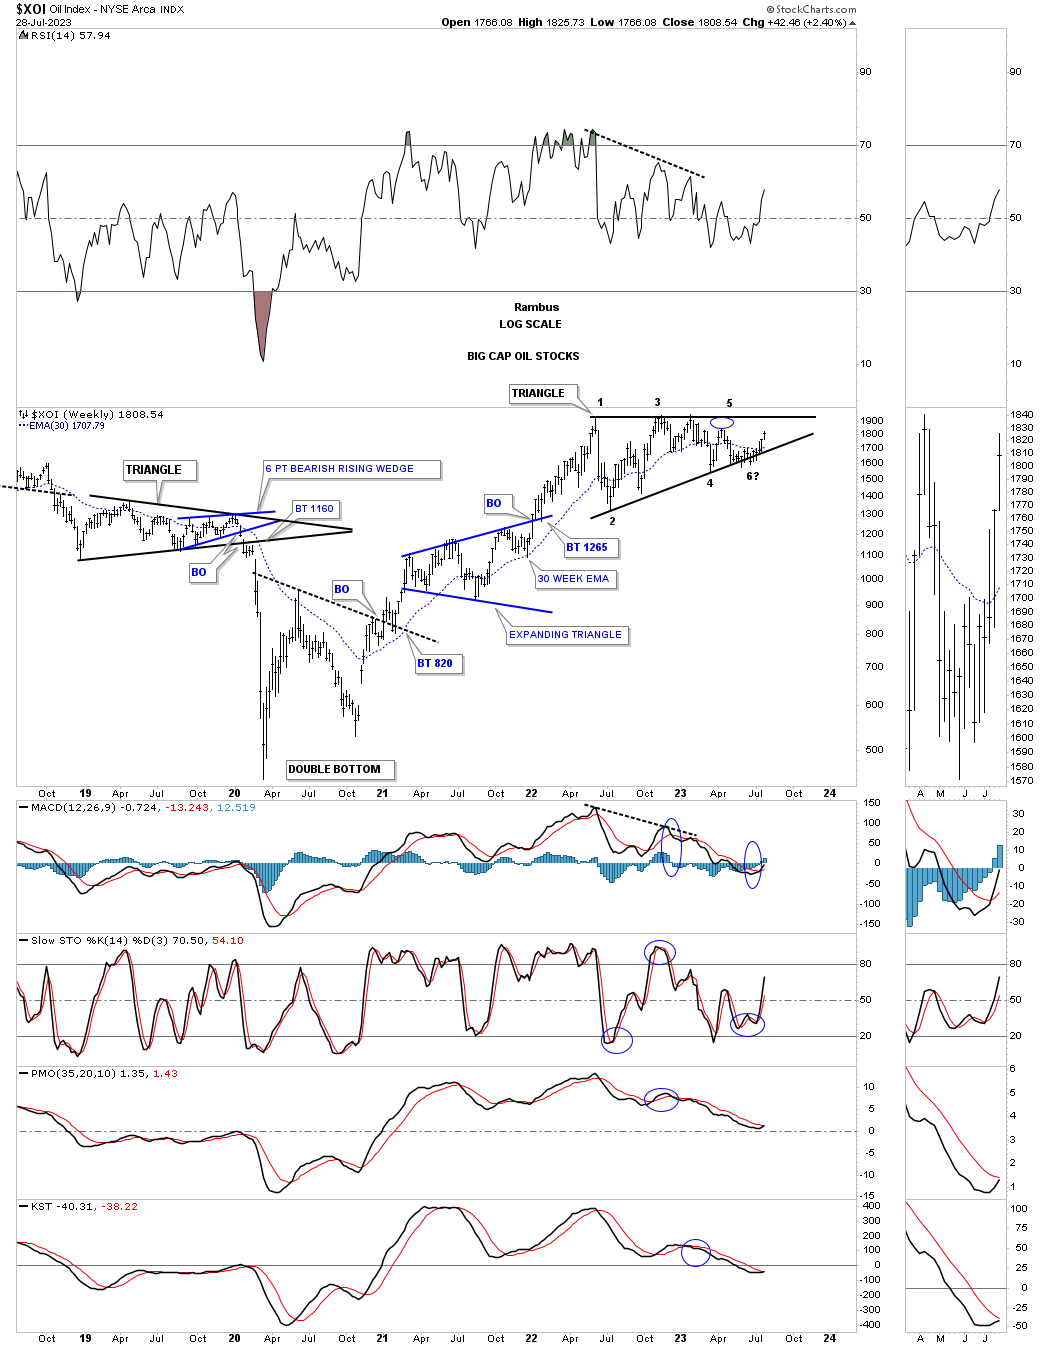
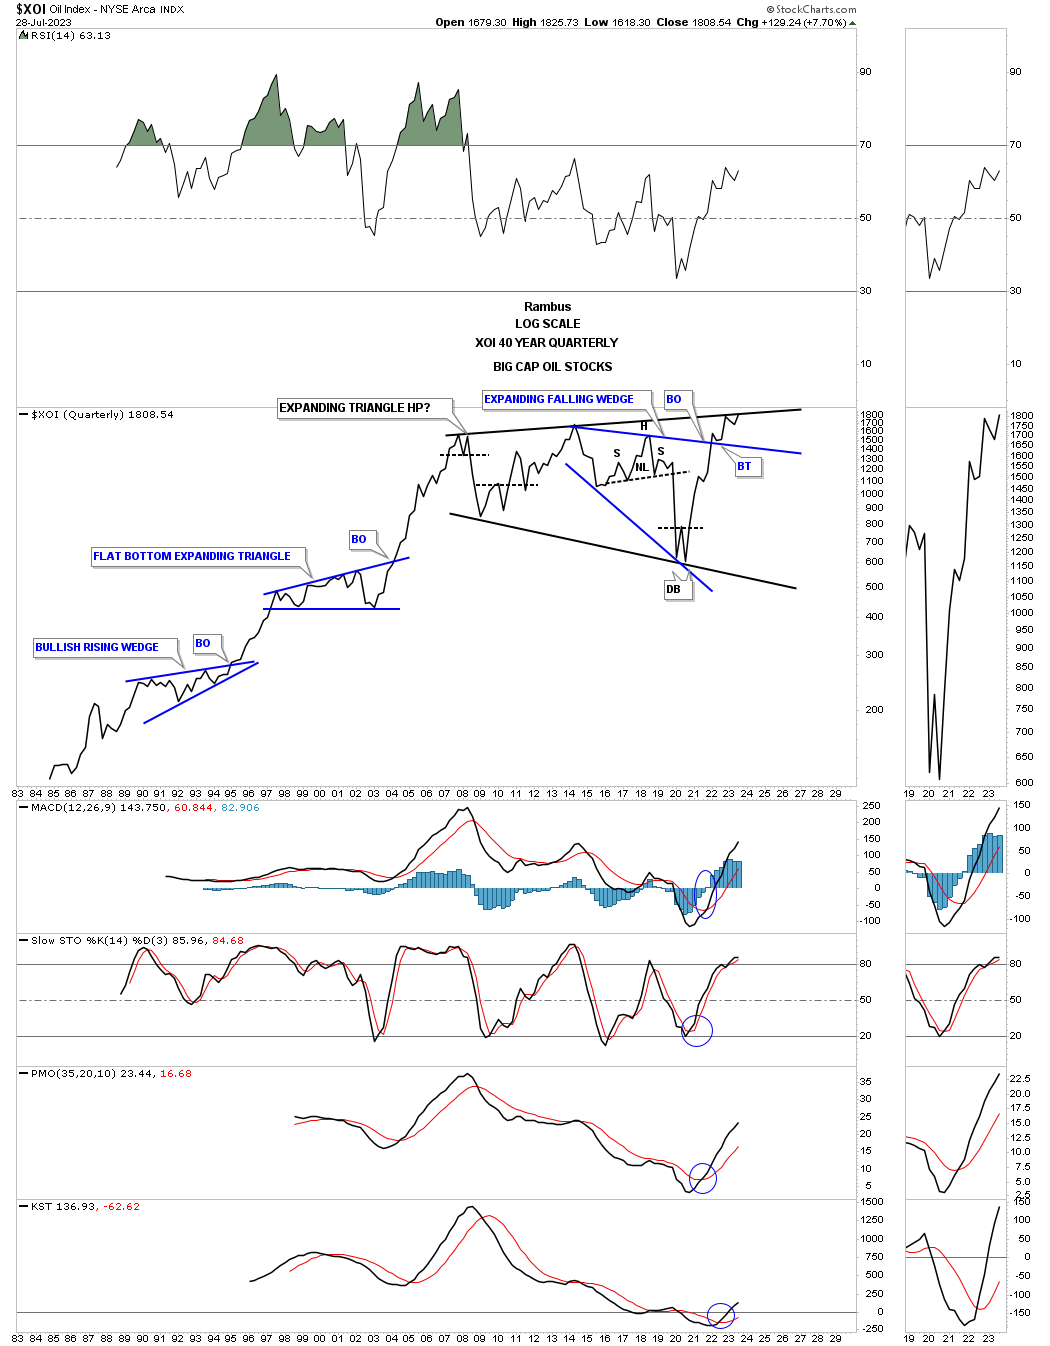
On a quarterly closing basis the XOI is very close to closing at a new all time high with 2 more months to go before the end of the 3rd quarter.
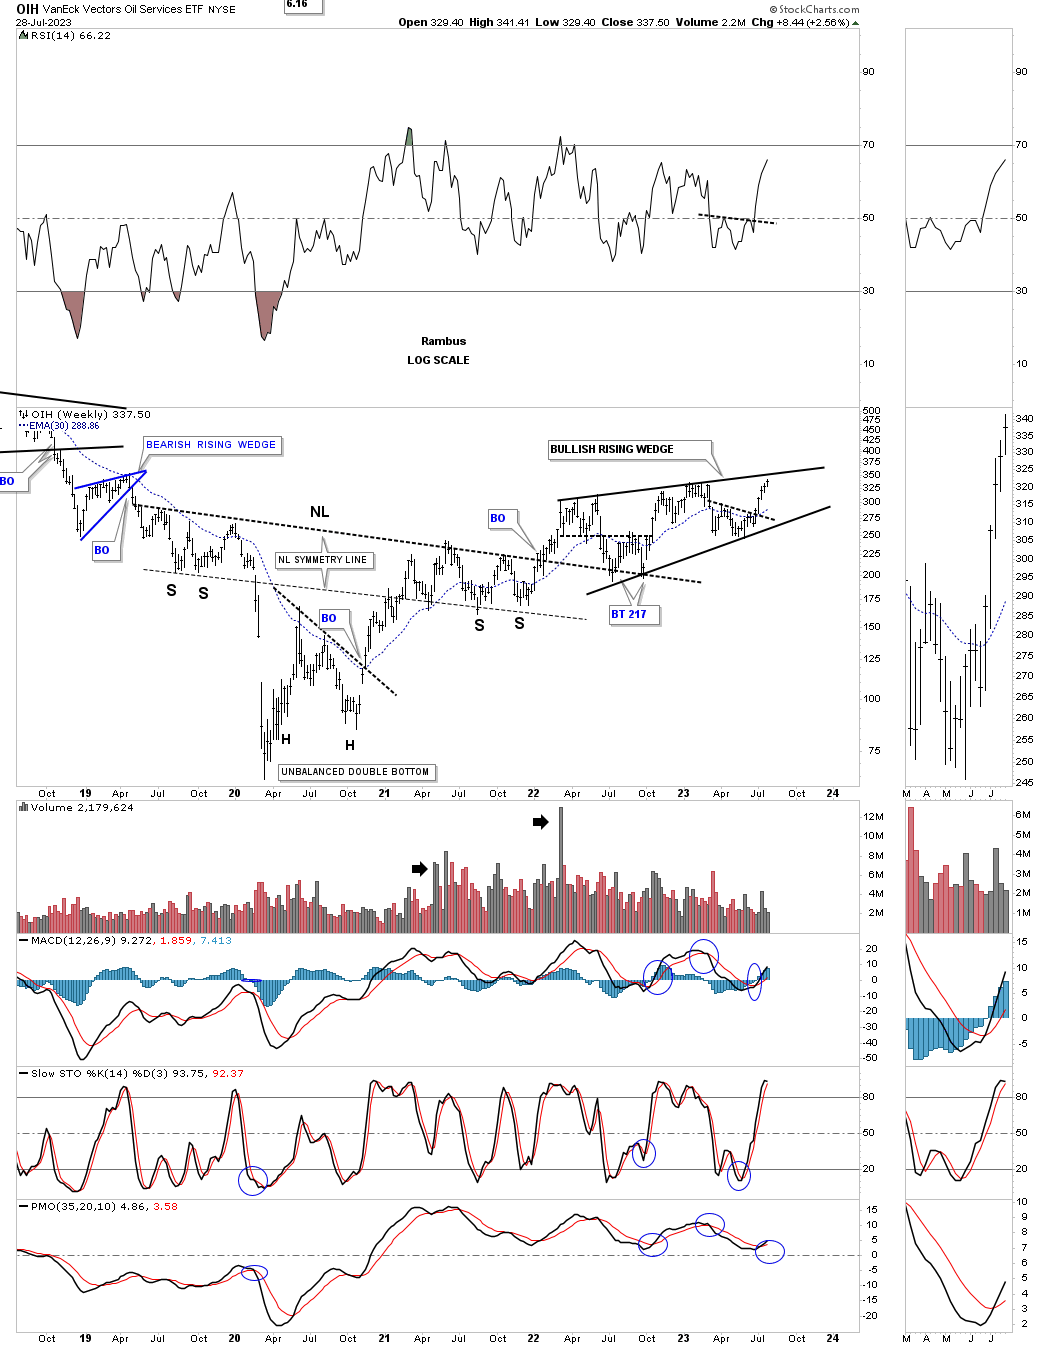
The OIH, oil services etf, created a large H&S bottom after the rally out of its 2020 low which formed the head. There have been several backtests to the neckline which have held support with the possible bullish rising wedge forming on top of the neckline.
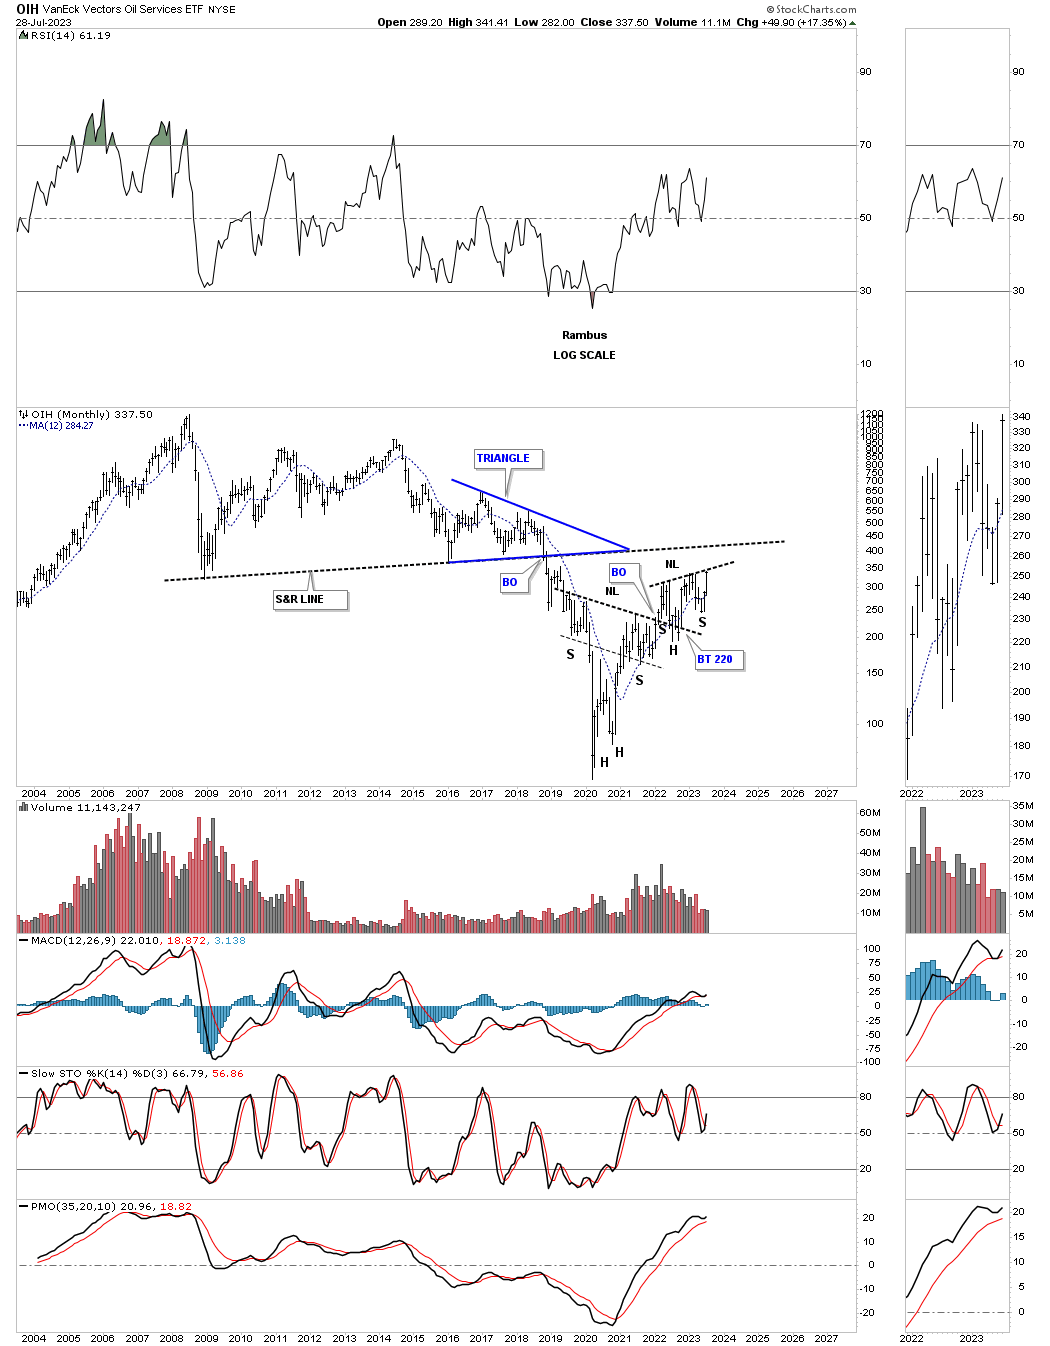
A slightly different look using the long term monthly chart.
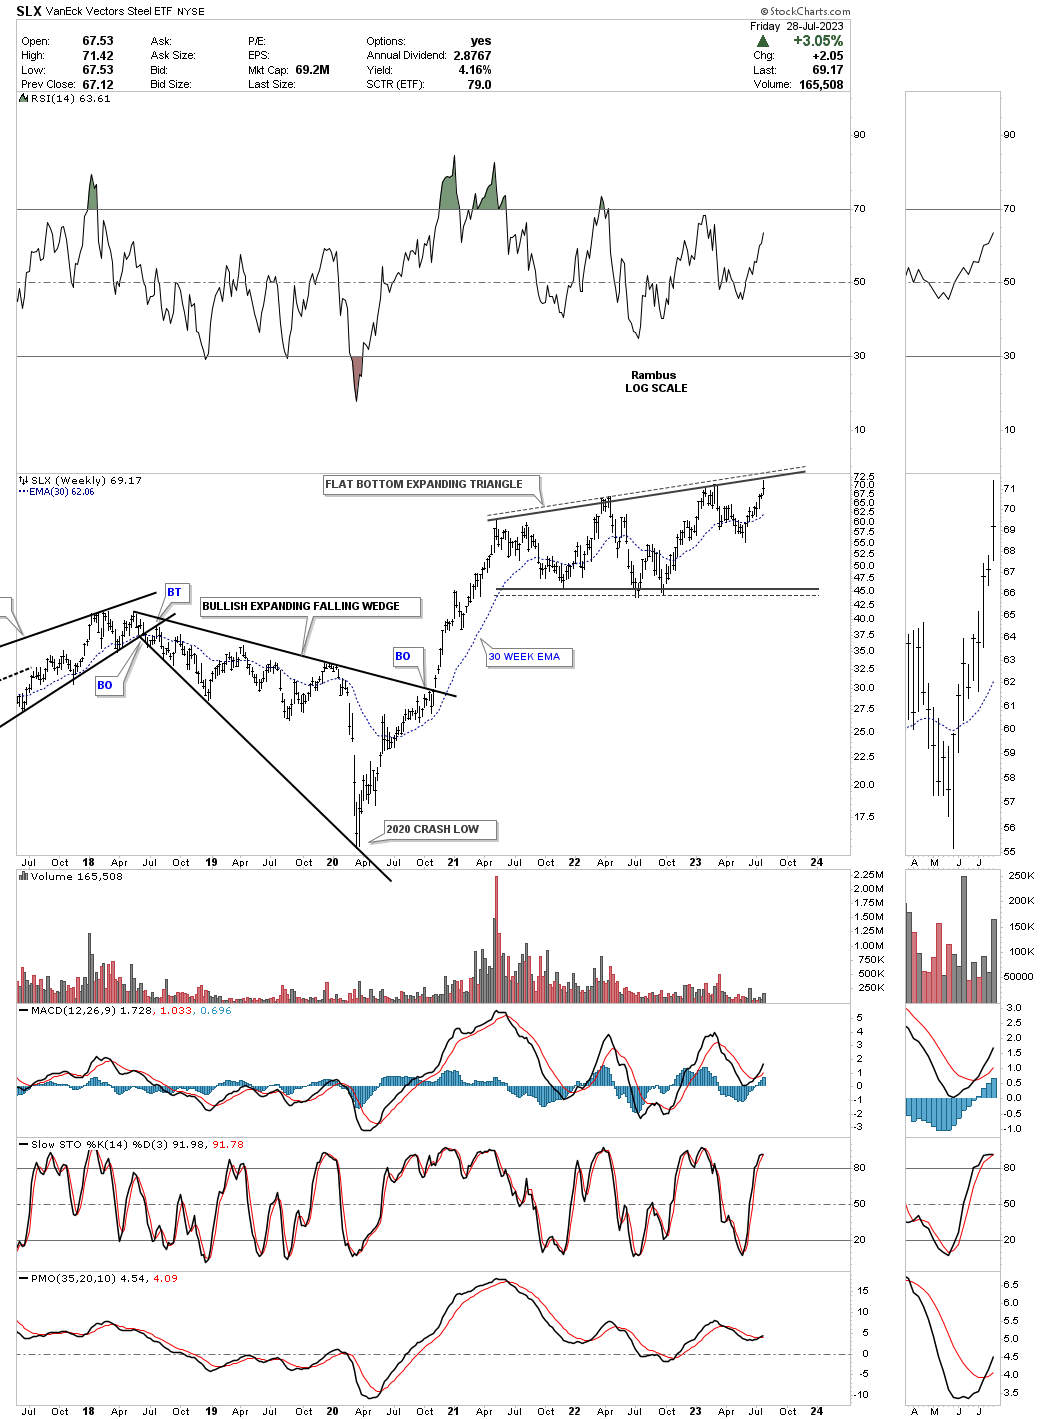
SLX, steel etf, has been forming a large flat bottom expanding triangle as its first consolidation pattern after its strong impulse move out of the the 2020 low. This weekly chart shows a good example of the 2018 bullish expanding falling wedge which are generally one of the most bullish chart patterns there is. When going through these commodity charts you will see many bullish expanding falling wedges which have led to some powerful impulse moves..
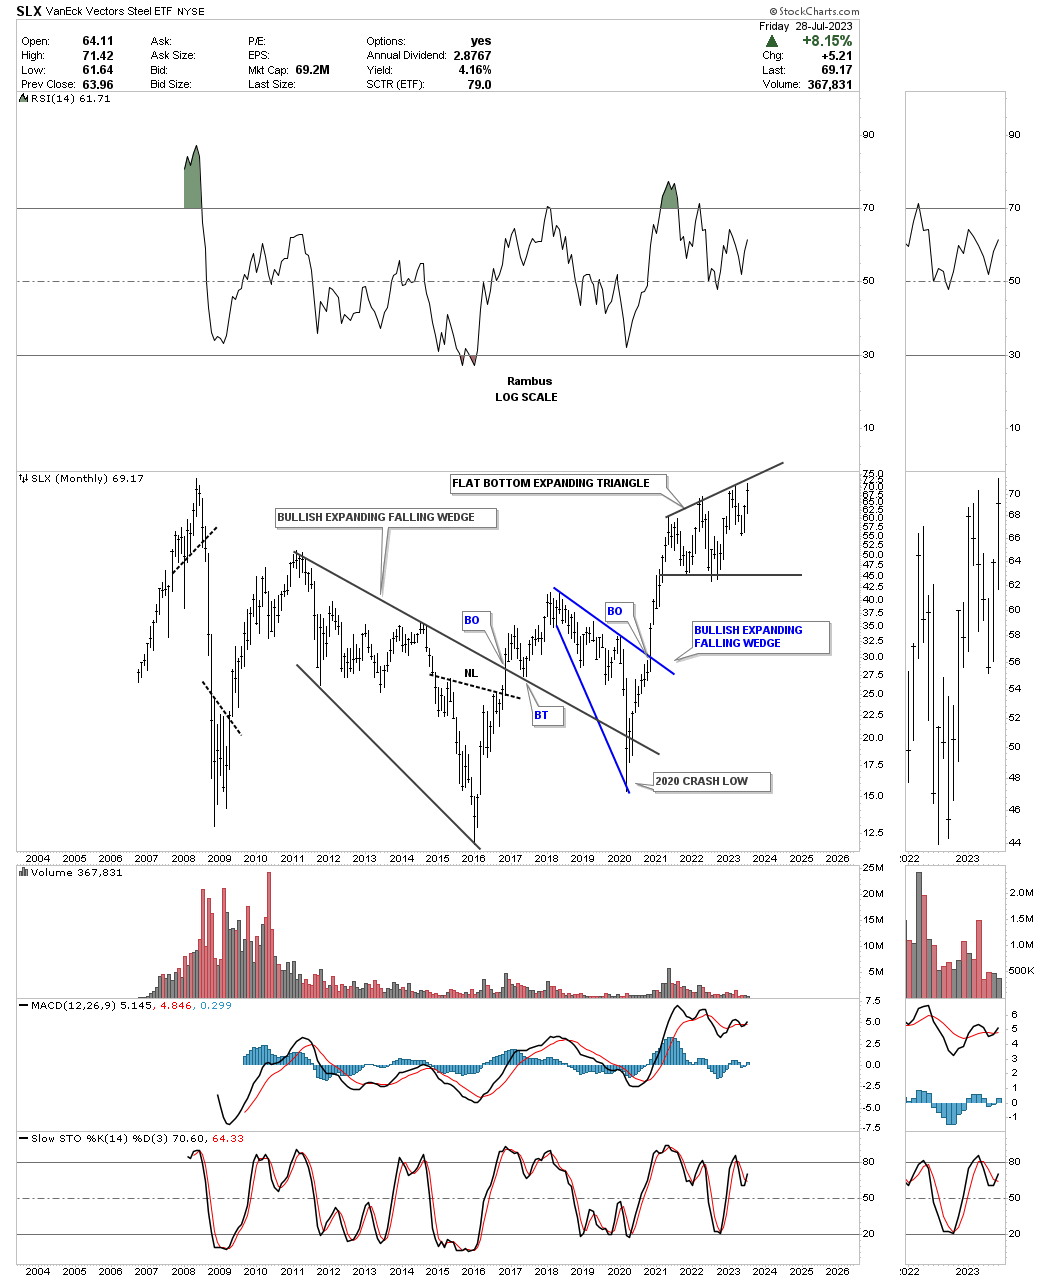
The SLX history chart.
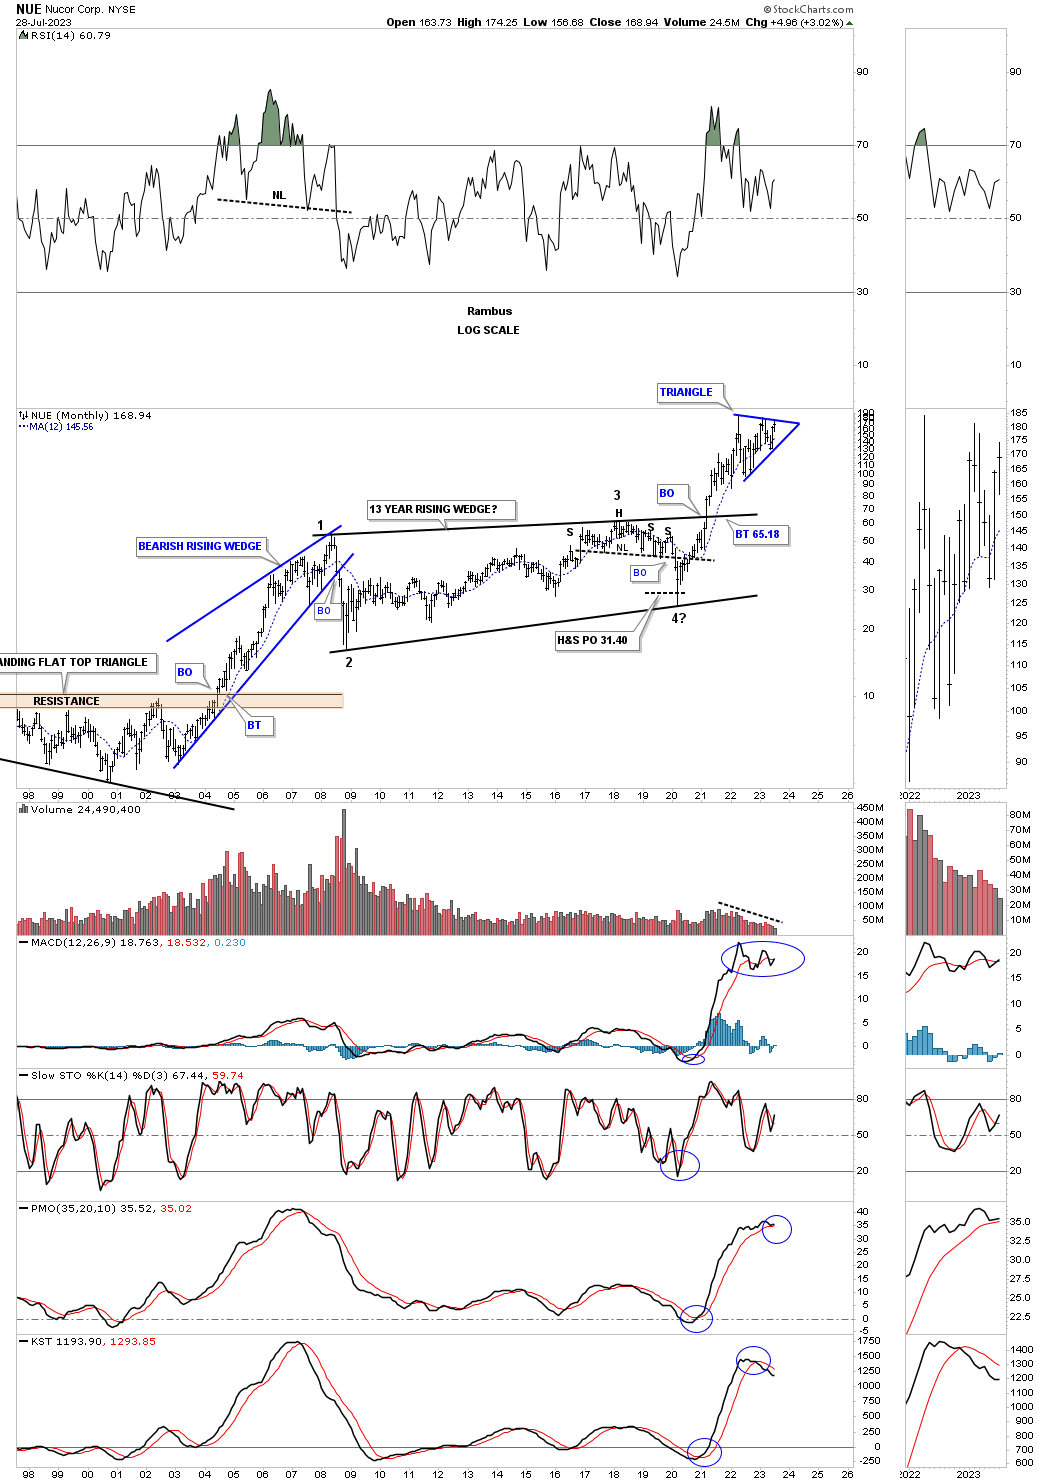
NUE, Nucor steel stock, is close to completing its 2022 triangle consolidation pattern after breaking out from its 2008 bullish rising wedge.
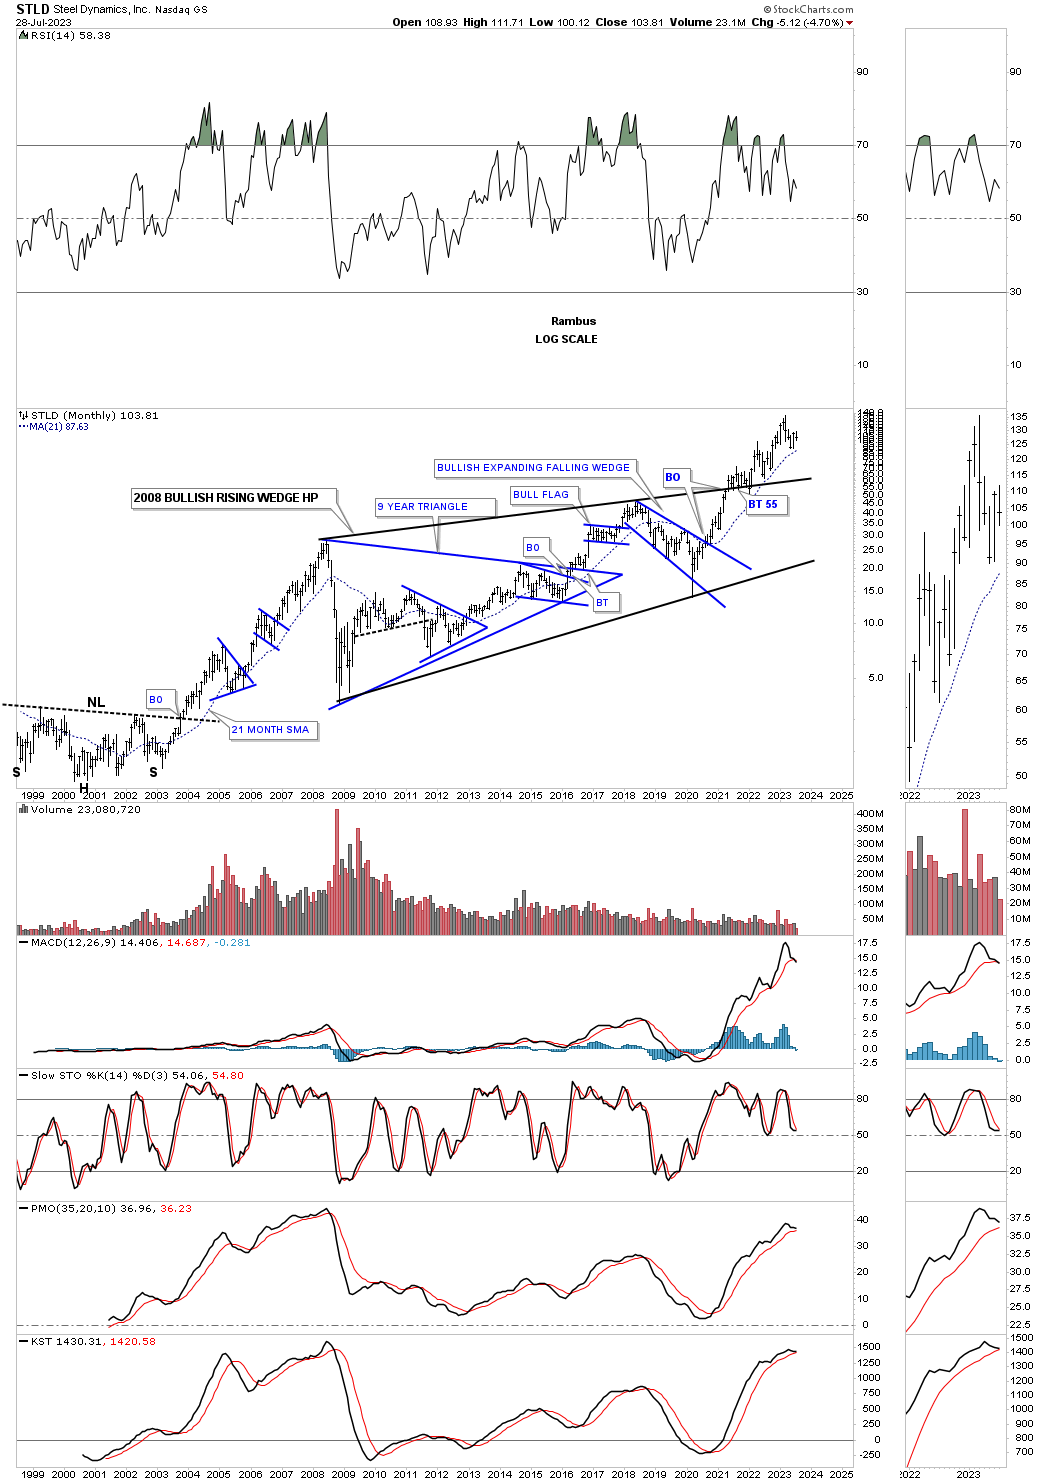
STLD, Steel Dynamics, also broke out from a very large 2008 bullish rising wedge and has been in backtest mode for the last couple of years.
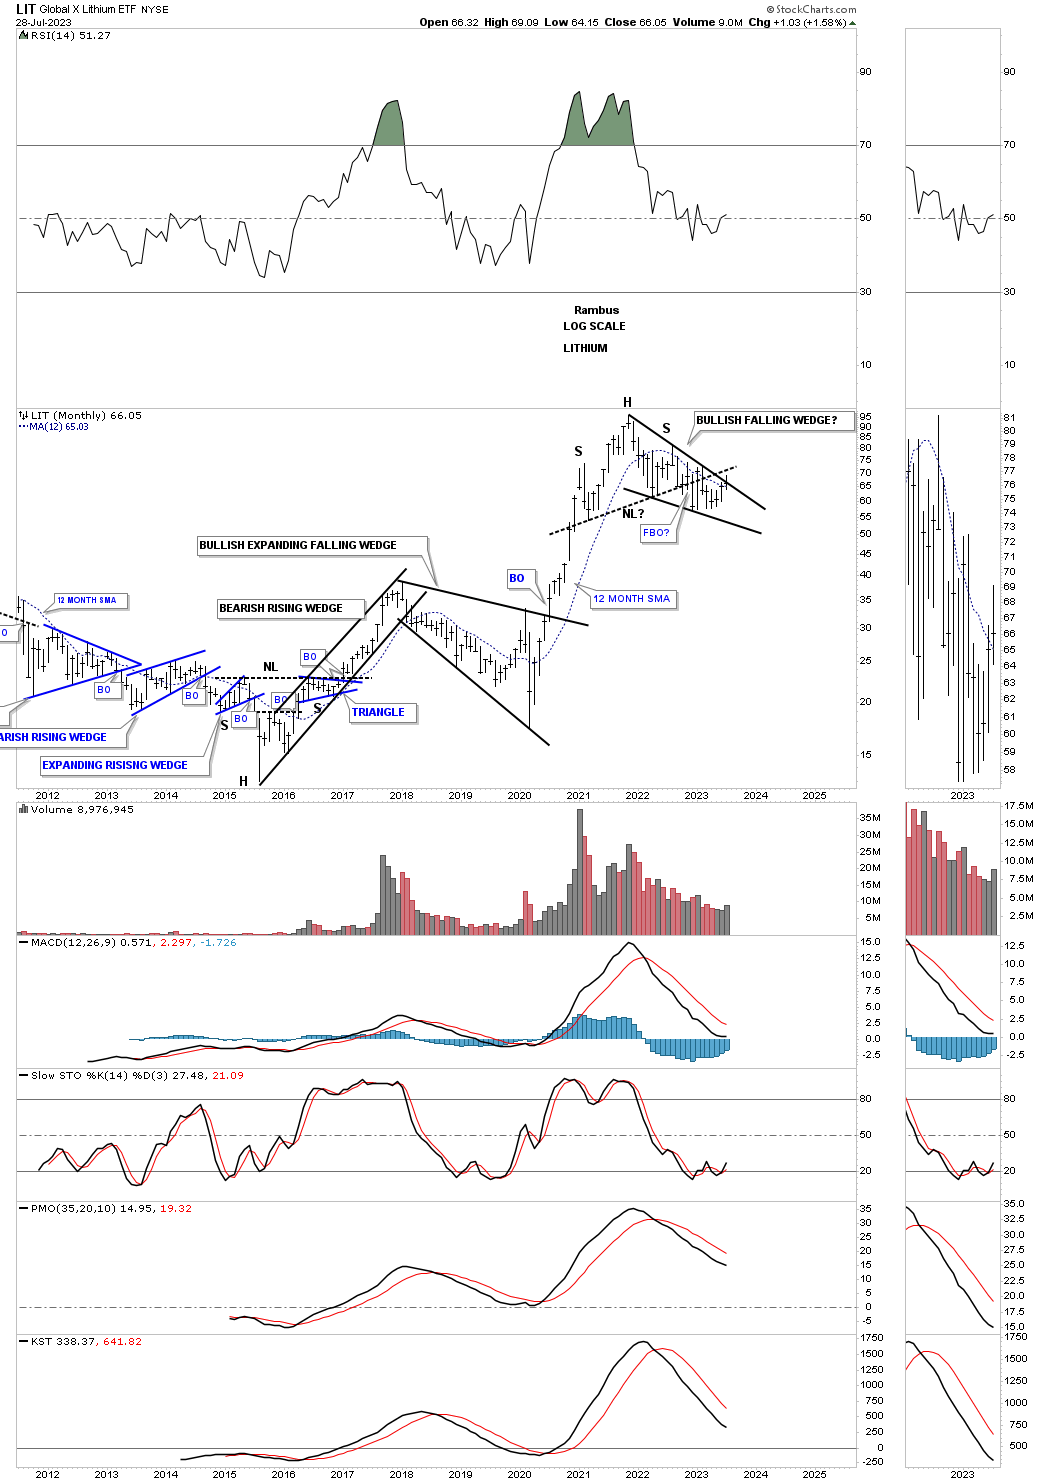
This weekly chart for LIT, Lithium etf, shows a possible bullish falling wedge under construction.
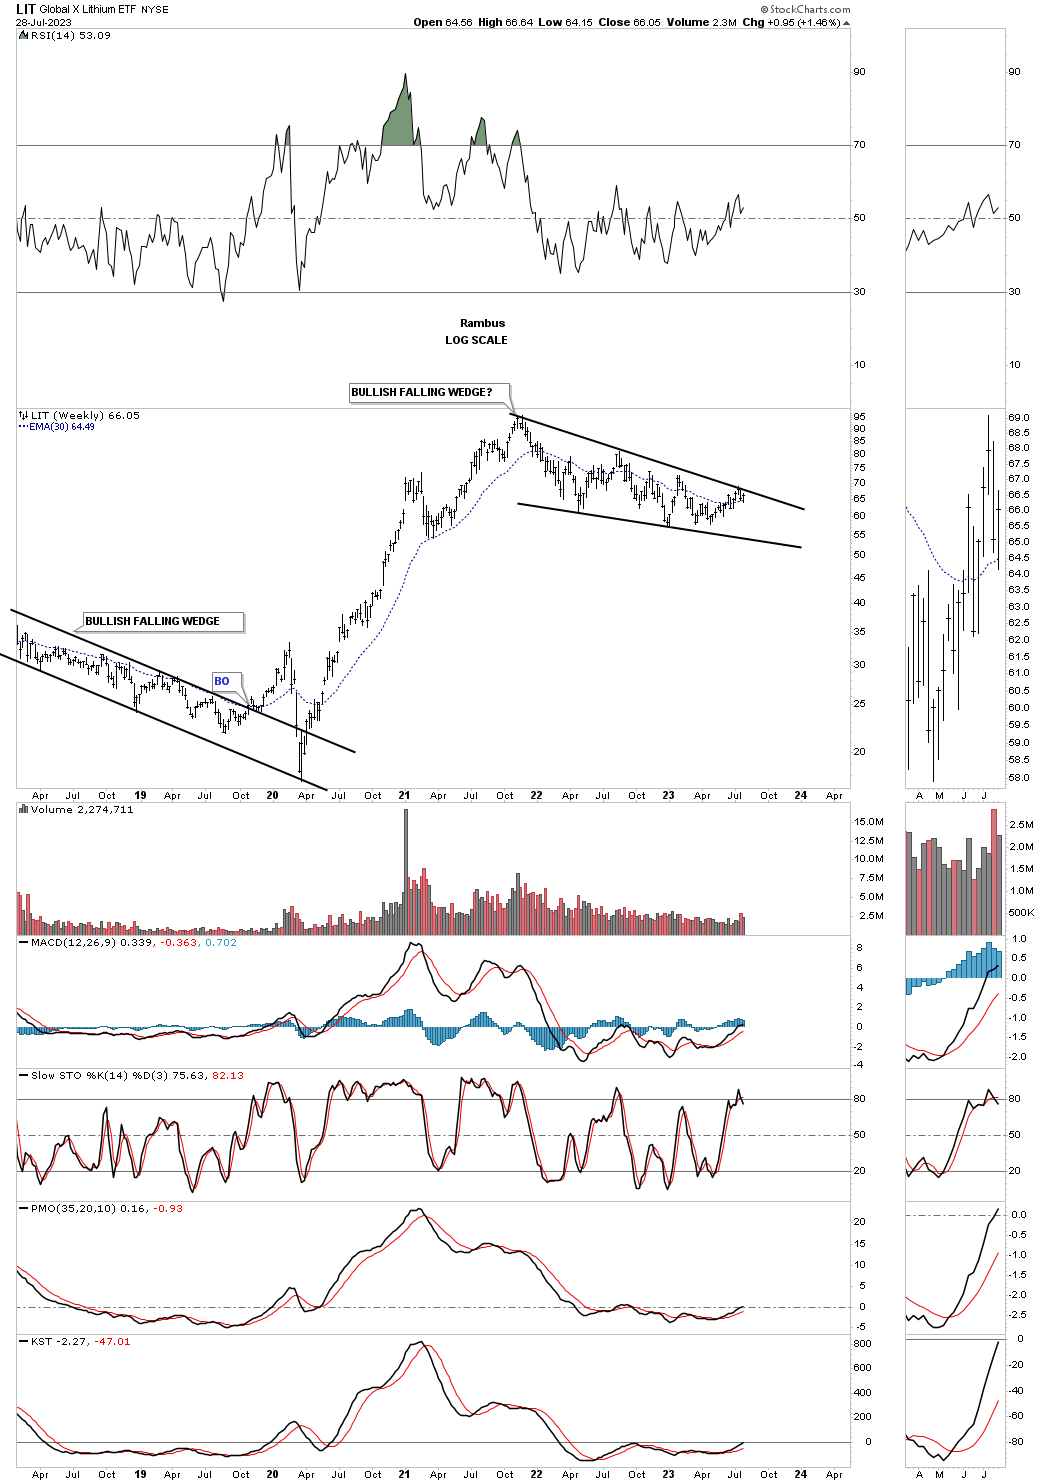
From the longer term perspective it still looks like a mixed bag. After its 2020 rally ended I had drawn in a possible H&S top. If the price action can trade back above the neckline that would open up the door for the possible bullish falling wedge.
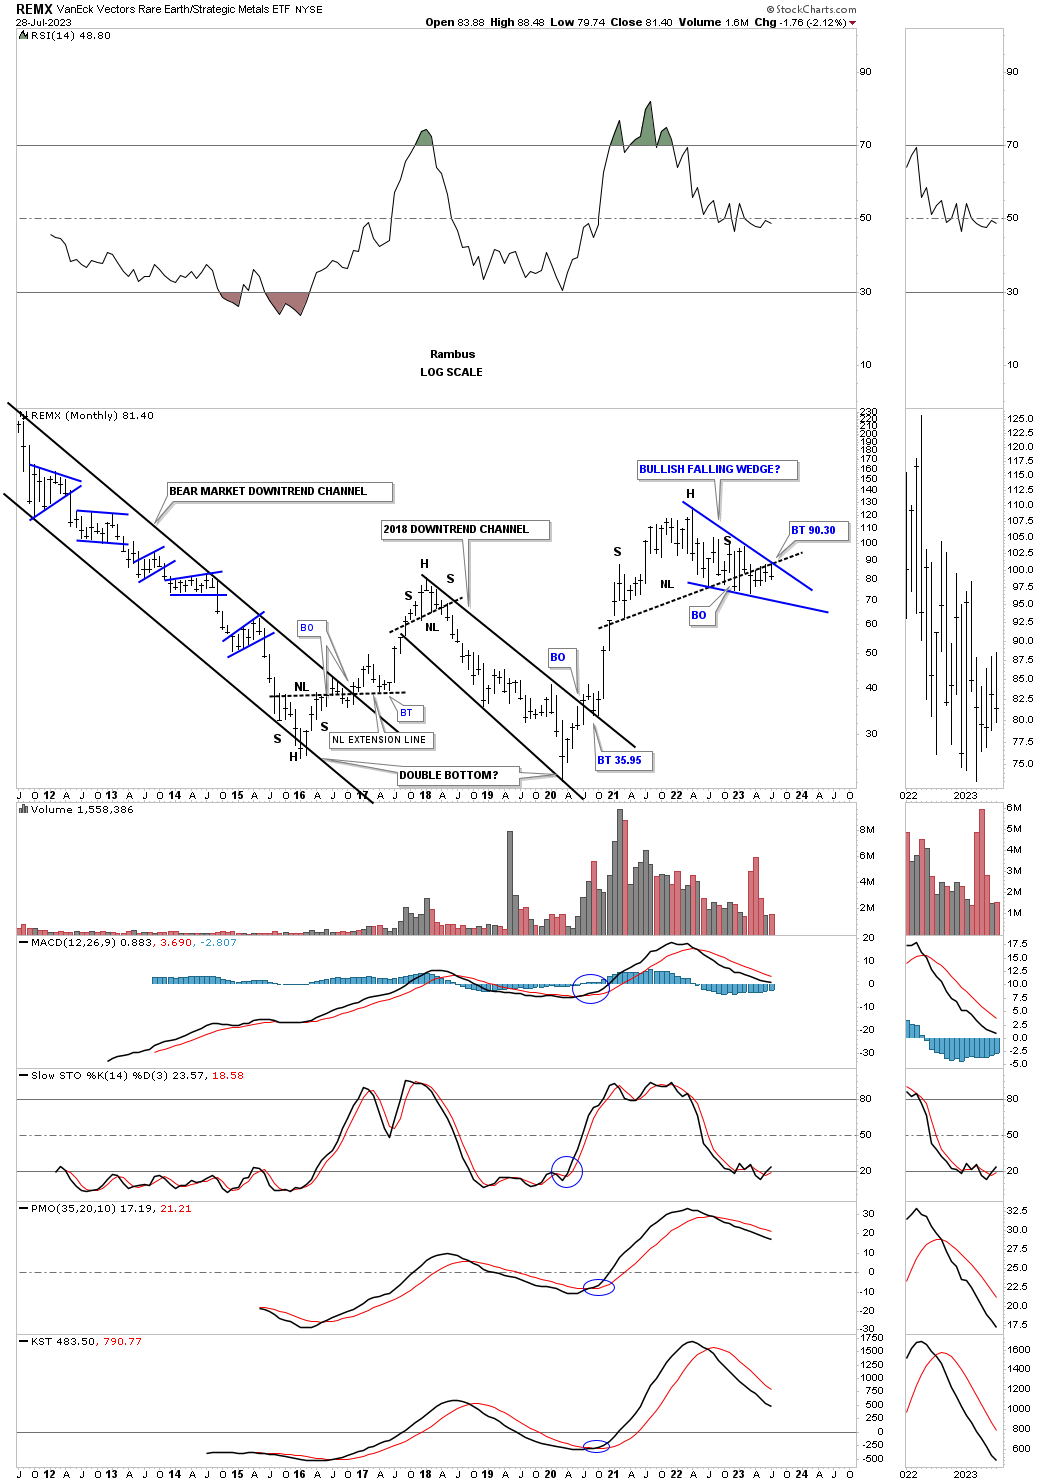
This history chart for REMX, rare earth etf, shows a similar setup to the LIT chart above.
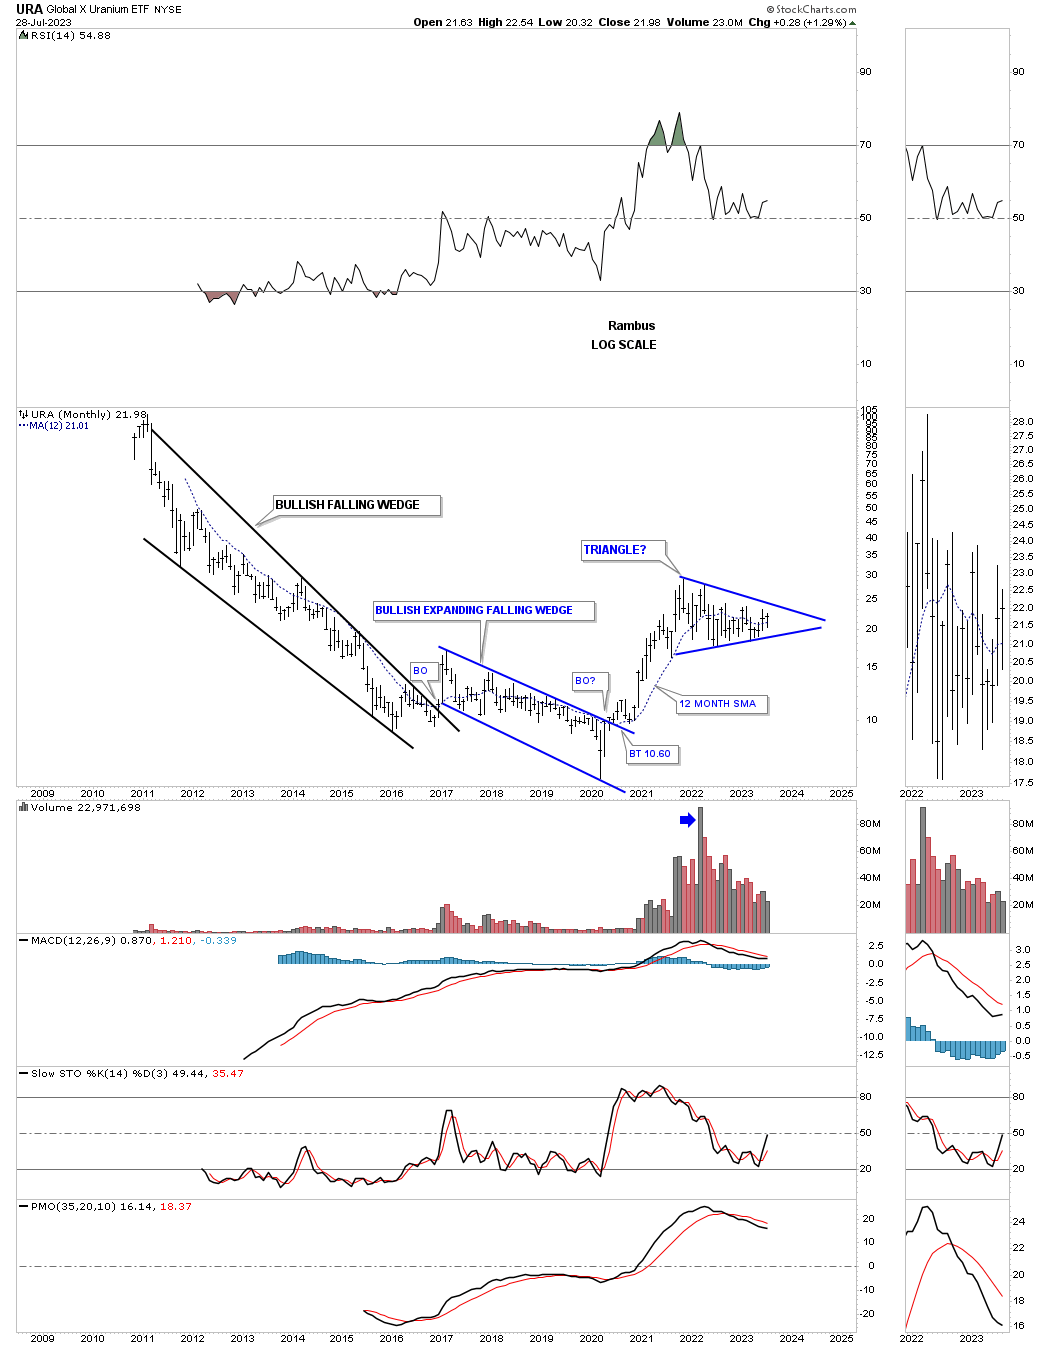
This weekly chart for the URA, Uranium Fund, shows its sideways trading range since it 2020 rally.
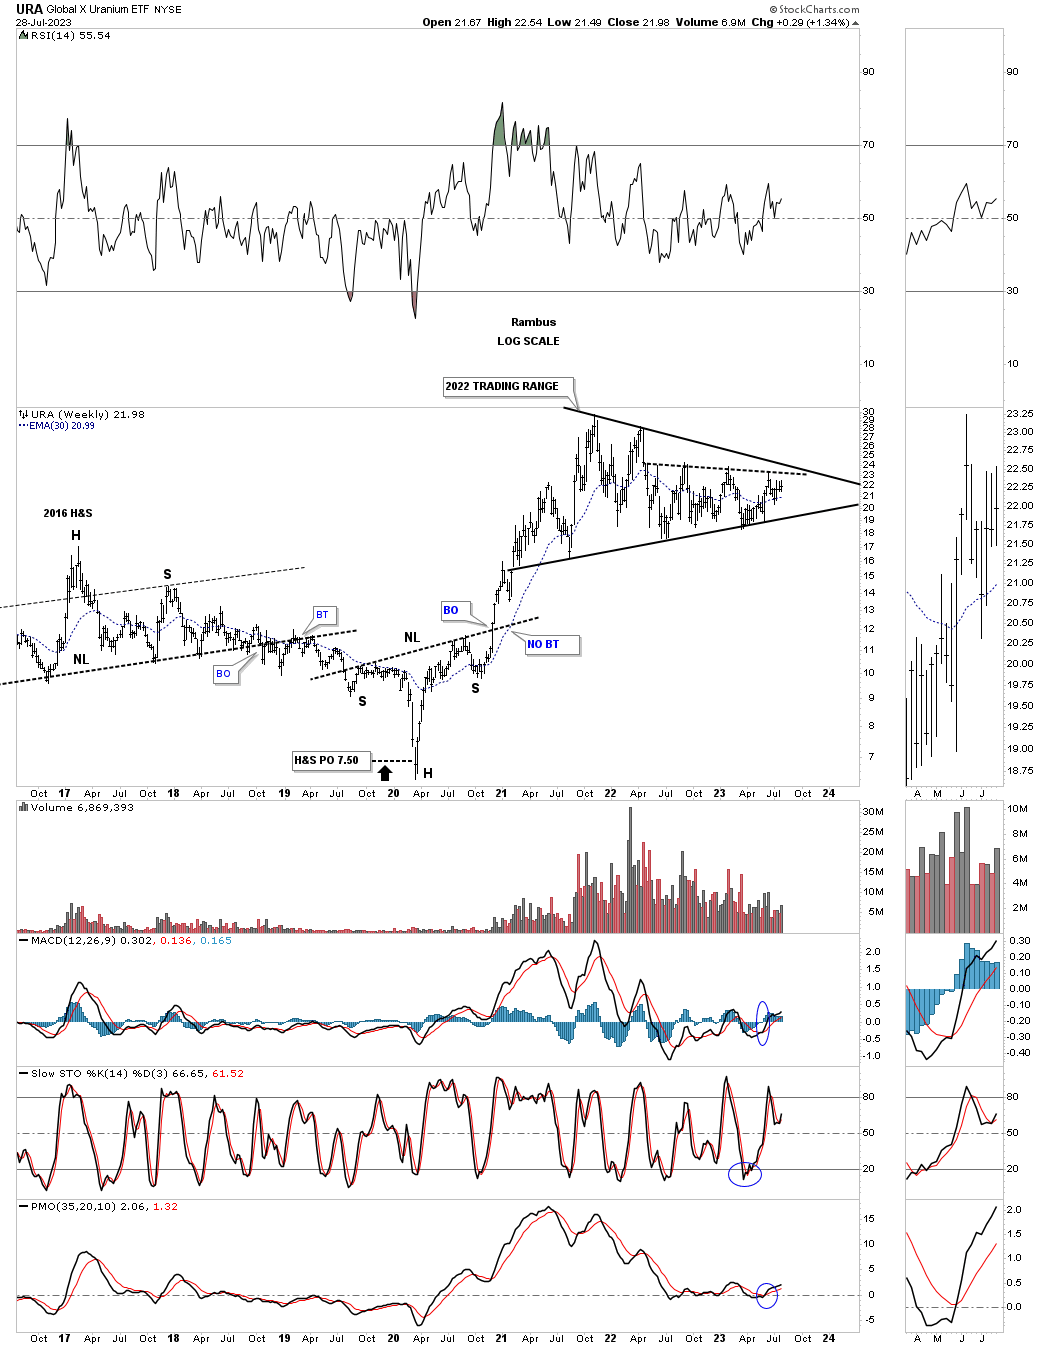
The history chart for URA.
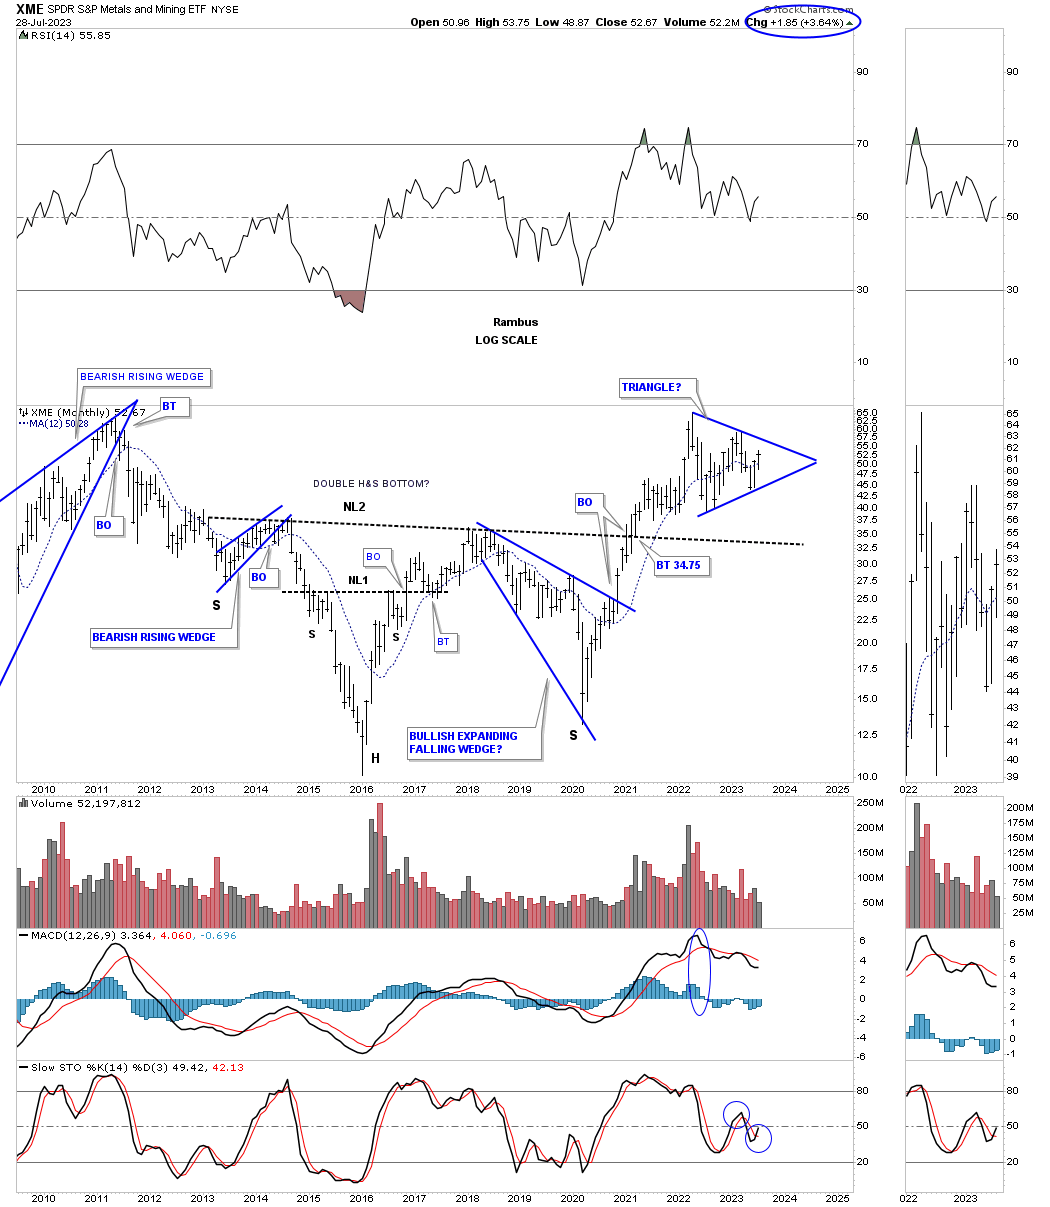
This next area we’ll look at is the XME, metals and mining etf, which is going to play a big role in the mining of all the different metals. Similar to the XLB we looked at earlier it too is forming a blue triangle above its very large H&S bottom neckline.
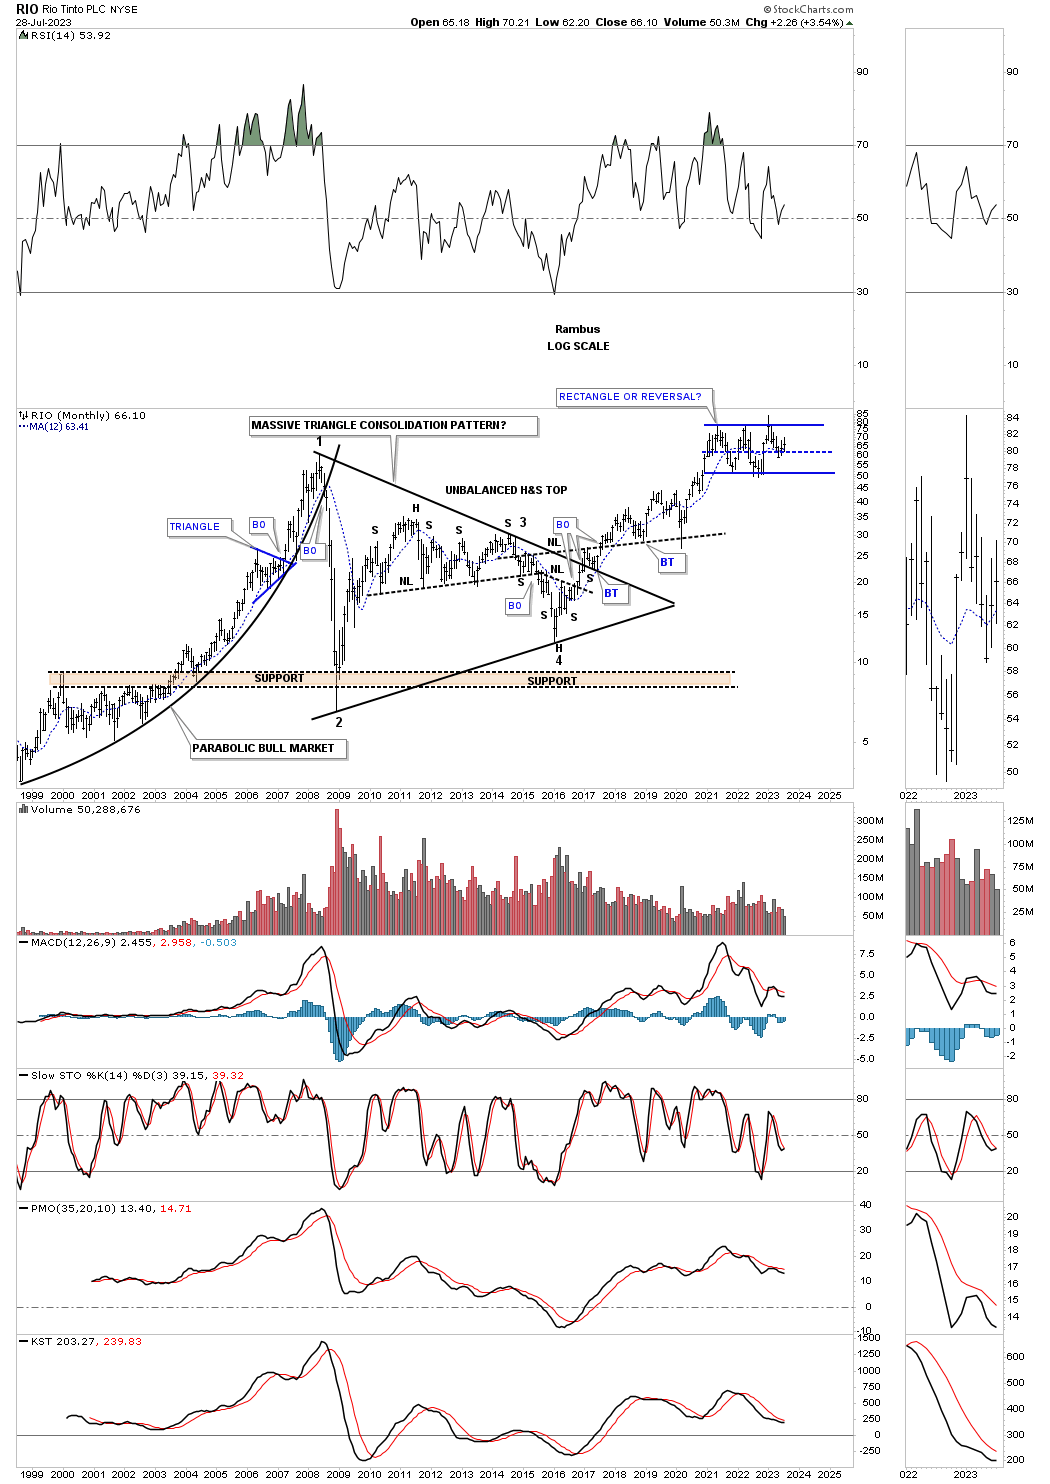
RIO, one of the biggest miners is the world, has been forming the blue rectangle consolidation pattern at its all time highs with the last reversal point coming in at the center dashed midline of its blue rectangle which can often times be the last reversal point before the next impulse move takes hold.
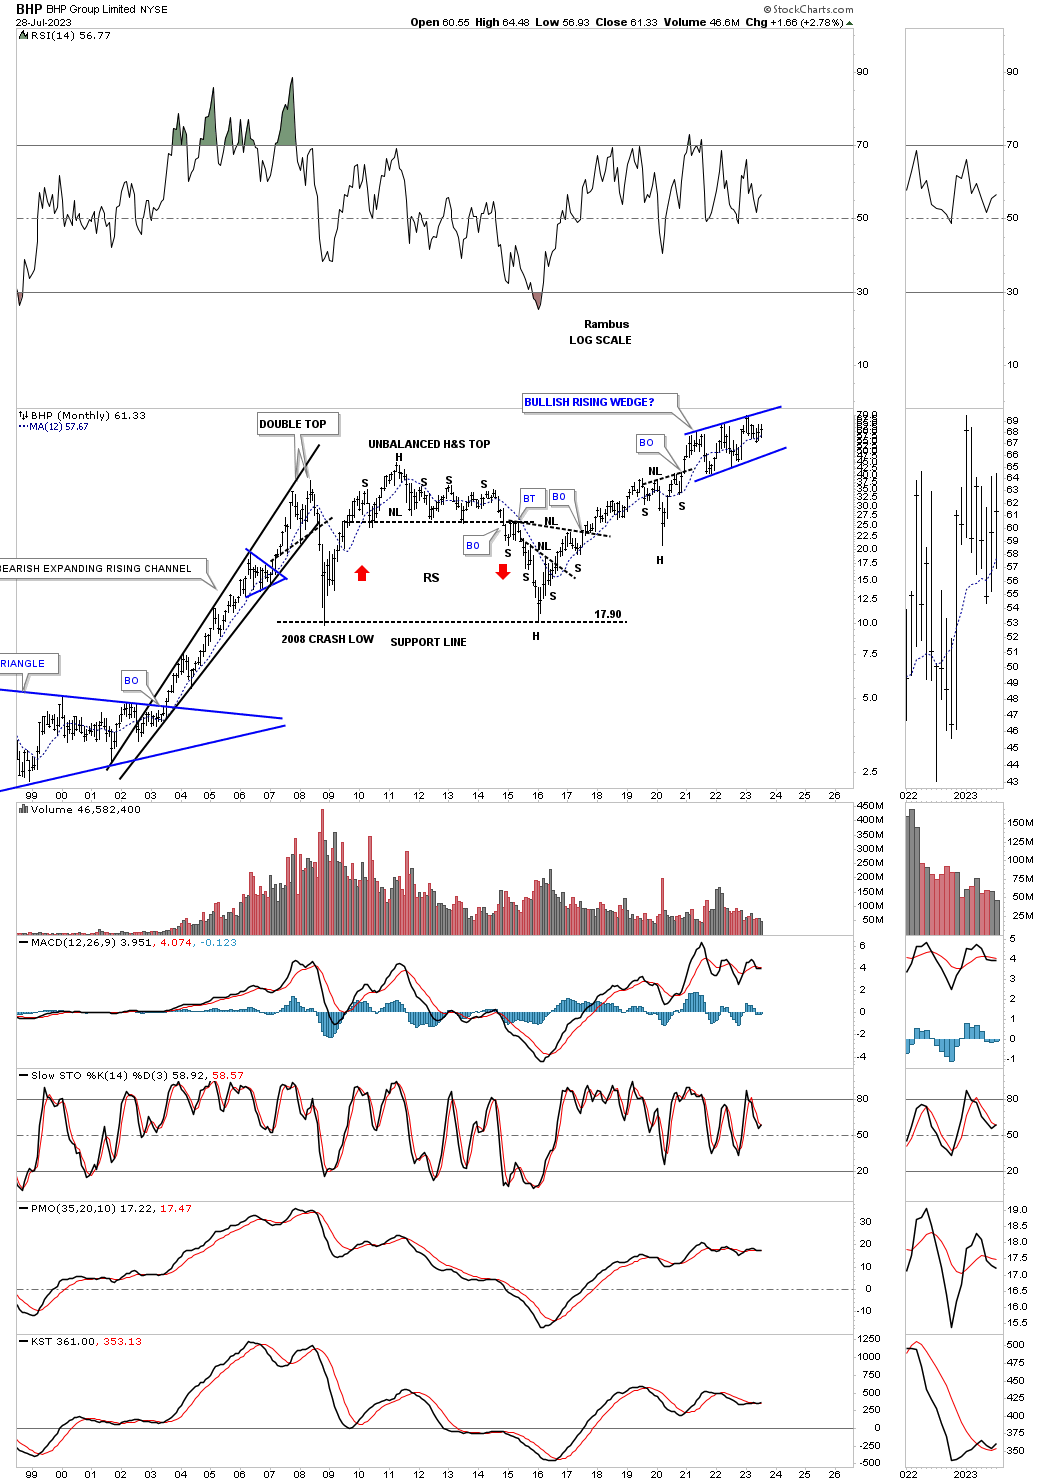
This last chart for tonight is the long term monthly chart for the BHP which is another one of the biggest mining companies in the world and has been building out the possible blue bullish rising wedge consolidation pattern in new all time high territory.
The charts above should give us a good feel for the inflation / deflation debate. Keep in mind these are long term charts which change slowly over time, but the big picture is there with a roadmap to show us the way forward. All the best…Rambus