
“We have gold because we can’t trust governments”
Herbert Hoover
If you know who Neil Howe is then you likely know that western societies are now well into the fourth turning. In the fourth turning, institutions are shaken to their foundations and eventually cleansed of their corruption and malfunction. Howe says this process will be complete by early next decade. That means over the next 10 years we will see tumultuous change. This of course would include our financial system and monetary regime, and that’s where gold and silver come in. My view is that the Bretton Woods monetary system, where the USD became the world’s standard will complete a full circle. That is from physical backing to fiat and back to physical backing over a 90 year period. Begun in 1944 with gold convertibility it had this removed in 1971 and became a fiat currency with no physical backing. By 2035 markets will likely force some form of physical backing in order to survive as a currency. Likely gold will play a role in this new monetary regime.
I don’t pretend to know how we get from here to there, but the odds are overwhelmingly in gold’s favor. As we all know the path gold has taken has proven to be quite frustrating for investors. I can’t say that gains lie in the immediate future, however I can say that multiple signs and indicators are continuing to build a case that the time to launch is becoming nearer on the horizon and increasingly evident.
Things We Do Know
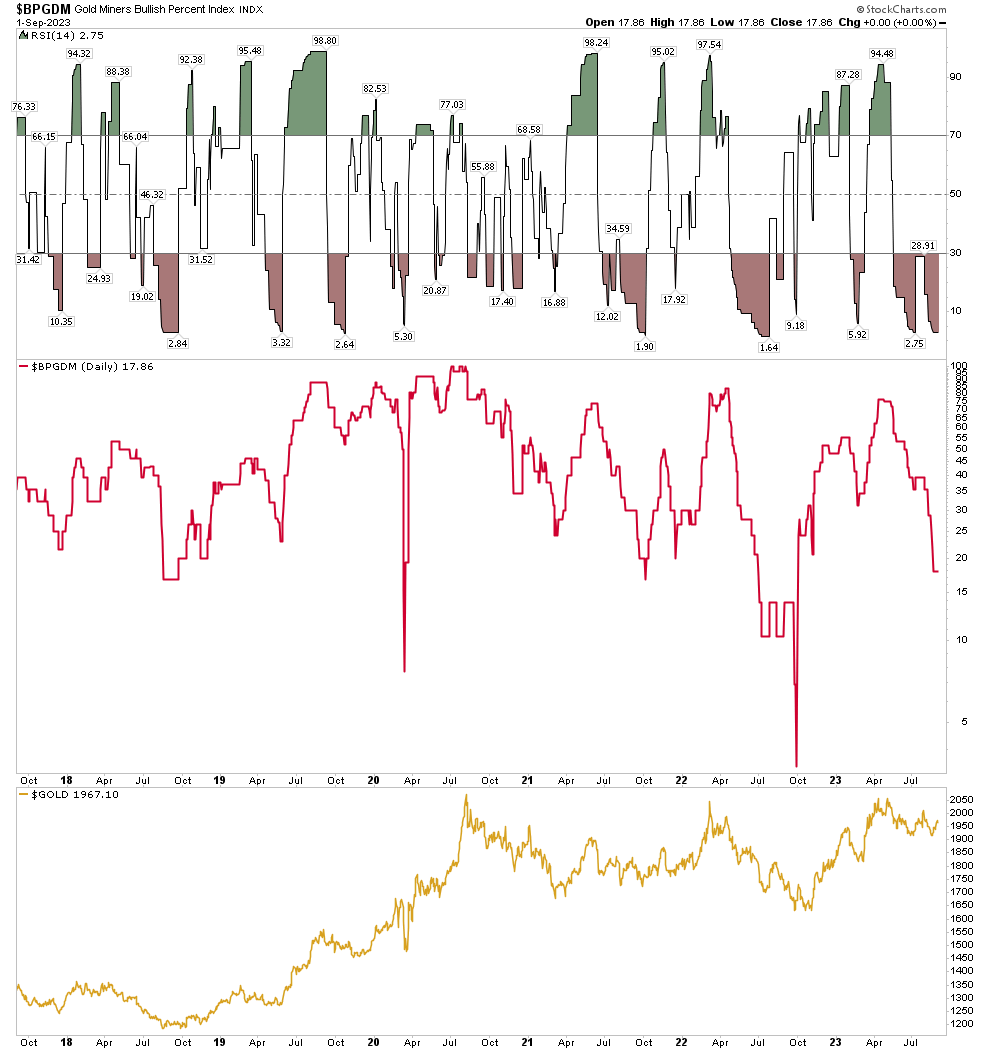
Many signals that led to outstanding rallies in the past are now present in the market today. One would be the gold bullish percent index. In the chart below we see it has now cycled back to the bottom. This is where rallies start from. Note how RSI is fully oversold and now ready to turn up. This is where one should position himself to be long.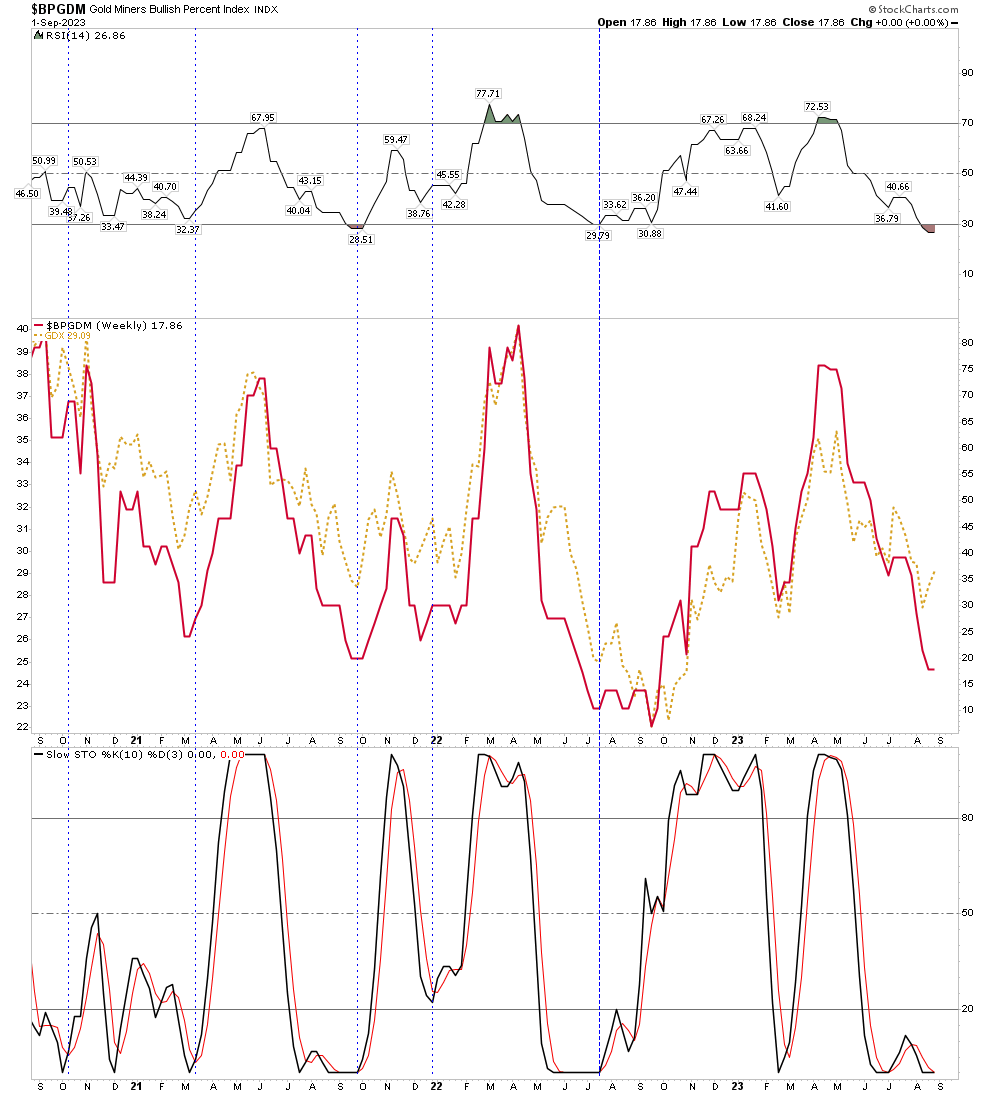
But let’s look deeper and focus in on the chart below. Presently the BPGDM is 17%. Every single rally in gold over the past 5 years has begun from these low levels. Furthermore the RSI is below 3. The analogy here is that of holding a beach ball underwater when the RSI is this low. It is typical to get a 40% rally in the GDX once a 5% RSI is reached. It is now 2.7%.
My intent here is not to show you reams of charts and say it’s ready to launch imminently as it still may need some more time, perhaps even into 2024, but no one really knows when its going to make its move. I just think one can’t afford to be out of it considering how many bullish signs are embedded in the charts. Because when it decides to go it could go like MSOS did this week and you don’t want to have to chase that. I will however, show a few more long term charts that show that the move is approaching. Below is my proprietary buy chart I have shown before. It only shows rare buy points every few years. It triggered a buy last September right at the bottom and it hasn’t looked back. It is telling us to STAY the course, the trend up is slow but we are on our way.
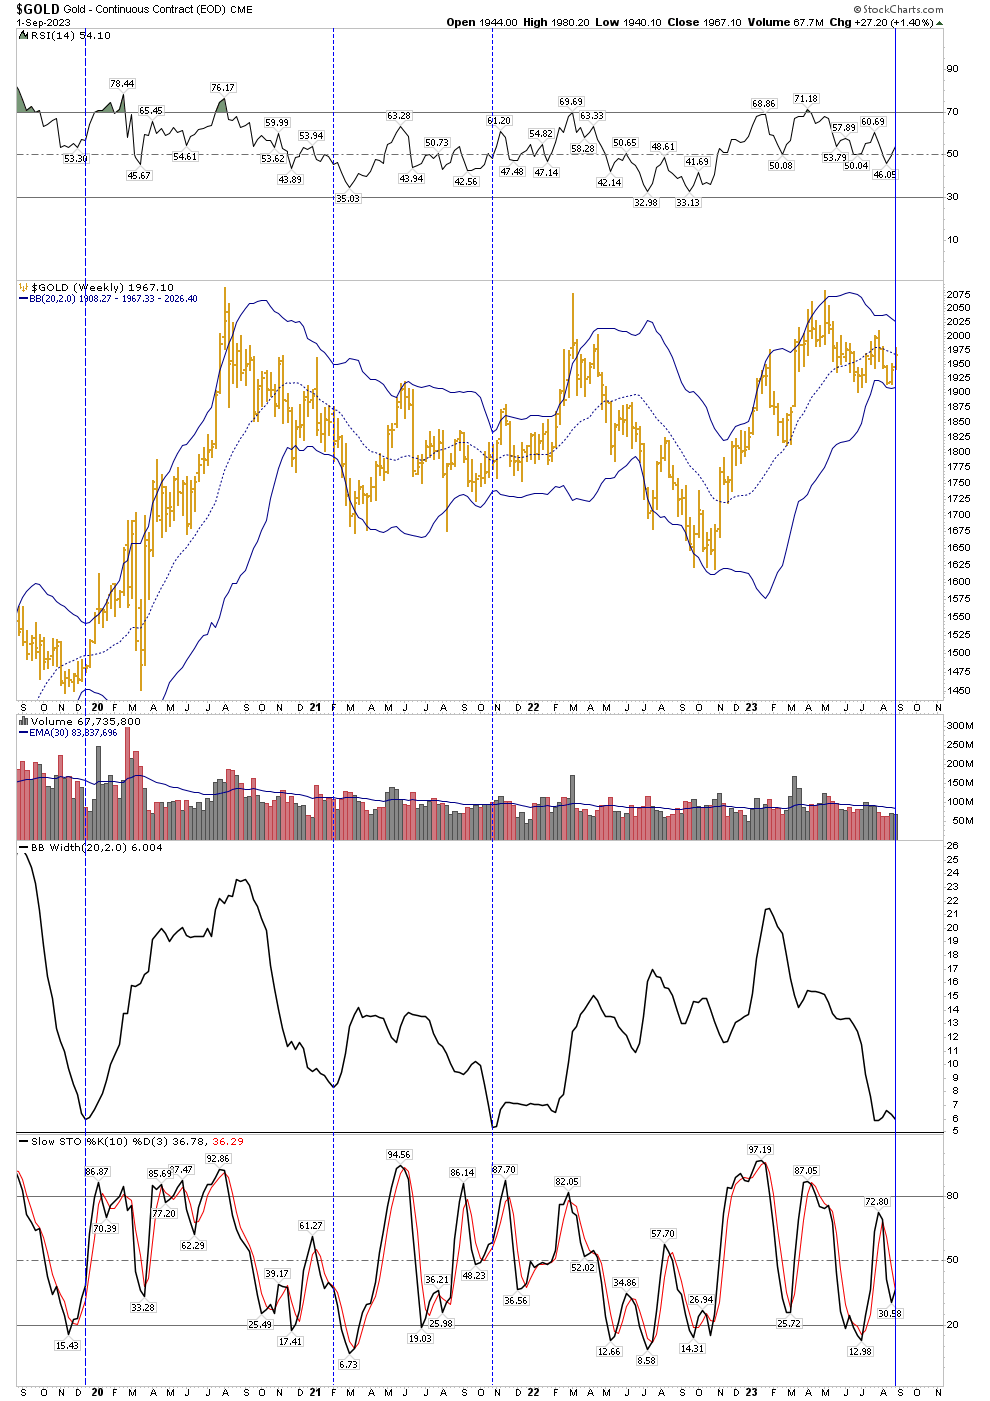
Next are the weekly Bollinger Bands. When the bands narrow to minimum width it indicates a big move is about to occur, either Up or Down. But by looking at the stochastic it gives us a major clue which way it will be. It’s saying up. Be sure to review the BB width indicator, second from the bottom, it’s a beauty as its saying get ready to launch.
The next two charts are slow motion, watching paint dry, long term charts. I show them to remind you that the trend is higher and we are at the end of a process that is resolving itself to the upside. This first chart below is a monthly chart of gold since the 2011 high. I know we all have seen the prominent cup & handle formation so let’s focus in on the handle. We see three repelled attempts to break to a new high. Each attempt however required a shorter interval to gather steam to make its next run. Not only that, but over the past 5 months the pullback is much smaller and this is in spite of the USD being stronger. What we are seeing here is a coiled spring now ready to release its energy. Clearly it’s building steam for its fourth attempt and this time it could rip through resistance. Knock knock knocking on heavens door…
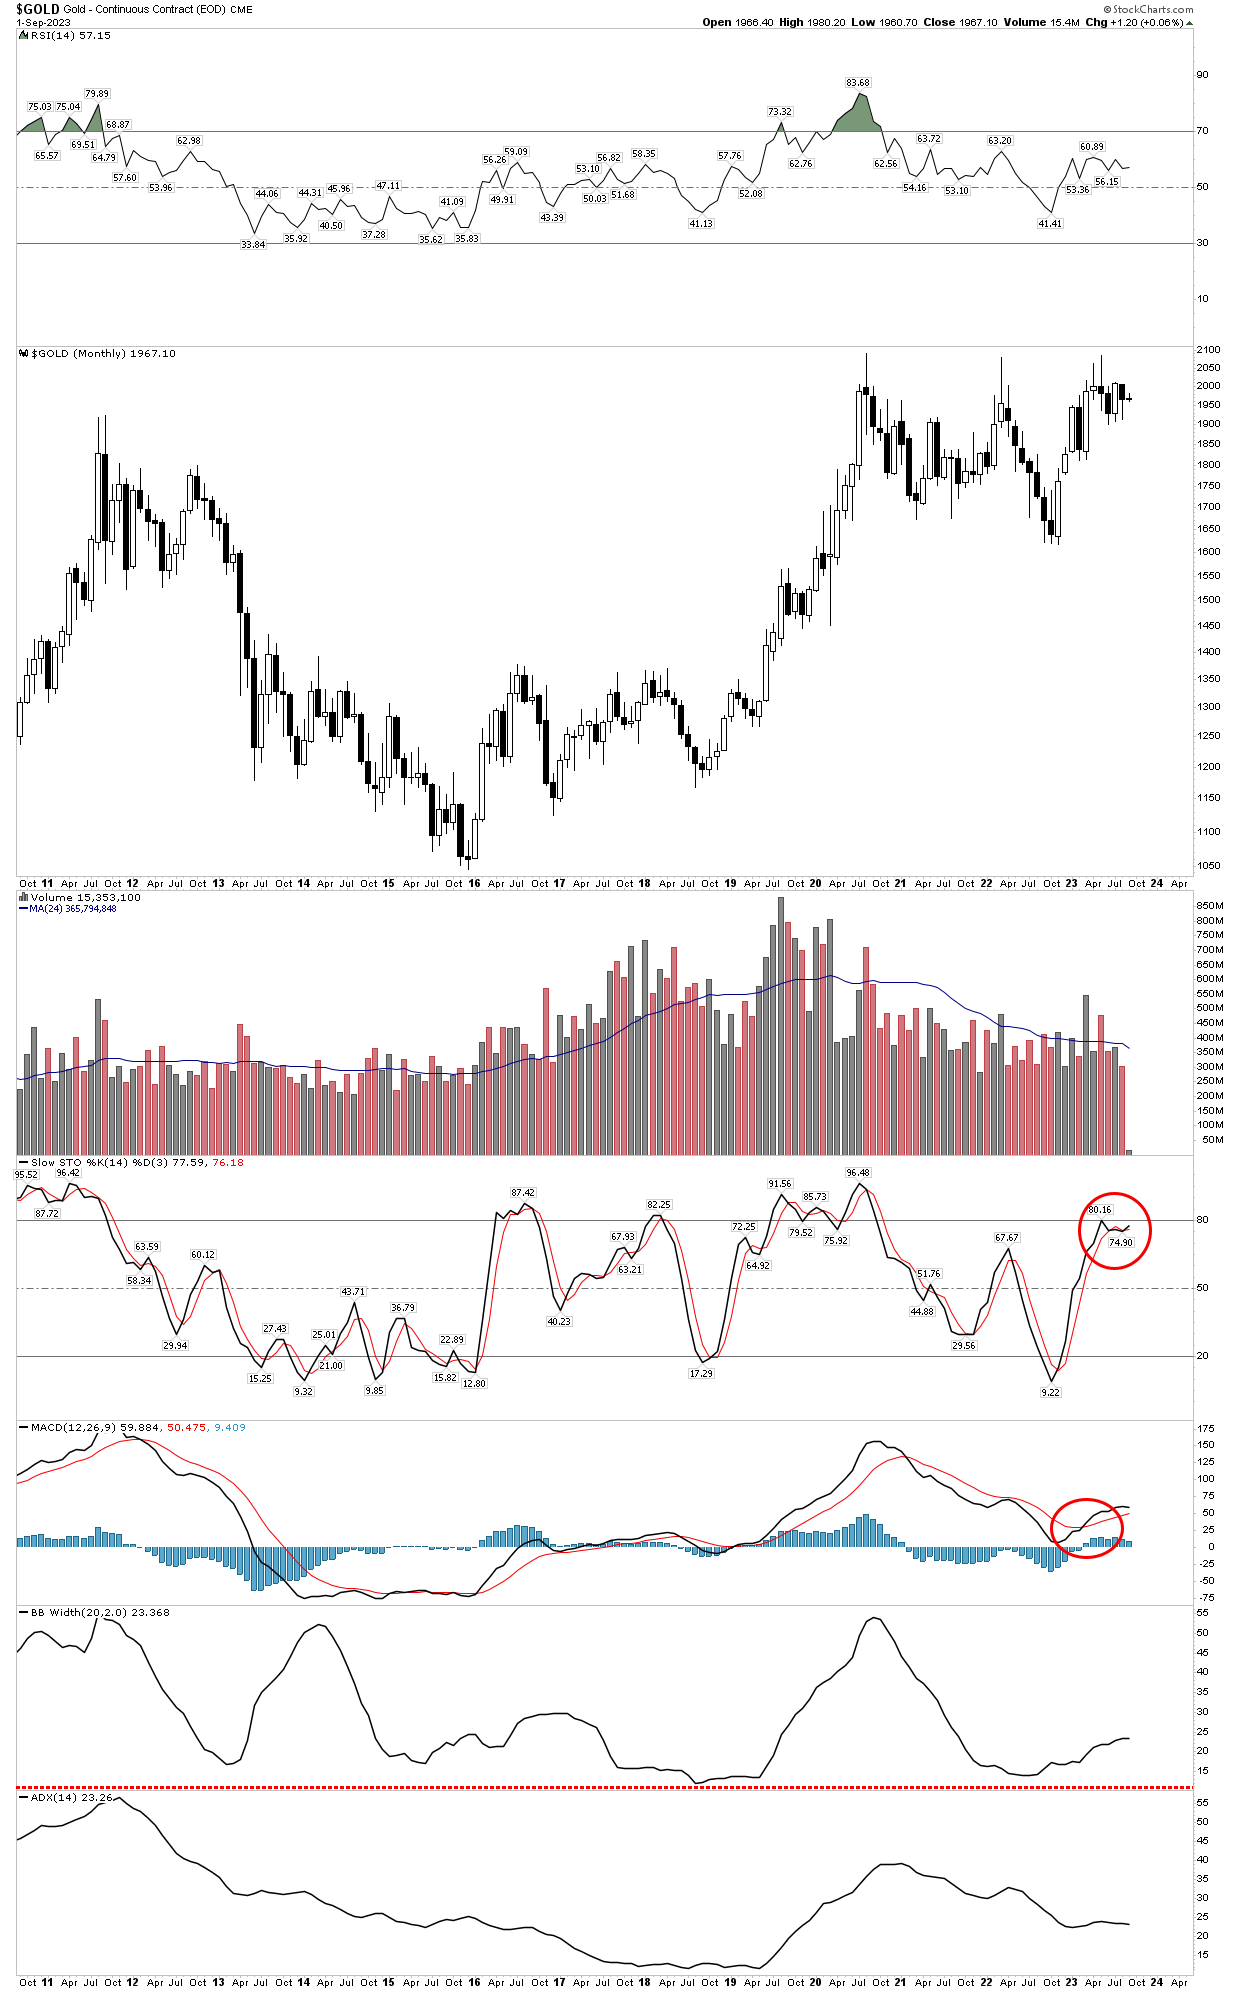
Furthermore, look above now at the stochastic indication that is circled. This has the appearance of becoming embedded. This means once over the 80% level it stays there for a prolonged period of time. This is what a 2 year rally to $2900 would look like.
GOLD:CPI
This last big picture chart shows an incredible long term resolution. What has it resolved? It has resolved the argument of whether gold is going to protect our purchasing power or not. This chart announces to the world, yes indeed gold will. Again a massive cup & handle with a well formed saucer base and it’s now breaking out from a well formed clear contracting triangle bull flag which makes up the handle. Note the crossings of the 20 & 35 monthly EMAs. Once these cross they trend for years, meaning it is headed up for years to come.
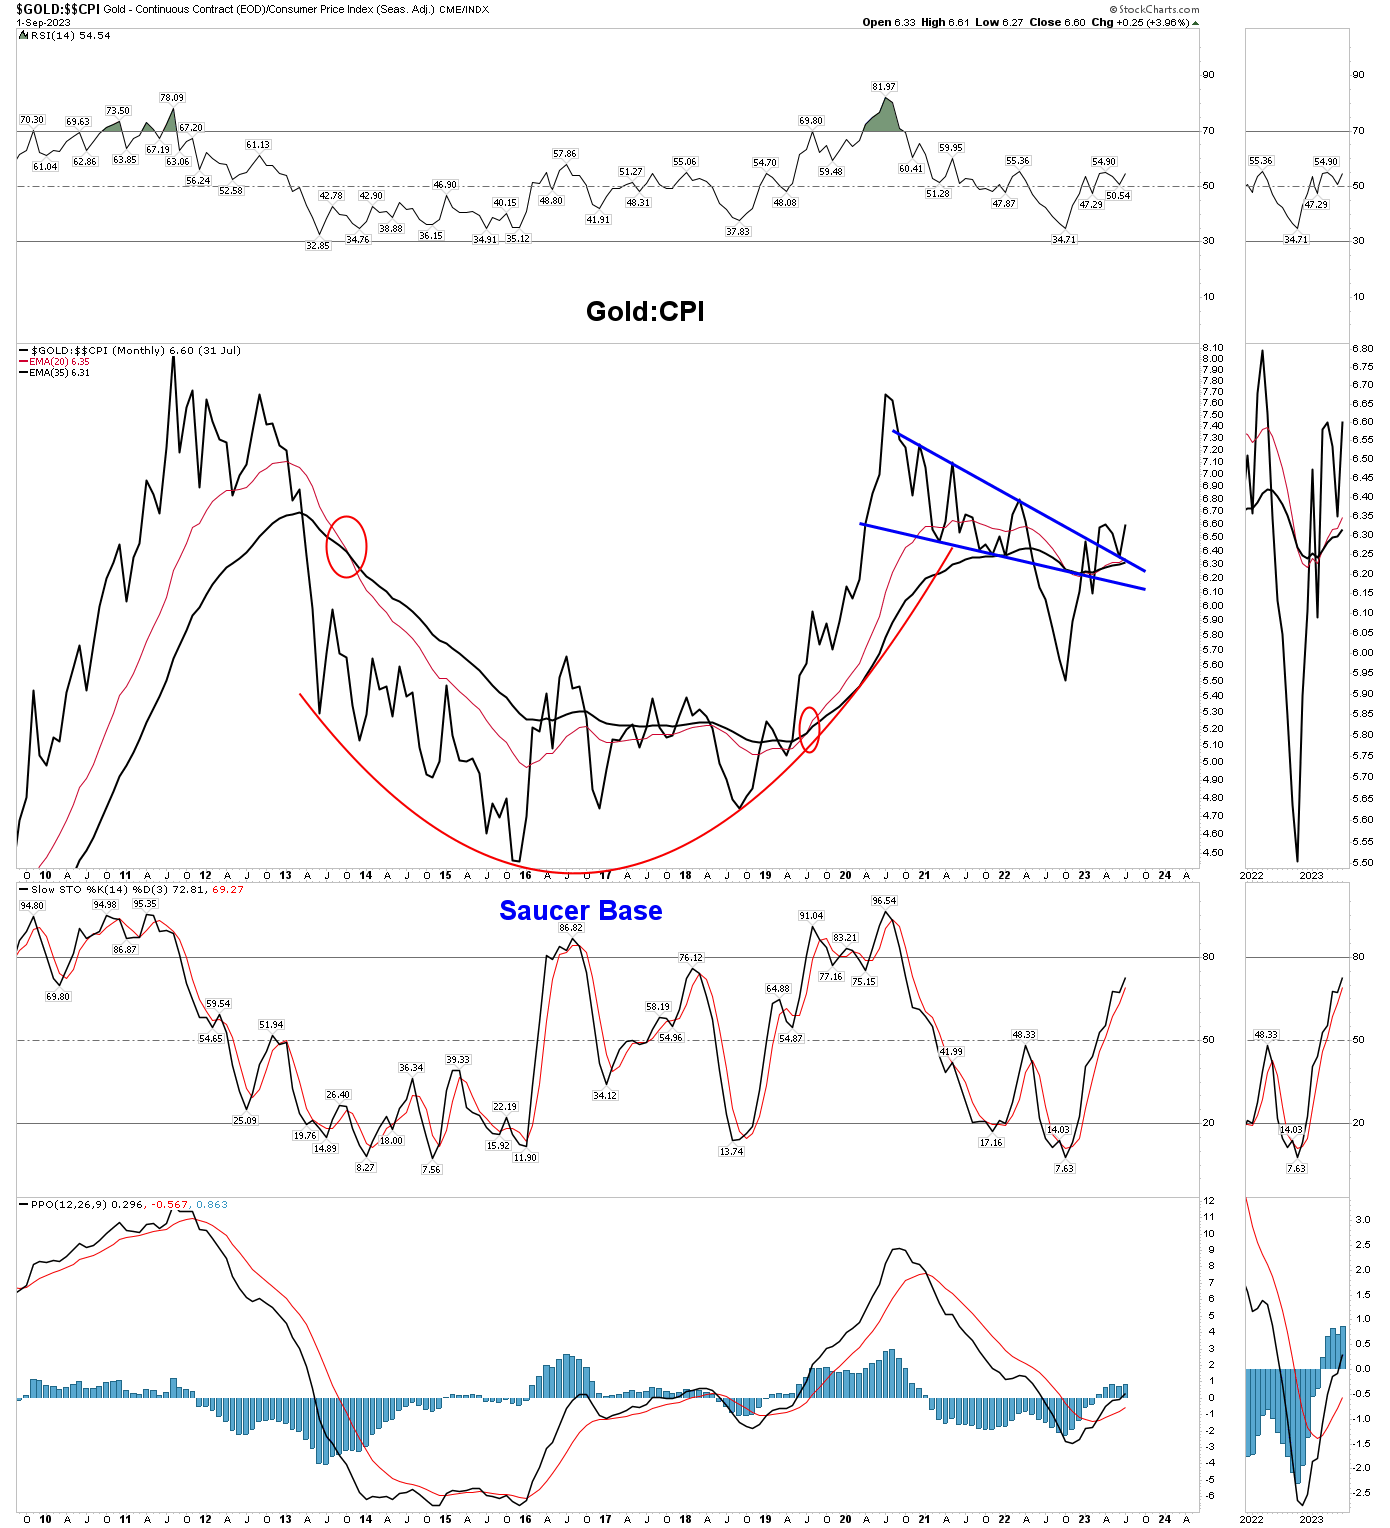
When the average citizen gets ravaged by inflation, since printing will be the only way the government can pay its bills, people will come to understand that gold will protect them. Good news!, this chart is telling us this NOW.
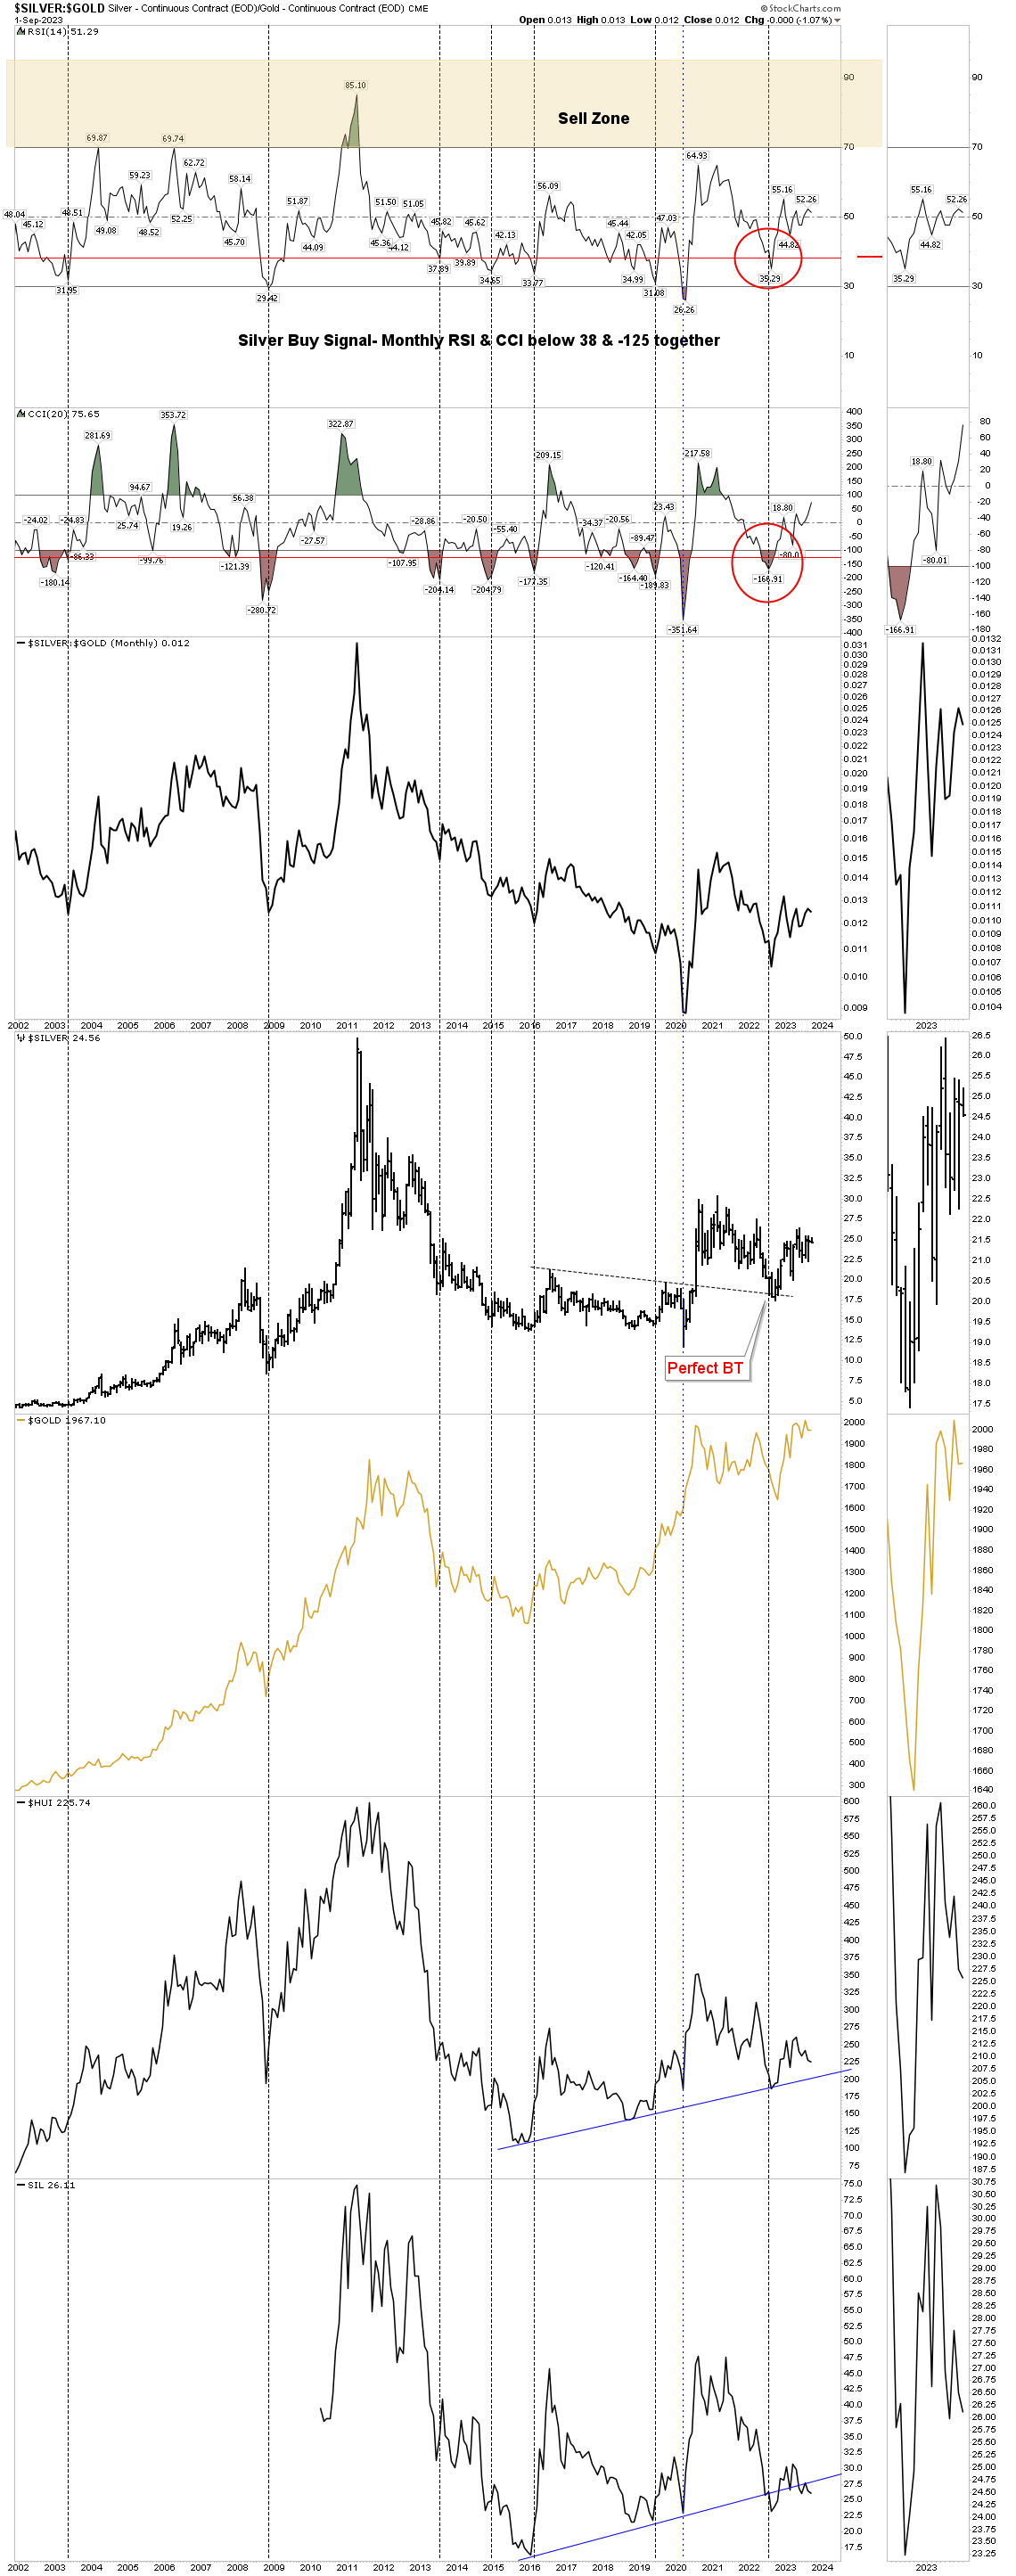
Silver’s Message
Before moving on to the general market let’s mention silver and what is going on beneath the surface. We all know that sentiment in the sector is rock bottom. No one wants silver now three years after everyone wanted it when it made its vertical run in the summer of 2020. The silver stocks are the red headed step child of the market, but therein lies opportunity. In the month of August it seemed a daily event that the market would take a silver stock behind the barn to be shot. SILV, HL, FSM, GSVRF, EXK, NEWP (in June) all had their purges. It appears that this was the washout opportunity as there are growing signs that silver is exhibiting internal strength and could surprise everyone to the upside.
What is special about the below chart?
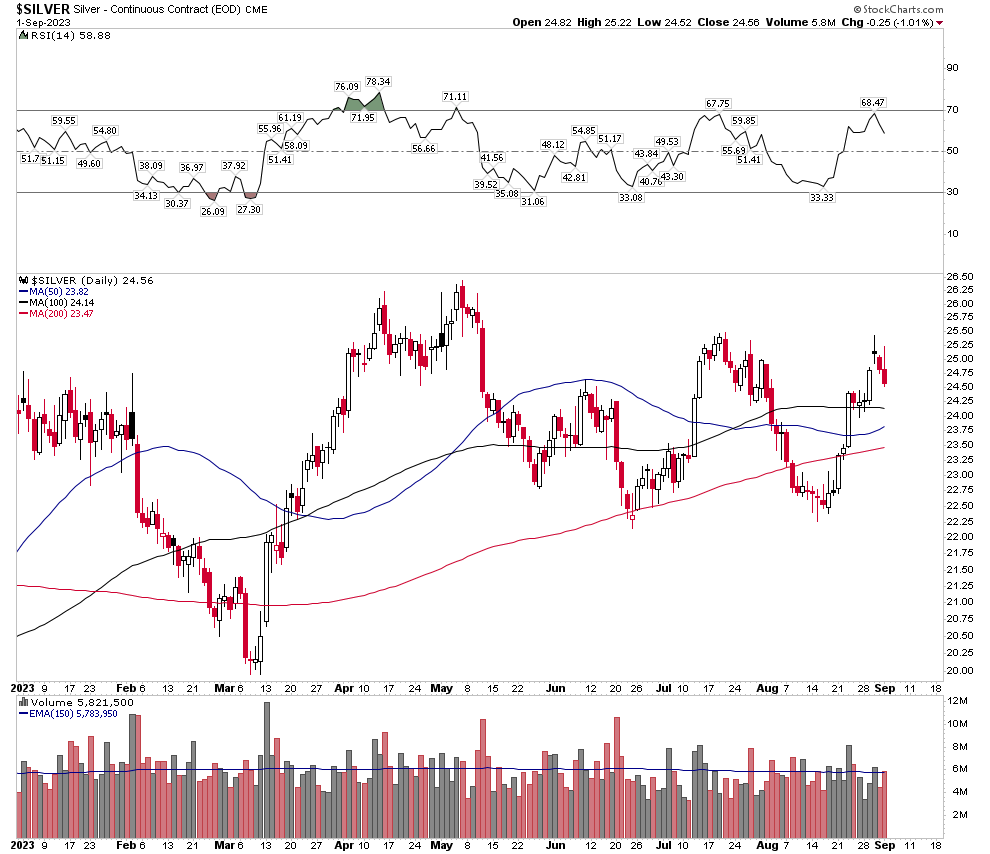
What is so special is that this is the first time since 2011 that the silver price has penetrated the three simple moving averages (50,100,200) without the commercial banks adding to their short positions. If one ascribes to the ability of the commercials to suppress the silver price through their operations on the COMEX this is a highly significant moment. Monumental actually, because this is how the rinse and repeat process is run. The commercials short on rising prices above the 3 moving averages and cover on falling prices near the bottom. It has been going on for 40 years. If the commercials don’t increase their shorts on rising prices the rinse and repeat cycle wont occur and for now, it just stopped.
Why you ask? Perhaps, because the commercials are not dumb and they see the developing physical shortage in silver. Decades of low silver prices have resulted in decreased production supply and now increasing industrial demand is creating an outright physical shortage. This shortage has recently manifested itself in a run on the silver ETFs and extremely high rates of physical turnover on the COMEX. In fact over the past few weeks the ETFs have been getting bled white with withdrawals in PSLV and SLV. Silver’s price has increased over the past 2 weeks, yet the ETFs have suffered withdrawals. It’s normal to do the opposite. When price rises, silver flows into the ETFs not out! The ETFs represent investment supply and are being used to fill a gap between supply and industrial demand. In other words these are two forces in the early stages of a collision course which resolves itself by rising prices.
Friends these are powerful subsurface signs that things are about to change.
The rate cycle and what it means for the market
This is todays key issue, and I defer to Dan Oliver’s well researched and brilliant article “Two Years To Bust” – Attached at the bottom of this report.
Forget watching hours of YouTube videos and Bloomberg commentary. Dan’s article is all you need to know. When I was based out of NYC I used to attend dinners downtown where Dan would MC the events. He was brilliant then and even more now. In his article he mentions that the upcoming gold bull market will be different than those in the past. It will not be driven by chiefly inflationary concerns as the 1970’s and 2000’s were, but monetary fears of US solvency will drive this bull with more power.
Market Action Ahead
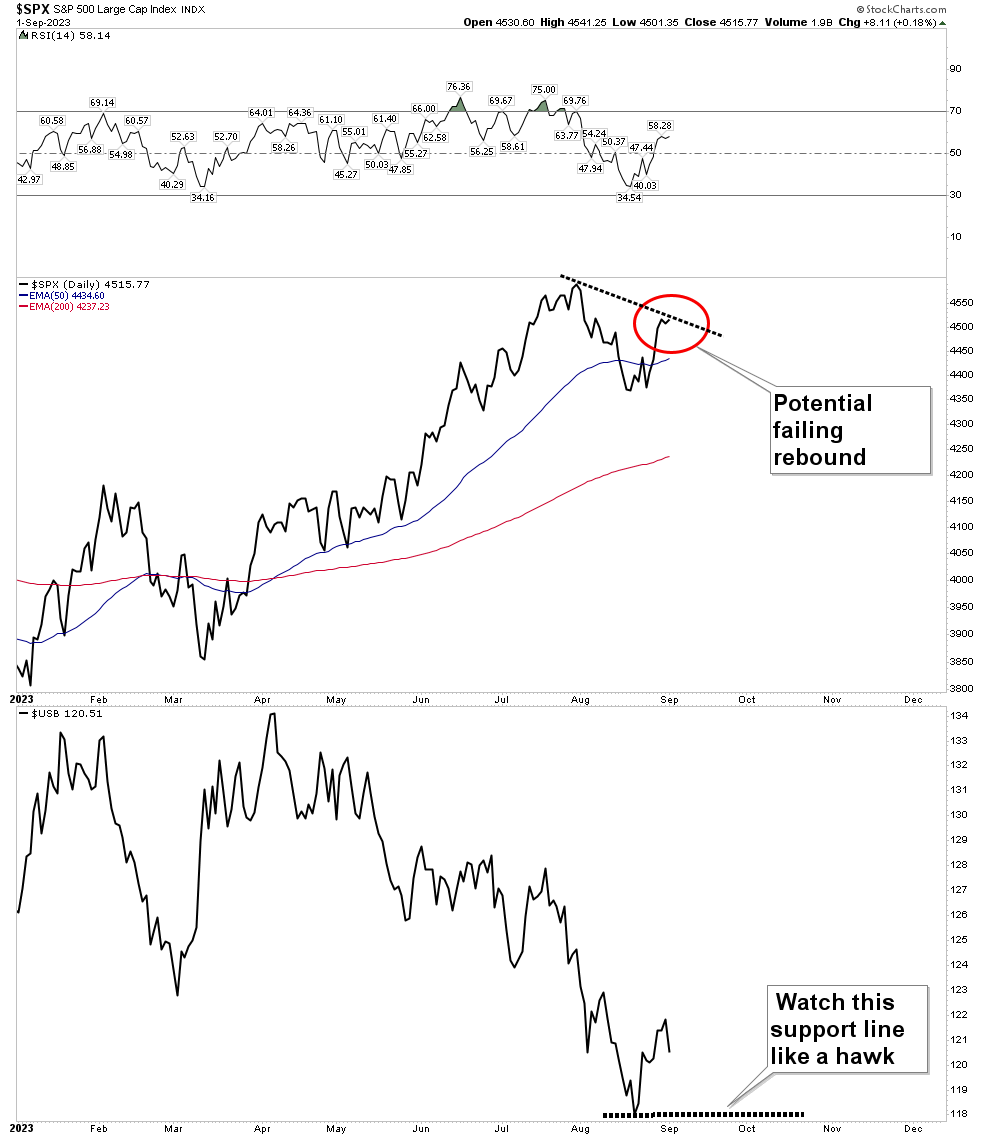
After reading Dan’s article you should be able to sketch a rough time line of what is coming over the next 2 years. There will likely be a crash phase in there somewhere. Recall last fall it seemed most were calling for a crash. Of course that’s never when a crash arrives. Crashes come when few expect them. Perhaps times like now with the FED claiming victory over inflation and the market resurgent this year. The chart below is a trip down memory lane to the crash of 1987. This was the set-up: The bond market collapsed to new lows after violating a “double bottom” in the first week of September. That set the stage for the failing stock market top. It took a month and a half of bond market erosion to kick the supports out from under the stock market. I am not predicting a crash, but you better believe that if the 30 yr USB breaks below 118 (see second lower chart) I will be on high alert and will be buying puts in size.
1987 crash set-up:
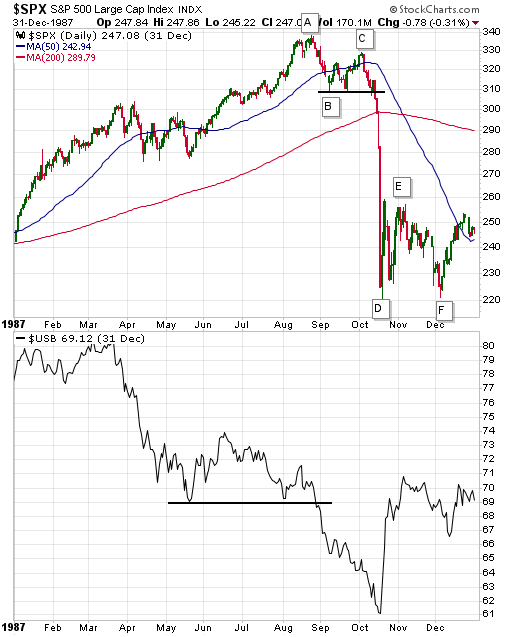
Today’s stock and bond market…. eerie comparison to 1987.
Looking Ahead 2-3 Years
The fourth turning end game happens over the next 10 years. Most of our institutions will be disrupted and overturned and ultimately cleaned up. There is no way we can foresee what levels will ultimately be reached in our financial markets as a result of this turmoil. Viewing shorter horizons however, lend themselves to be more forecastable. The gold market began its present leg up in September 2022. The full scale capitulation last fall makes this obvious that was the bottom. The first rally off the September bottom peaked in April. It has been correcting that September to April move for over 4 months. That correction is now likely completed and the next leg up is set to begin. It can be expected that this extension higher in the bull market in gold and silver could last perhaps 2 more years and see gold rally to $2,950 and silver to $50, possibly higher. This level of movement will then need time to digest. Perhaps a 2-year cyclical bear market would flush things out and lay the ground work for the final “Fourth Turning” bull market. This would be the one that reaches levels which we cannot even conceive using todays frame of reference. I hope I can stay solvent to ride it.
Dan Oliver: