 Today, in the PM complex, we got a little more confirmation the bears are still in control of the short term. There are several potential bullish chart patterns that have to be negated to really confirm the PM complex is going much lower than what most think is possible. I’m getting flashbacks to when the 2011 H&S top formed and no one wanted to believe it.
Sir Fullgoldcrown put together a post about the 2011 H&S top, which was just on the verge of breaking the neckline, highlighting some of my comments and a list of comments from some well-known analysts, which gave every reason in the book on why this very symmetrical H&S top wasn’t authentic and would fail and the bull market had much further to run.
Fullgoldcrown
What Do YOU See ? February 15 2013
“Beauty is In the Eye of the Beholder” ..English Proverb
Rambus comments first.
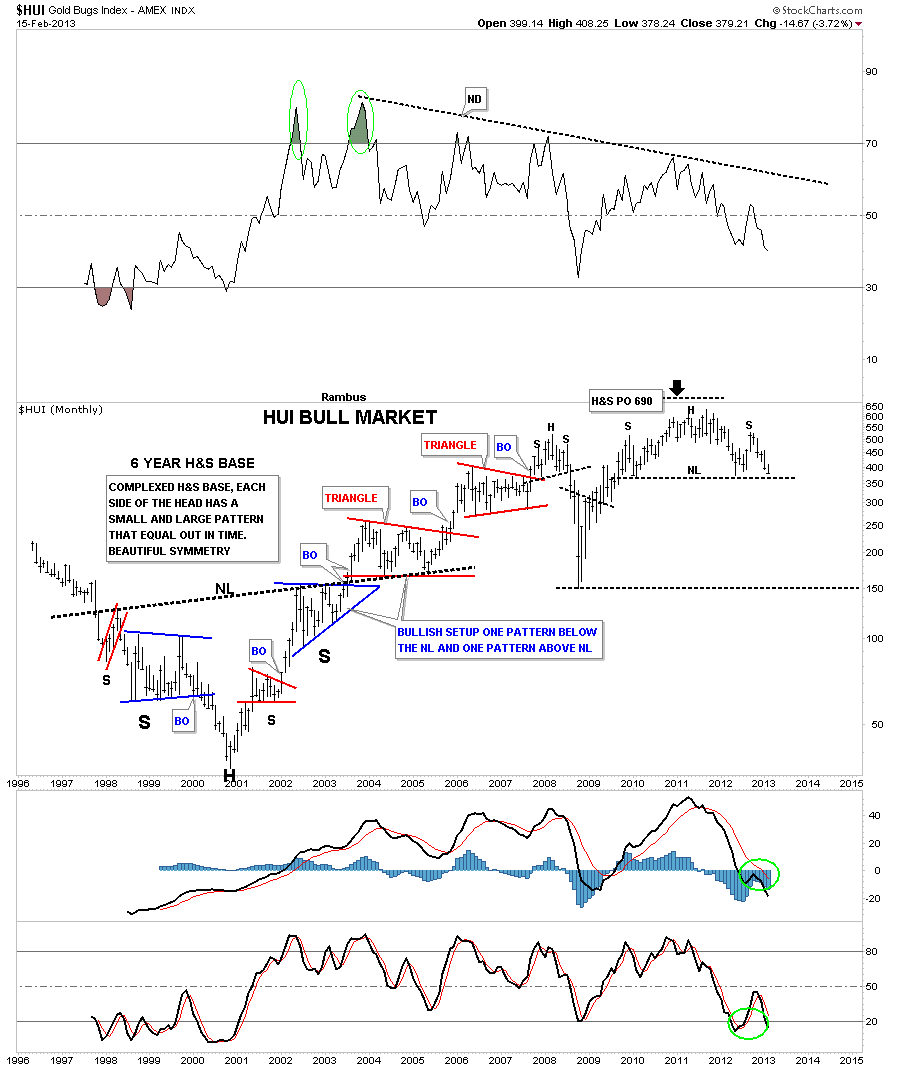
Tonight, I want to show you a long-term monthly chart for the HUI. It seems there is a lot of disbelief that, if an H&S pattern is too big, it somehow makes it invalid or not to be trusted. I’m curious how that rumor ever got started? Nothing could be further from the truth, IMHO.
Below is a monthly chart of the HUI that shows a massive 6-year inverse, complex H&S base, that launched the bull market for the precious metals stocks back in 2000. There is a certain beauty that 6-year H&S base has that most wouldn’t recognize. If you look on each side of the Head, you will see two chart patterns, one large blue formation and one small red formation. They are positioned just the opposite on each side of the Head. This doesn’t change the time component, as the left and right shoulders measure out very close to each other. At the very top of the chart, you can see what that big 6-year H&S base measured to. As you can see, it measured up to 690, which was just a tad higher than the actual all-time high.
The Chartology of the entire chart is one of beauty and symmetry, which some will see and others won’t. They say beauty is in the eye of the beholder. What do you see?
Fullgoldcrown:
OK
Its Friday Nite February 22 2013 . The week that just passed was Devestating for gold bulls and featured what seems to be a capitulatory crash in all things PM . Searching the Web for some Hope , This Gold Permabull has found it . Amongst the wreckage of dreams and portfolios, bullish bottom callers abound. The following well seasoned and respected analysts again join in a chorus called
“THE BOTTOM is In”
Just Initials …to protect the guilty 🙂
1 A H : Gold Capitulation
2 Dave N : Mandatory rebound to at least Gold 1610 Imminent
3 T D S: We’re Headed Dramatically Higher; To Levels Few Can Even Consider
4 Jeb H : Keep Your Head When Investing In Precious Metals
5 B M : Capitulation
6 M H : Gold Bear Trap Is Sprung
7 Gold and Silver Worlds :Gold & Silver Prices Drop Into Severely Oversold Area
8 CEO Technician :Huge Buying Opportunity Setting Up in Gold
9 (Deleted) : Time to Buy Precious Metals Now
10 W Y : Carving a Reversed Head and Shoulders Instead
11 J N :A Golden Opportunity With Miners
12 Ch V : Gold & Silver Nearing MAJOR Long-Term Support
13 T C : Major Top In Stocks & Major Bottom In Gold
14 D L :The Current Currency Crisis will Ultimately
Lead to Higher Gold Prices
15 P R :”Summing up, support lines are in play for two out of three of this article’s gold charts and it’s likely that a local bottom has indeed formed. Additionally, RSI levels indicate an oversold situation. The outlook for gold from here is bullish”
As a Staunch Permagoldbug of some 20 years…I have seen the lean times (pre 2001) (2008) and the Fast Times (Gold 1900)…and I really really hope and pray these esteemed Gold Analysts are right !
Many of them however have been calling for a Bottom for quite some time
They cite : Extremes in Bearish Sentiment , Extremes in Commitment of Traders , Extremes in Momentum Indicators , Extremes in Fundamentals , Fractals , Cycles , Elliot Waves and a host of other reasons that I desperately want to believe !
However there is that one lonely nagging voice in the wilderness calling…”Its all in the Chartology”
And this time I am not going to shoot that messenger as I did in 2008 !
Rambus always tells his subscribers :
The only Rule in the PM Markets is “There are No Rules”
So anything is possible
Perhaps this will turn out to be a Bear Trap
If So , I know that Rambus (Dave from the Ozark Mountains in Arkansas)
will be able to spot it in the Charts and turn on a dime and go long
But For Now…The Charts are Shouting “Breakdown in the Precious Metals Stocks !”
And We Better believe what we see !
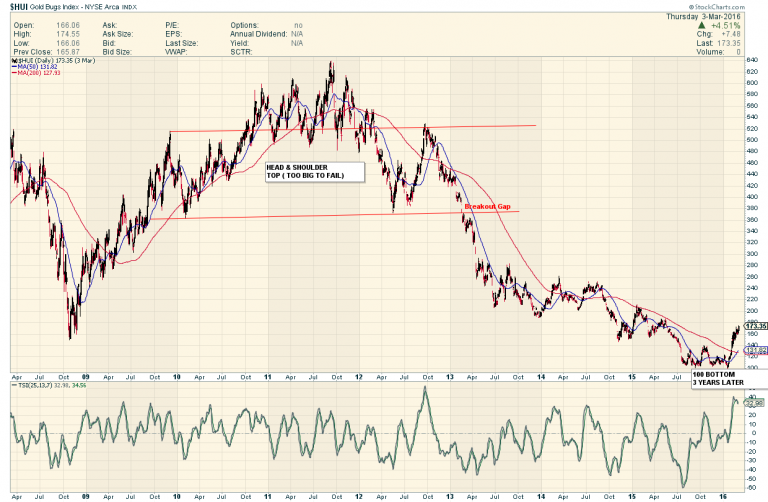
HERE IS HOW THE HUI WENT AFTER THAT TOO BIG TO FAIL POST WAS MADE…
Back to the present.
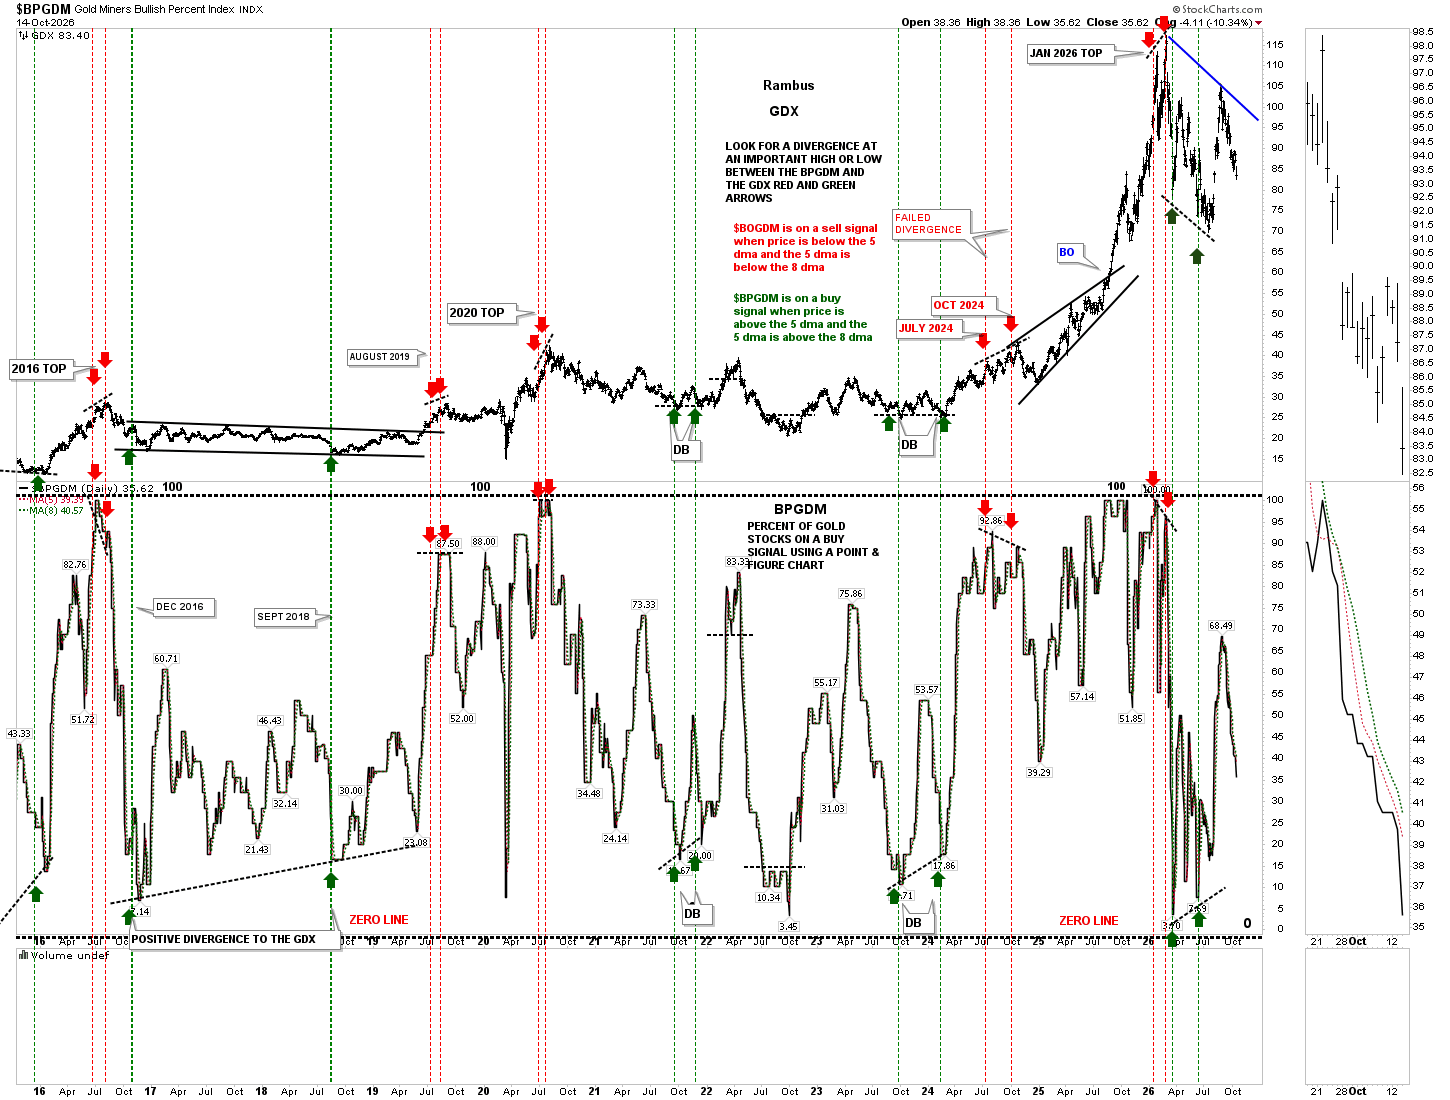
Let’s start with the daily combo chart, which has the GDX on top, with the BPGDM on the bottom. As the BPGDM continues to move lower, so is the GDX, making a new lower low today.
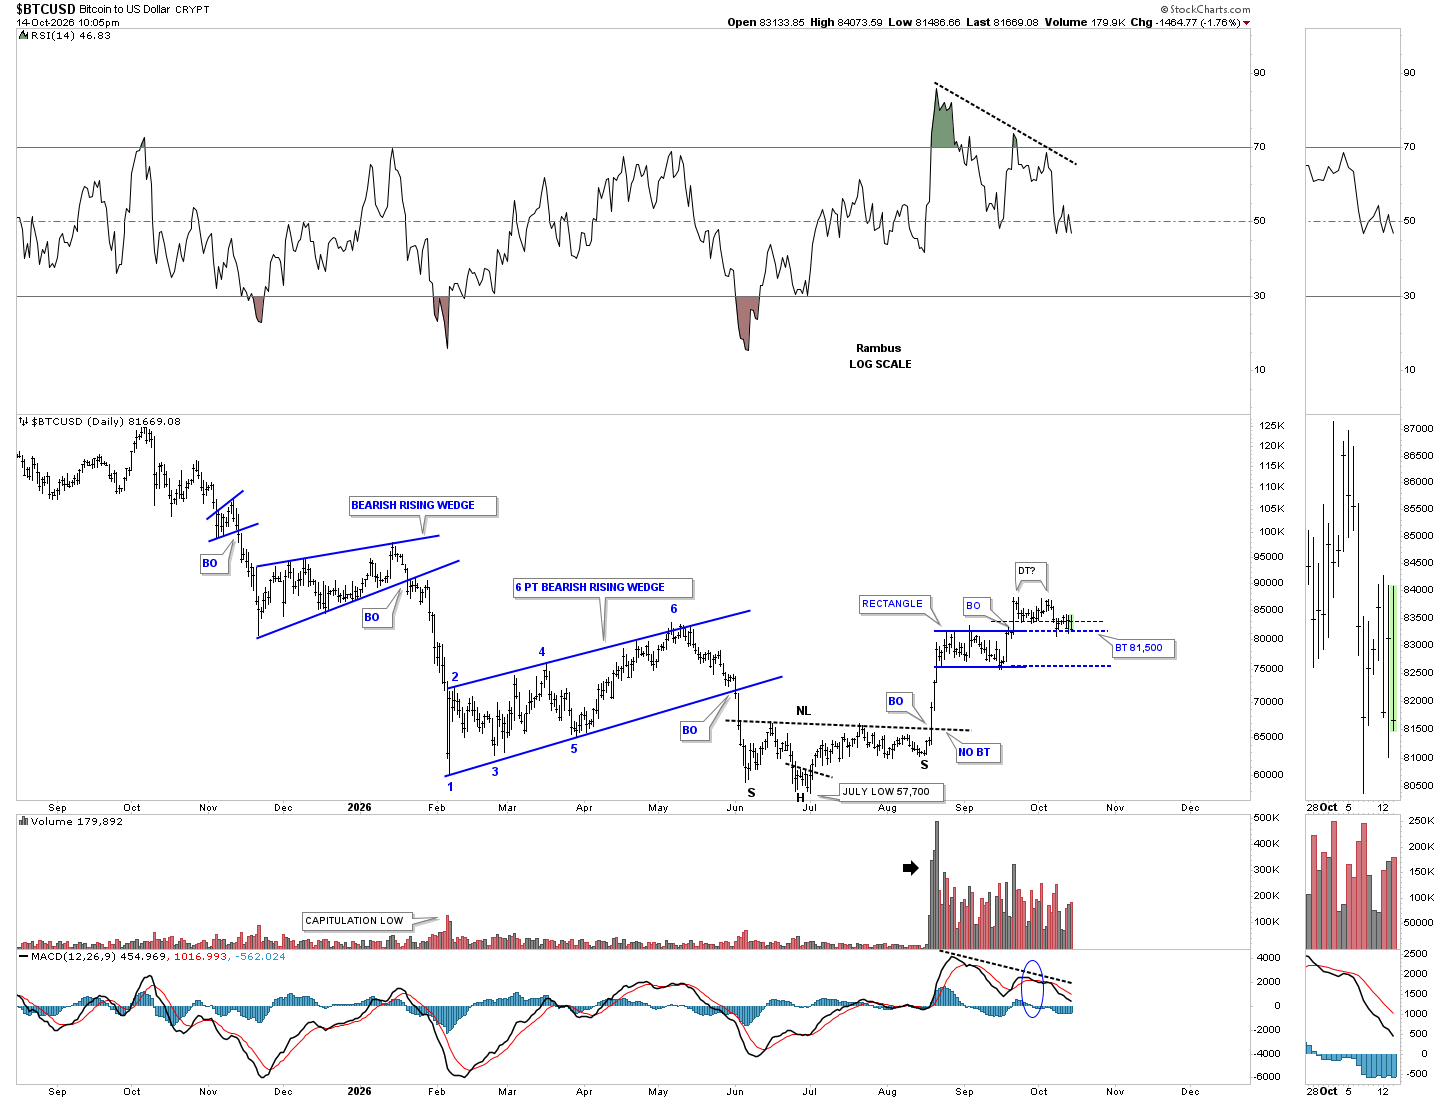
BTCUSD still hasn’t shown its hand yet, as the price action is bouncing between the possible double-top trendline and the top of the blue rectangle. If the top rail of the blue triangle fails to hold support, this chart shows a good example of how we could see reverse symmetry down to the bottom of the rectangle, because of the vertical one-day rally.
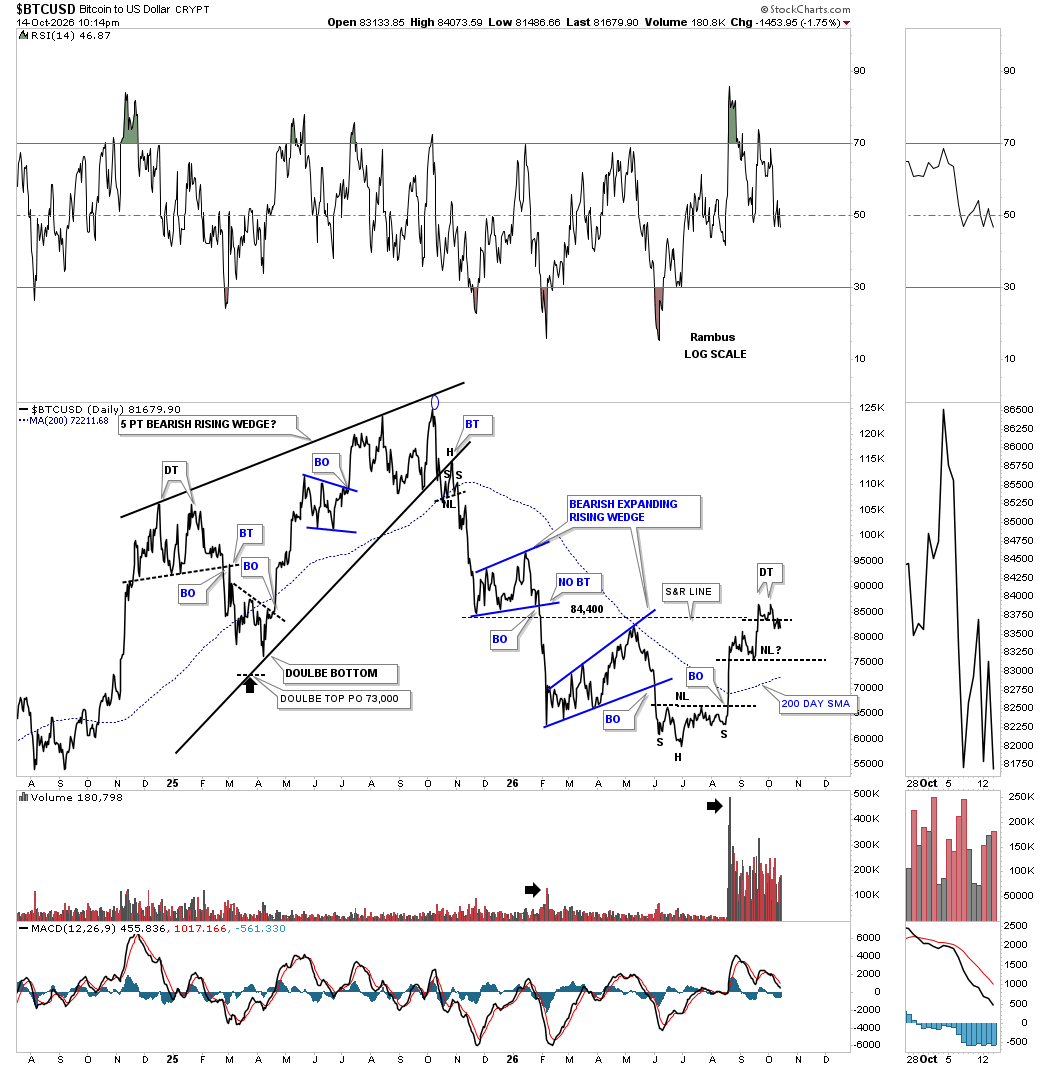
This daily line chart shows the small double top, which is still being backtested. The first thing we need to see for any H&S top is for the left shoulder high to be negated to the downside, which would then set up where to draw the neckline.
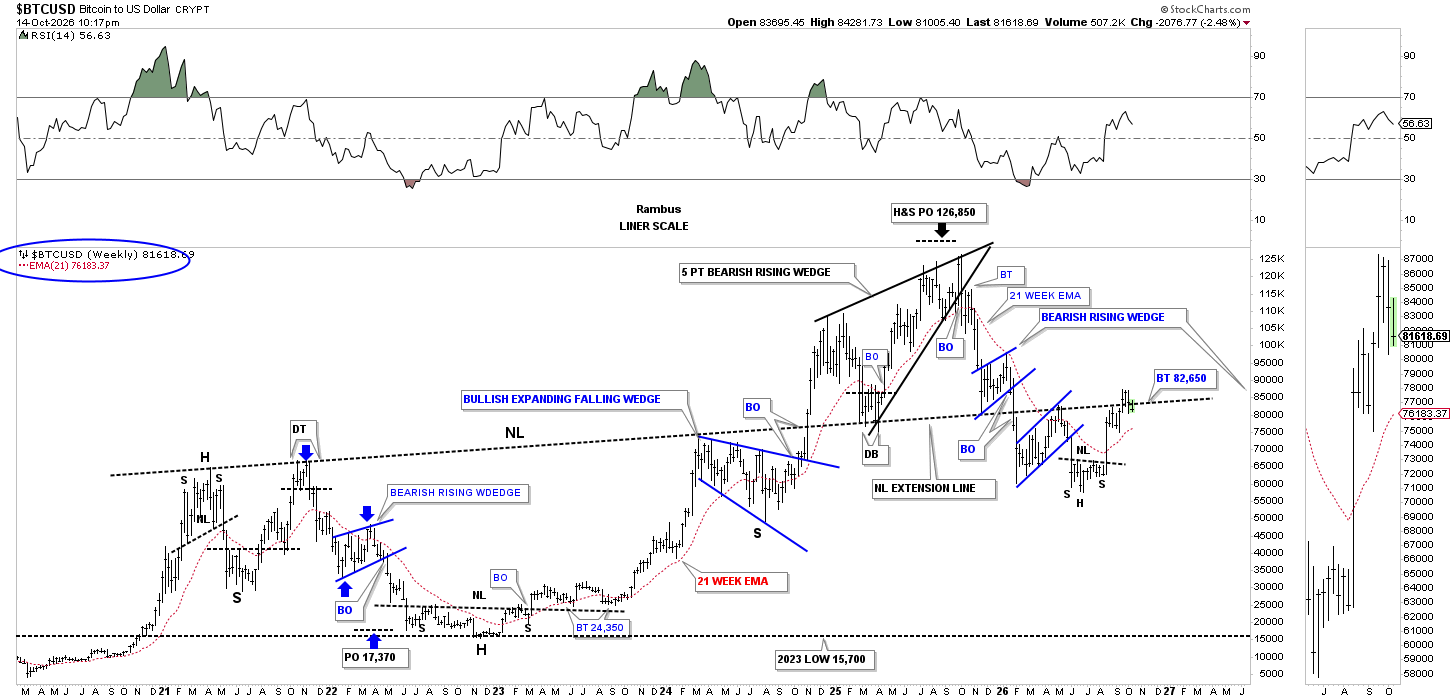
If you follow the neckline from the very large H&S bottom, starting from the left side of the chart to the present, you can see how it has reversed its role several times, from support to resistance and back to support again, labeled neckline extension line.
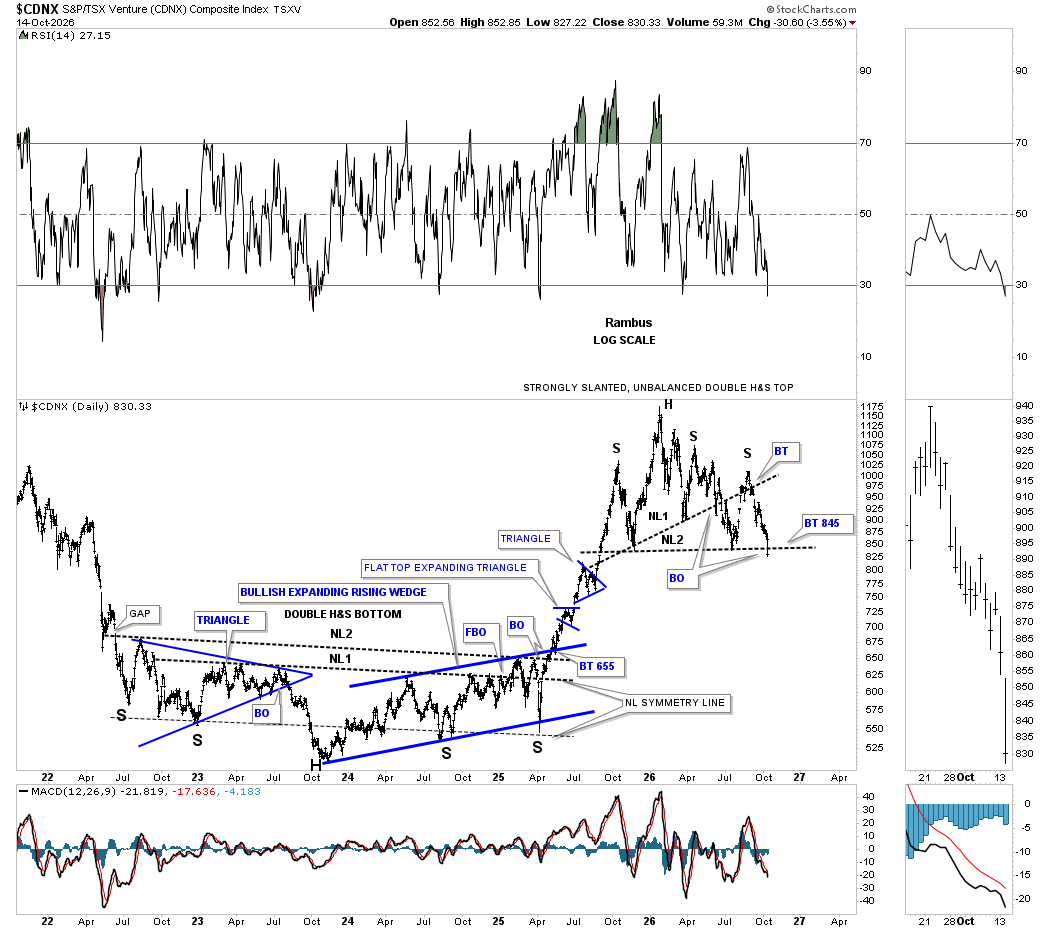
Today, the CDNX cracked the neckline of its strongly slanted, unbalanced, double H&S top. The multi-year double inverse H&S bottom was more symmetrical, as shown by its neckline symmetry line, which showed the lows for the left and right shoulders. The current H&S top is just a different variation.
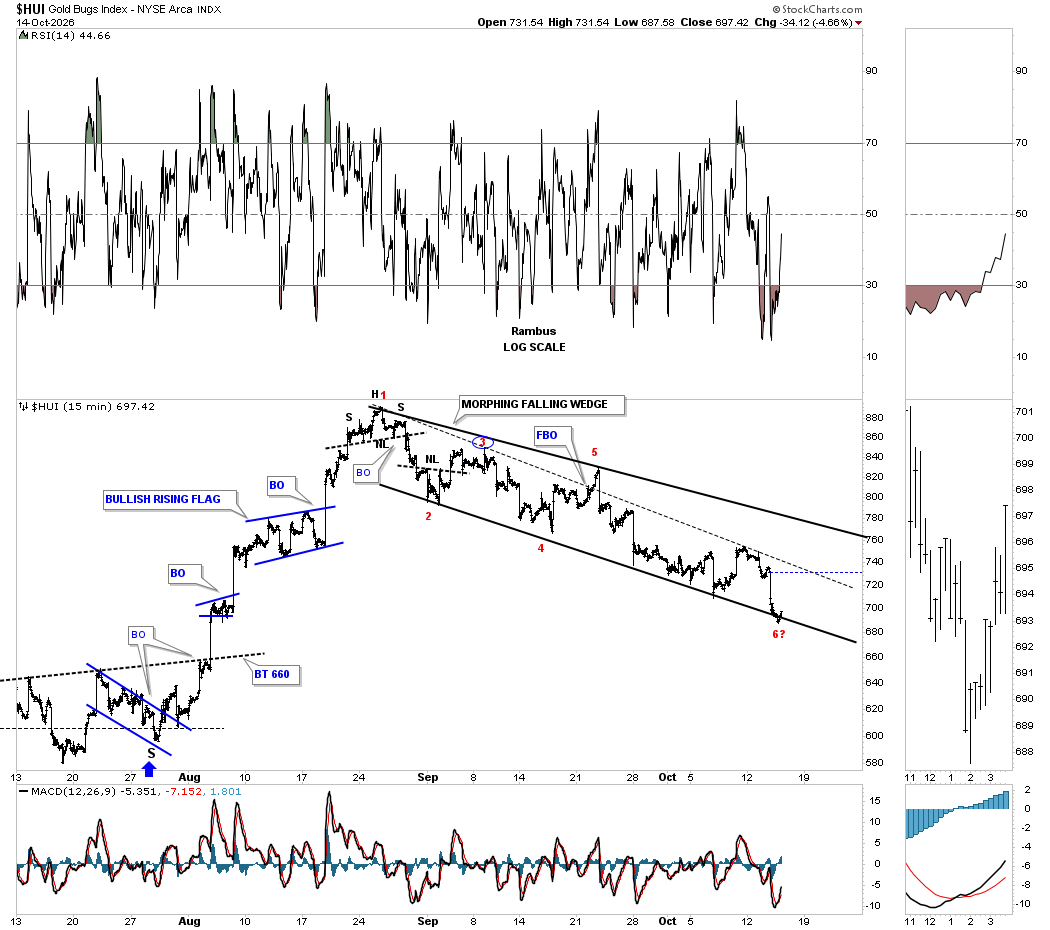
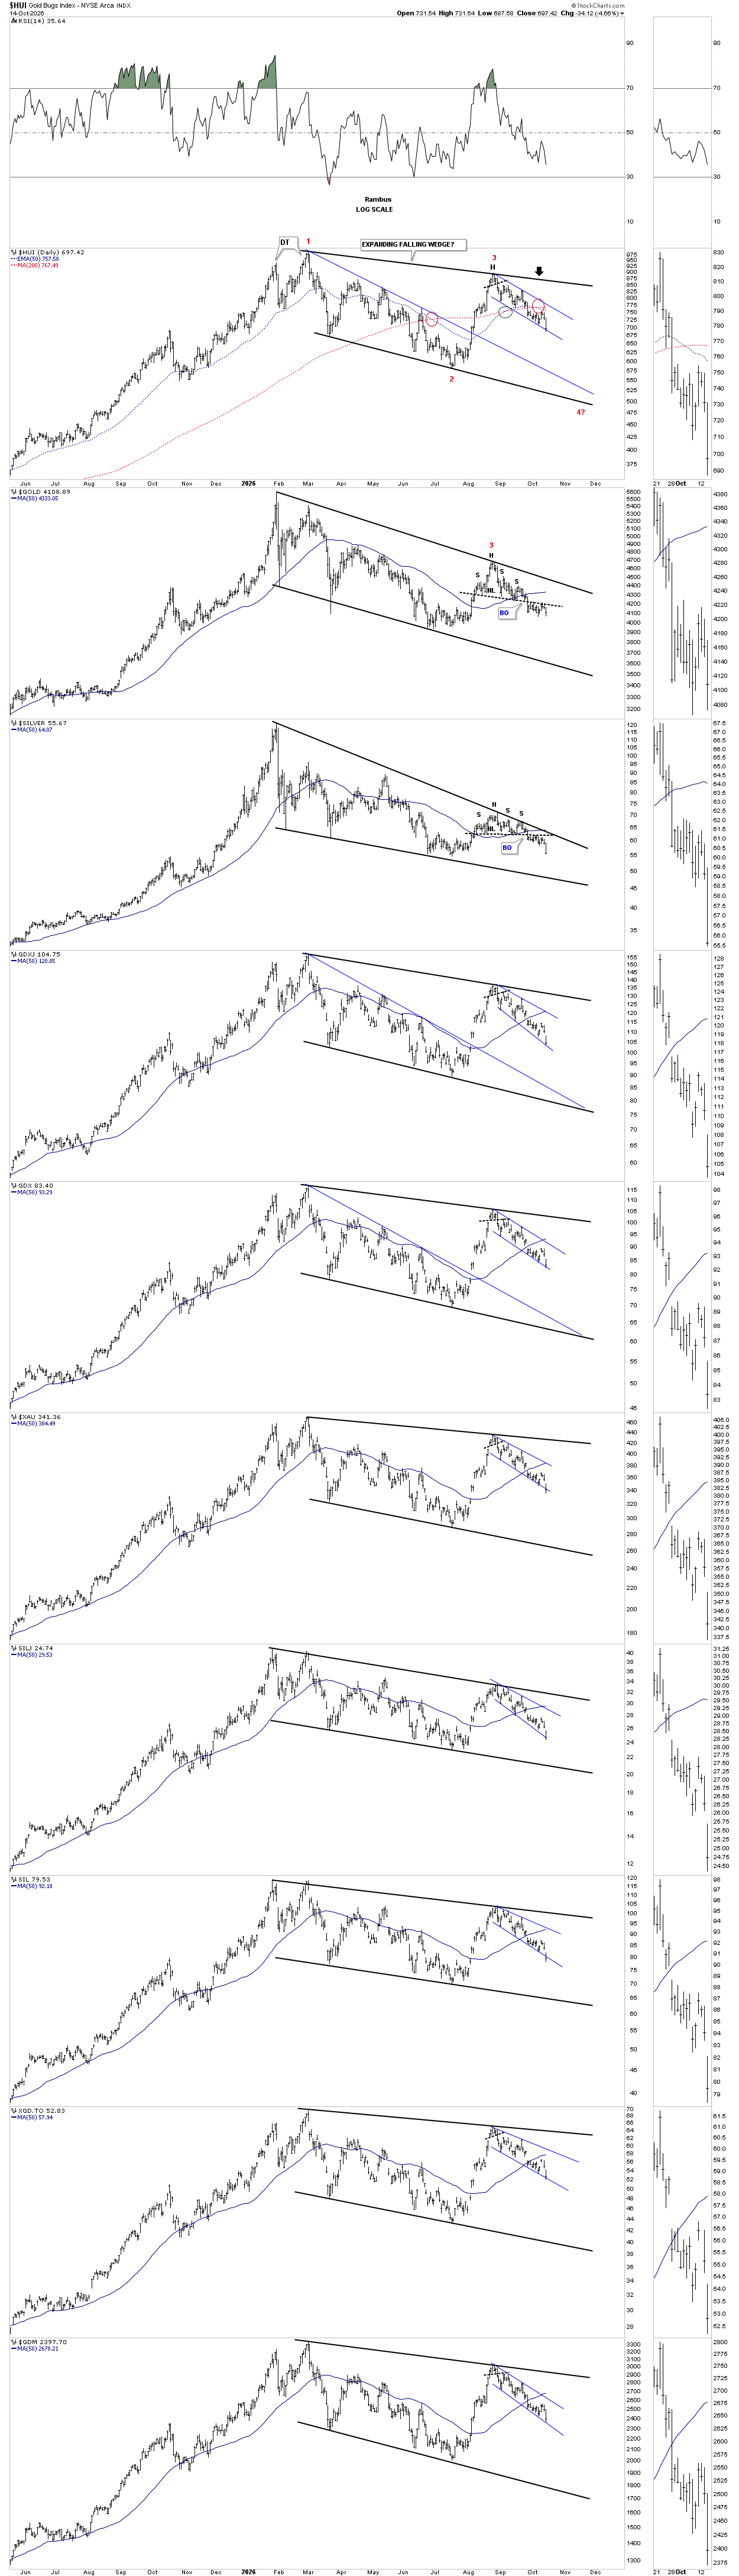
Next is the exact same chart, showing the H&S top at reversal point #3, instead of the blue falling flags. Again, you can see today’s bar made a new lower low, confirming the impulse move down. At some point, we’re likely to see some type of small consolidation pattern start to form within this leg lower.
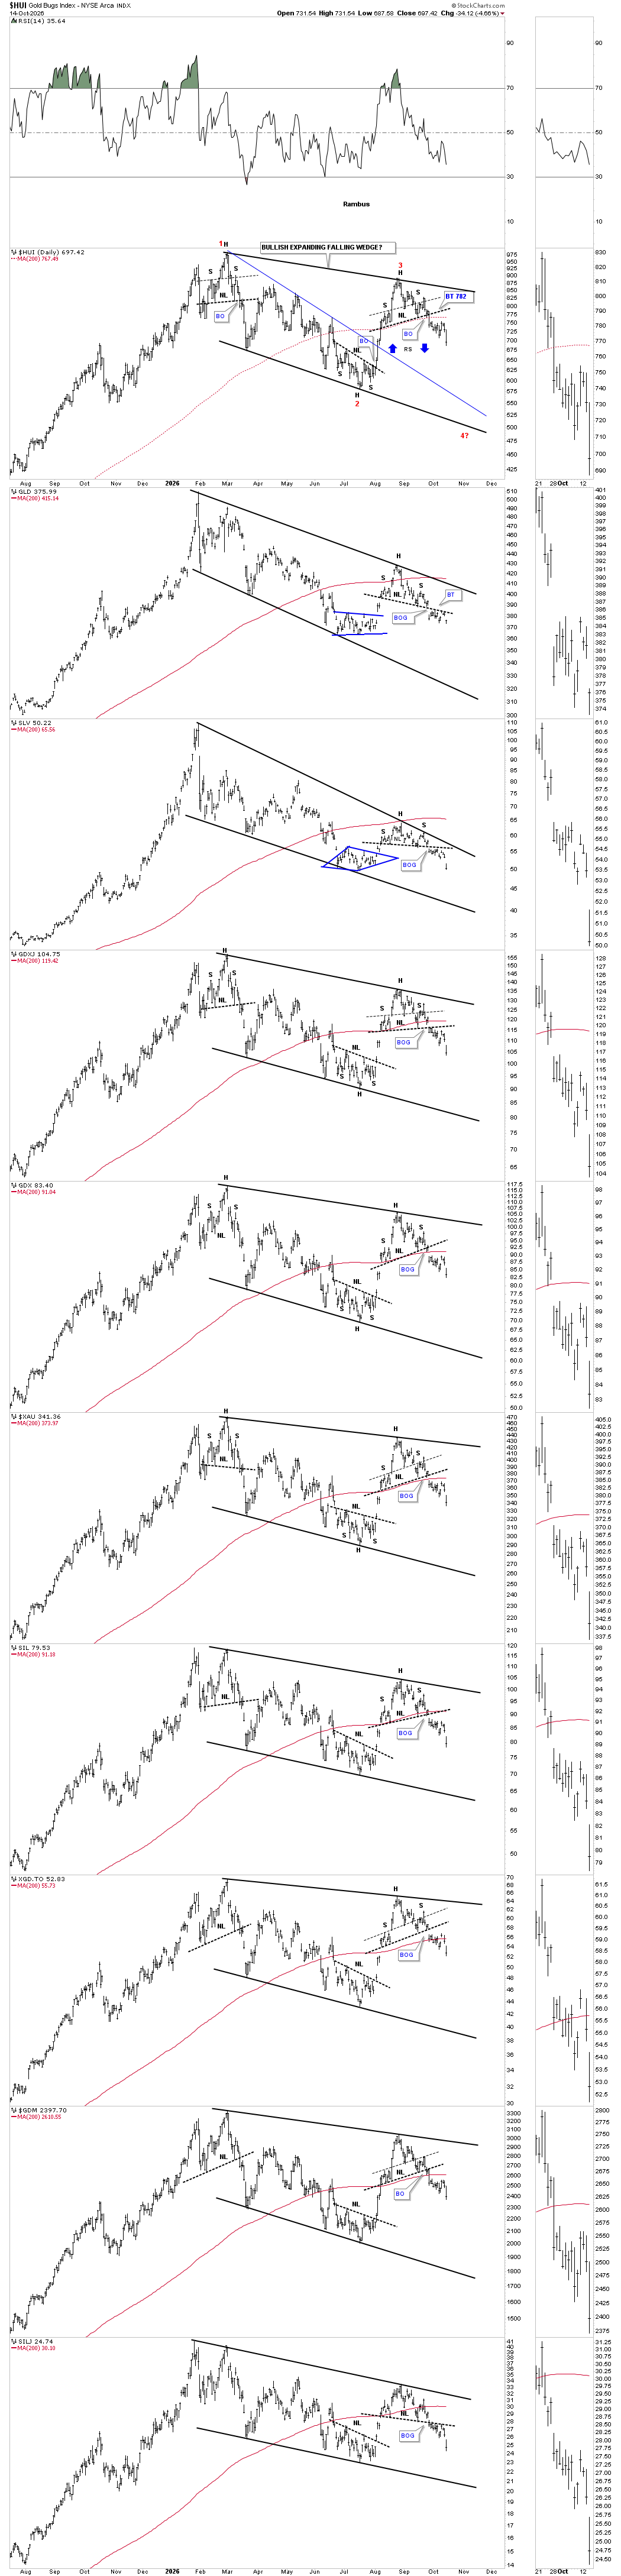
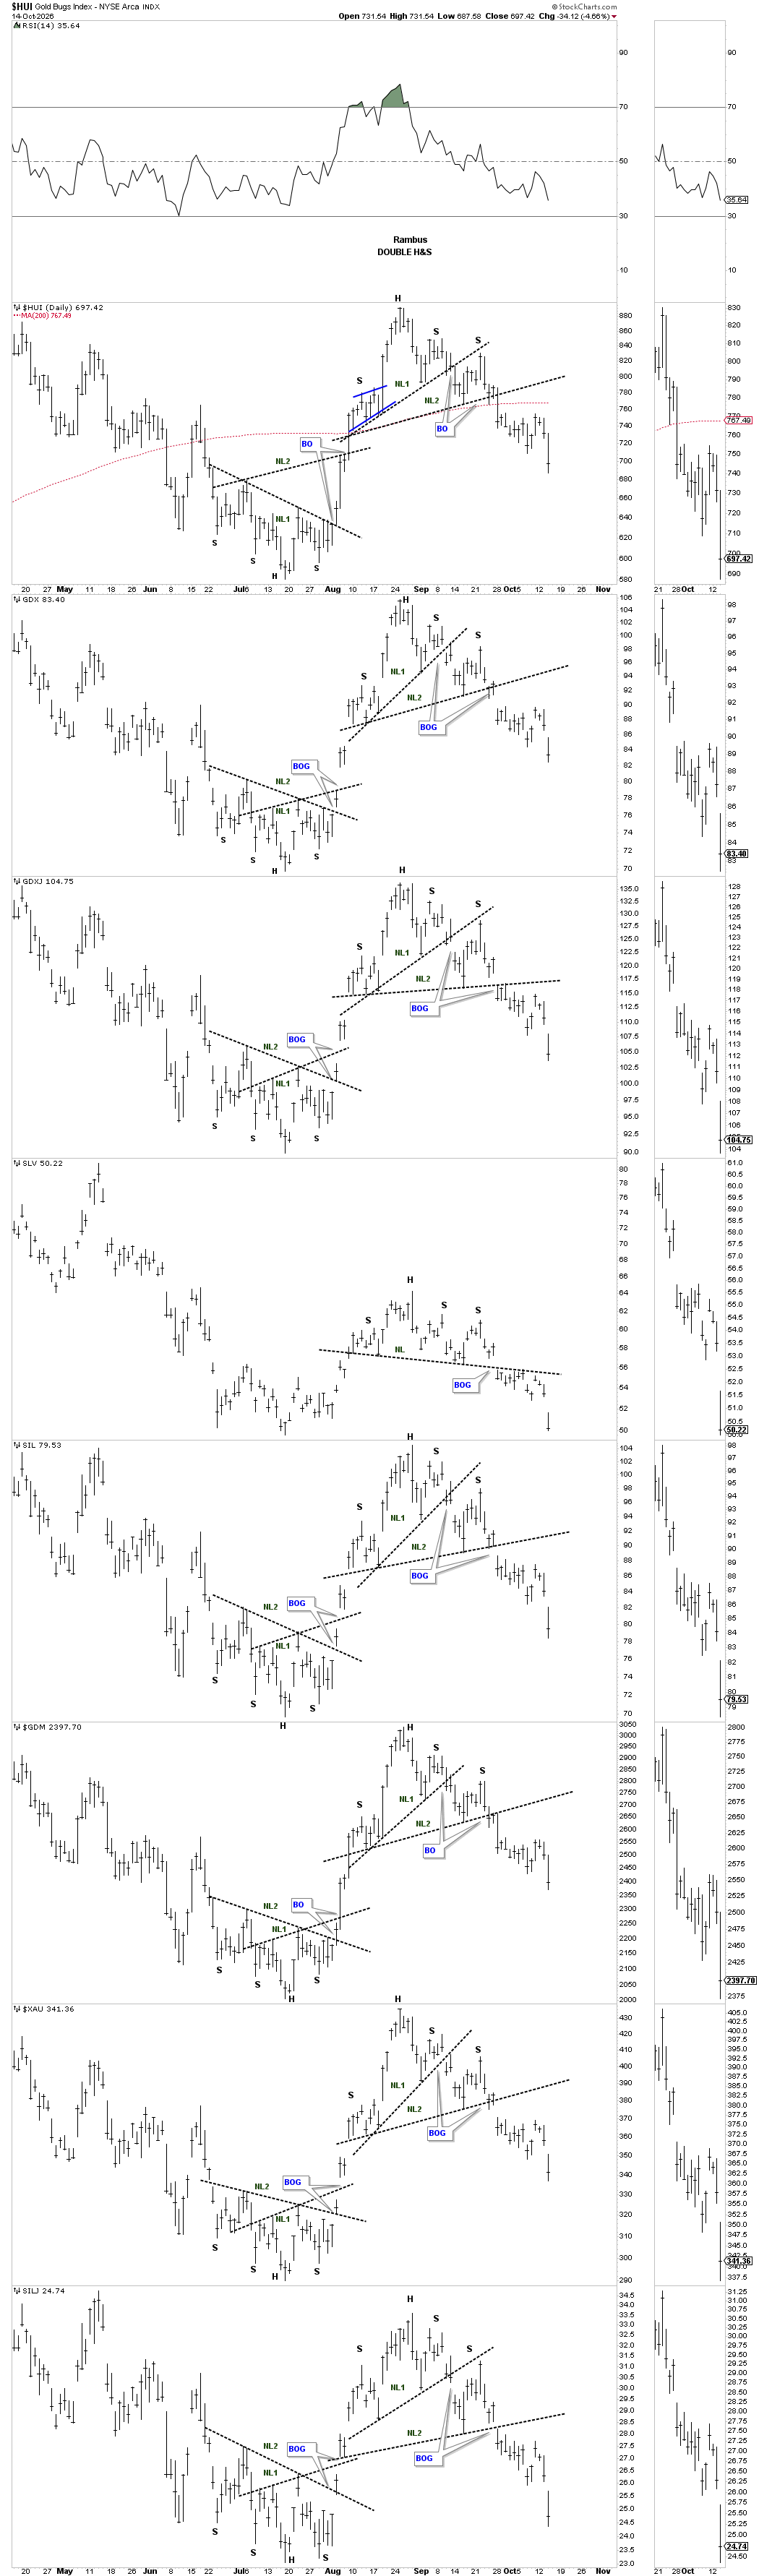
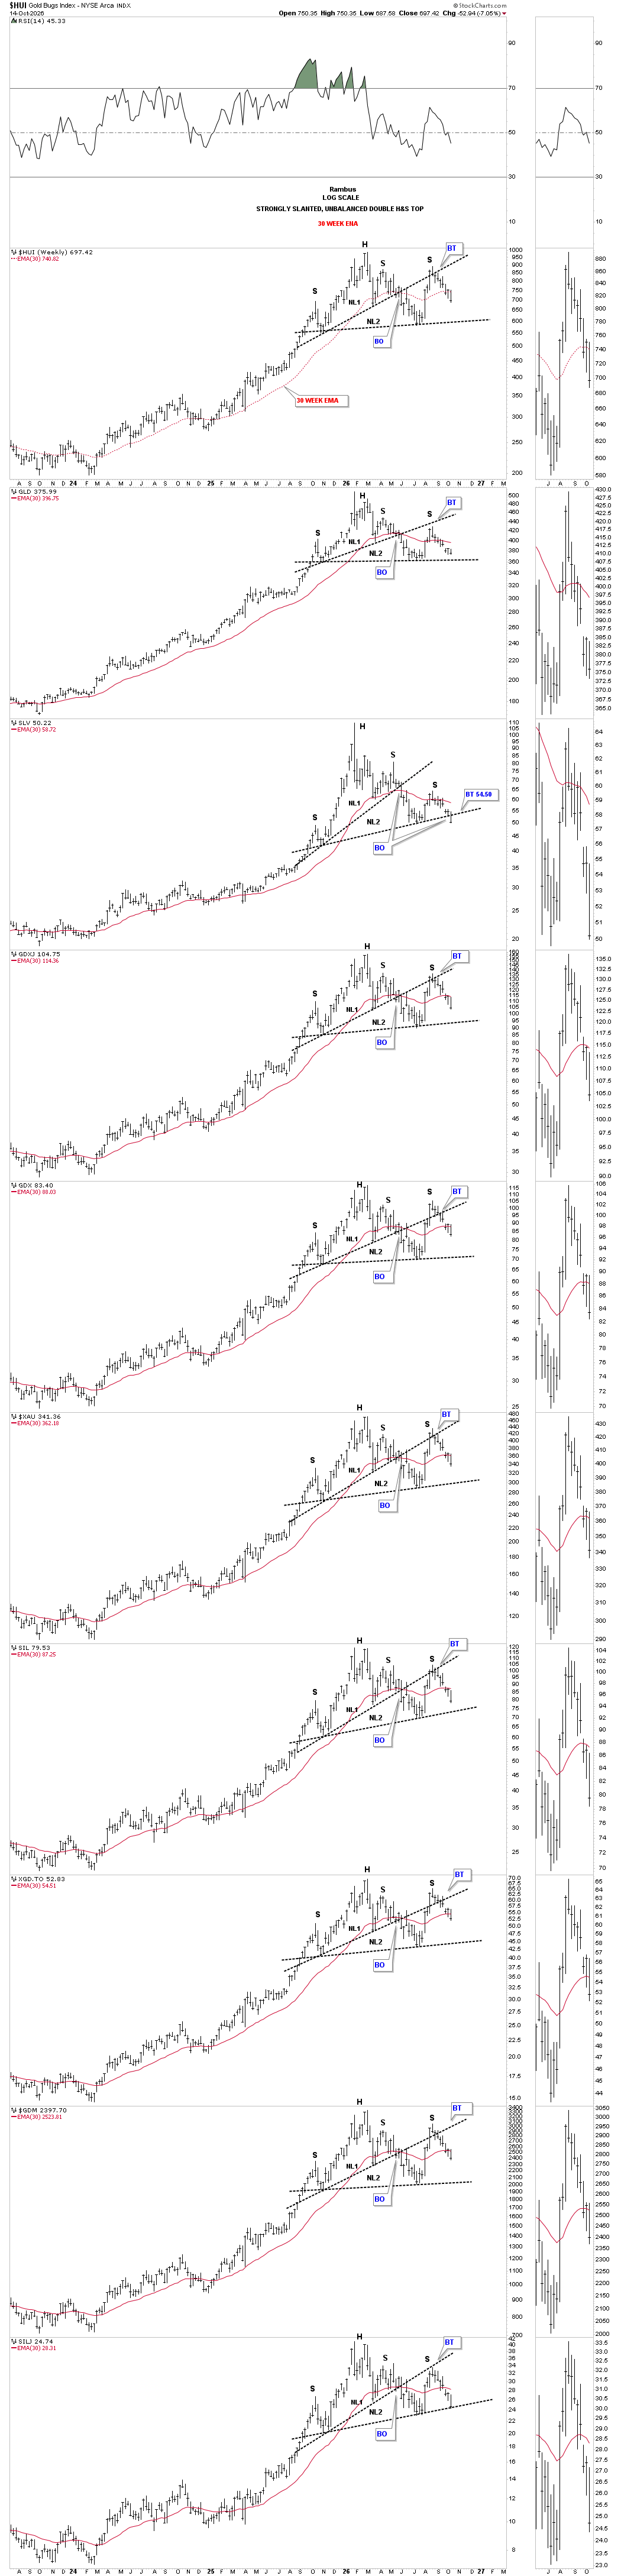
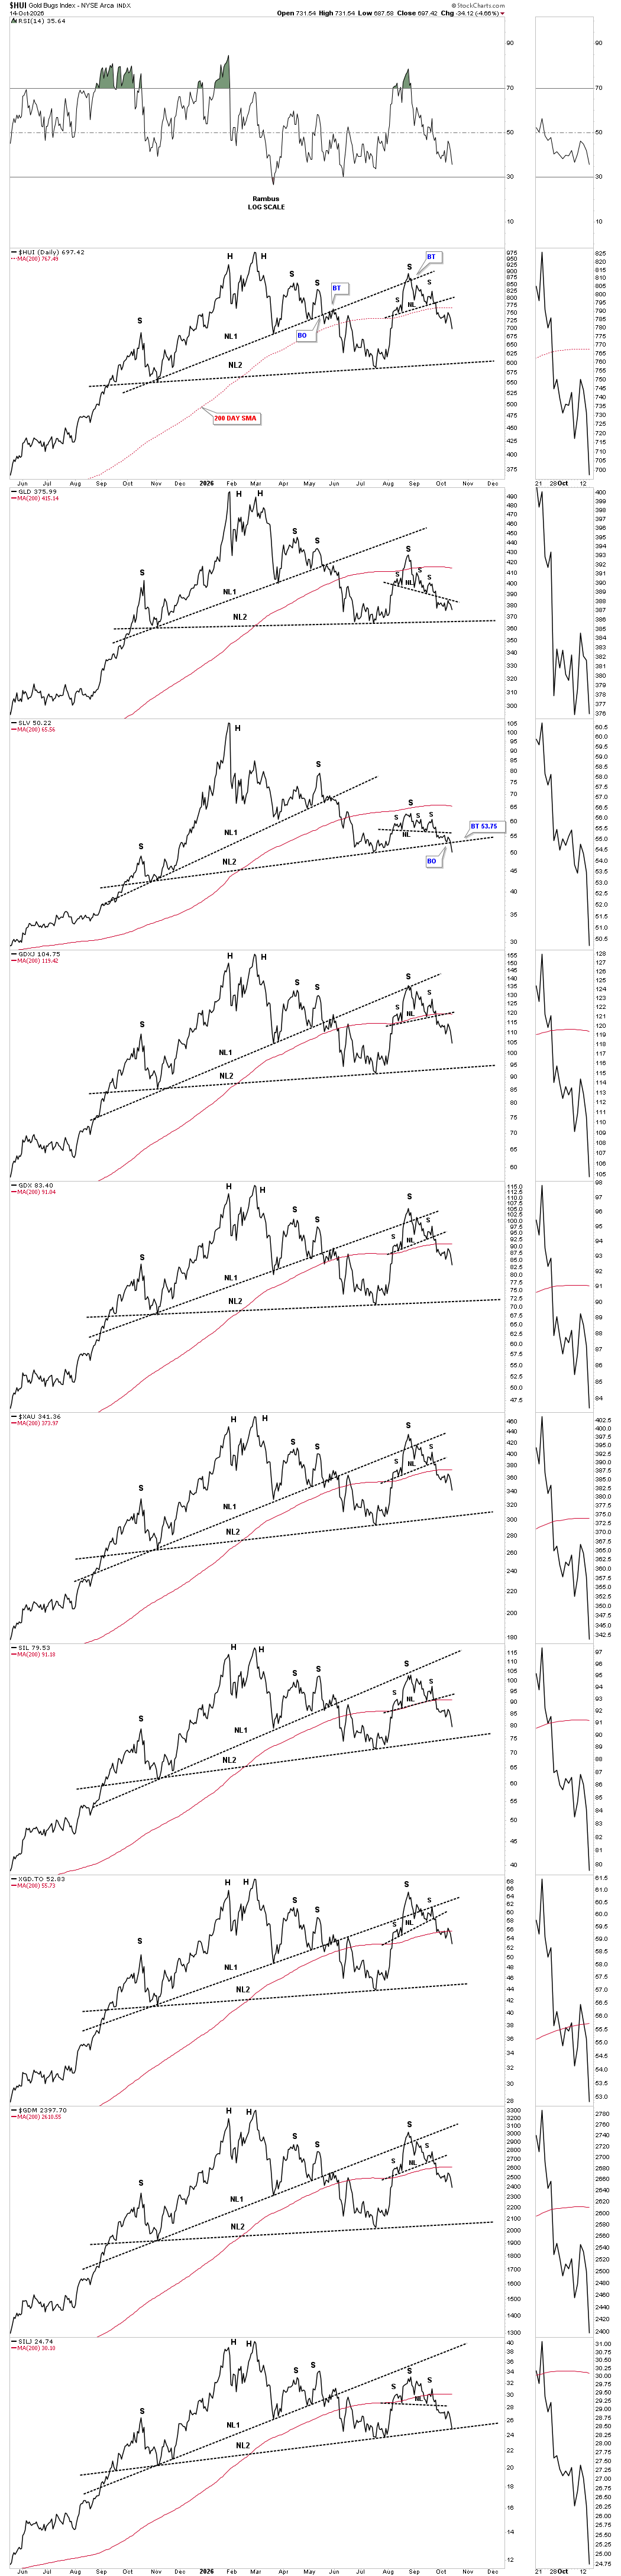
This daily chart shows the exact same strongly slanted, unbalanced, double H&S top as the weekly chart above is showing. From this daily chart perspective, all the indexes are trading below their red 200-day SMA, which is not encouraging if one is a bull.
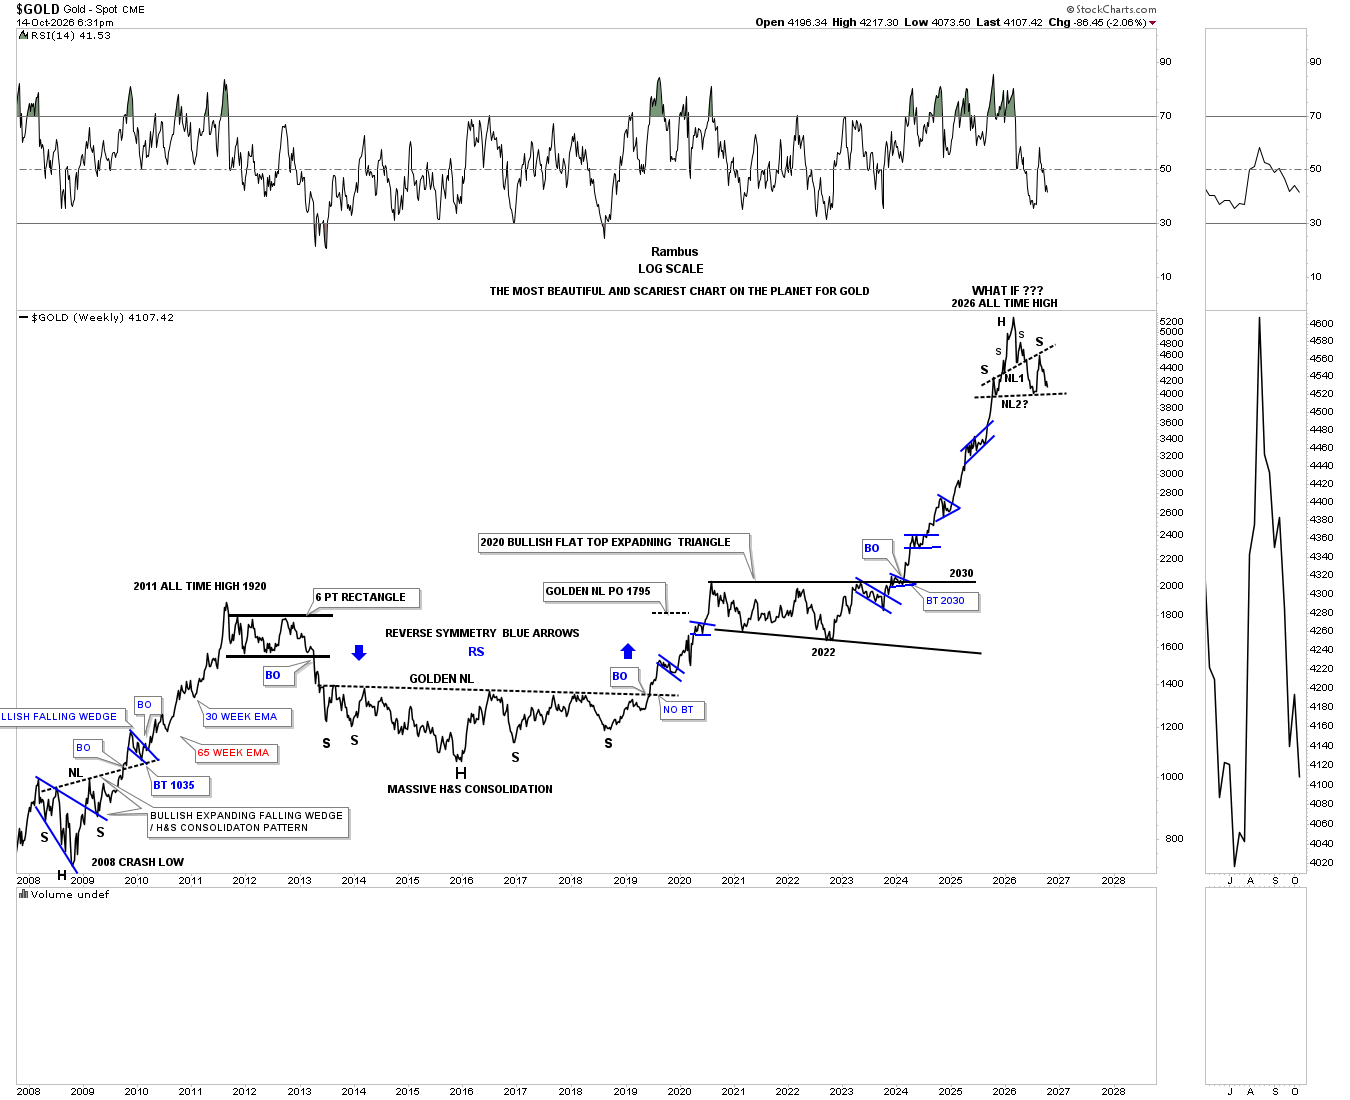
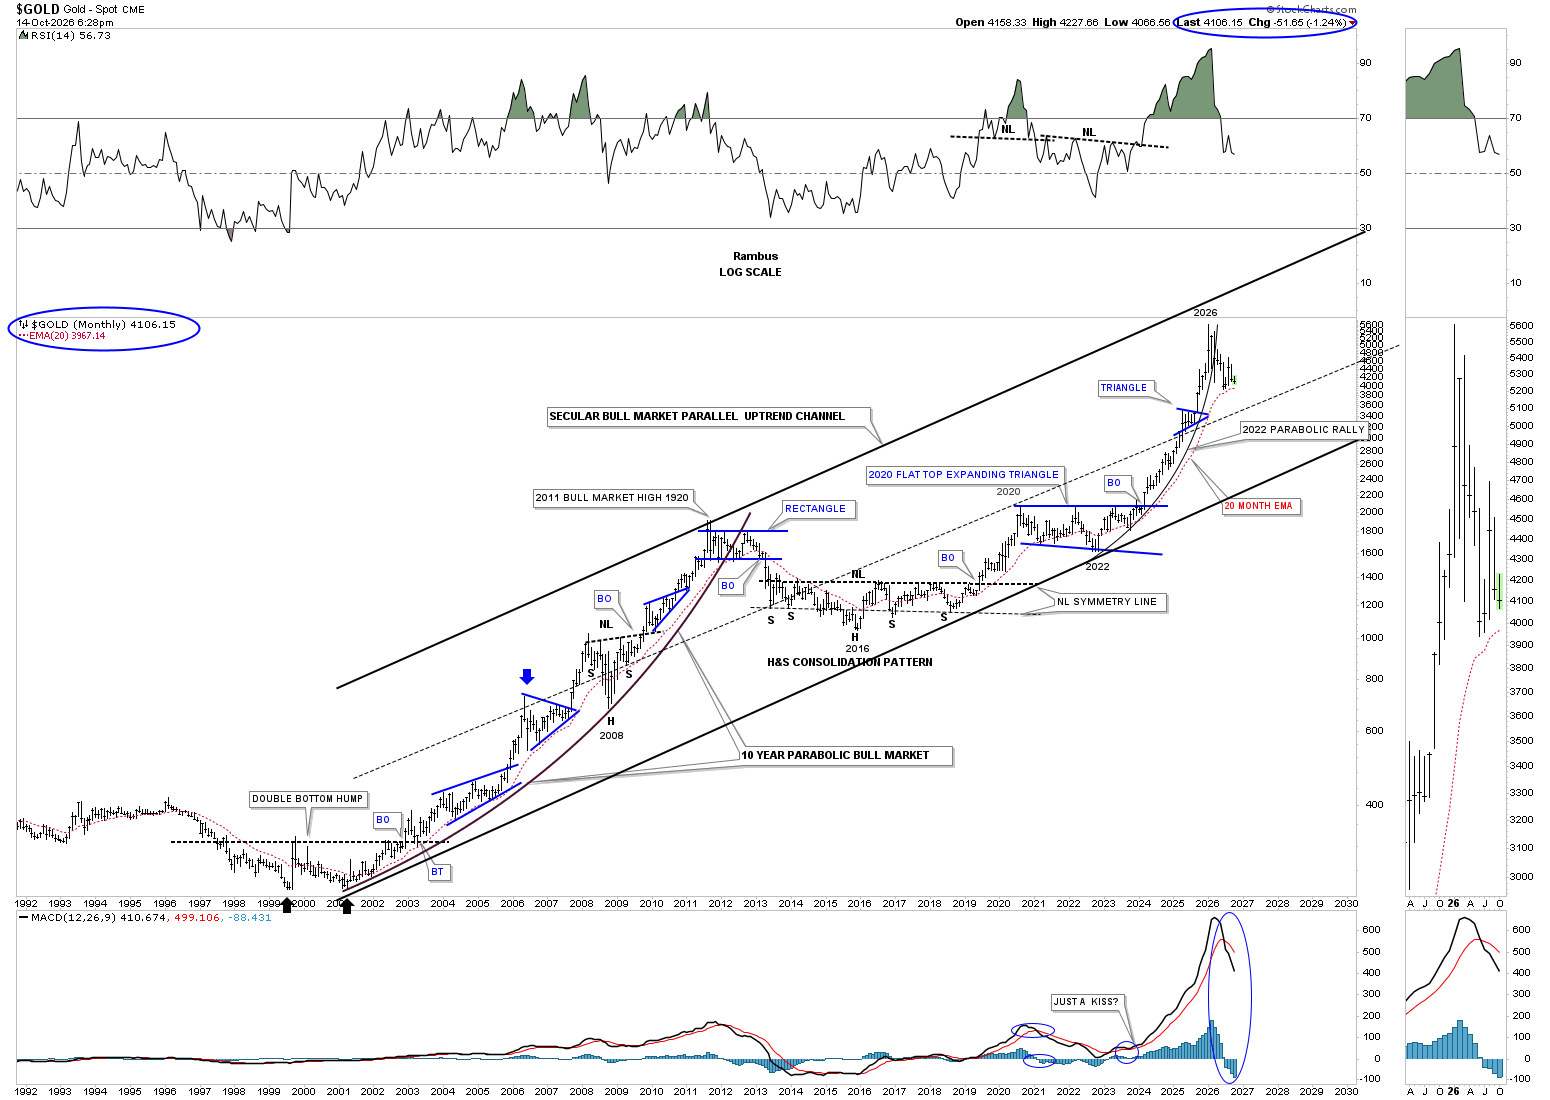
On Monday and Tuesday, gold continued to backtest its neckline around the 1425 area, but unlike the PM stock indexes above, it didn’t make a new lower low yet.
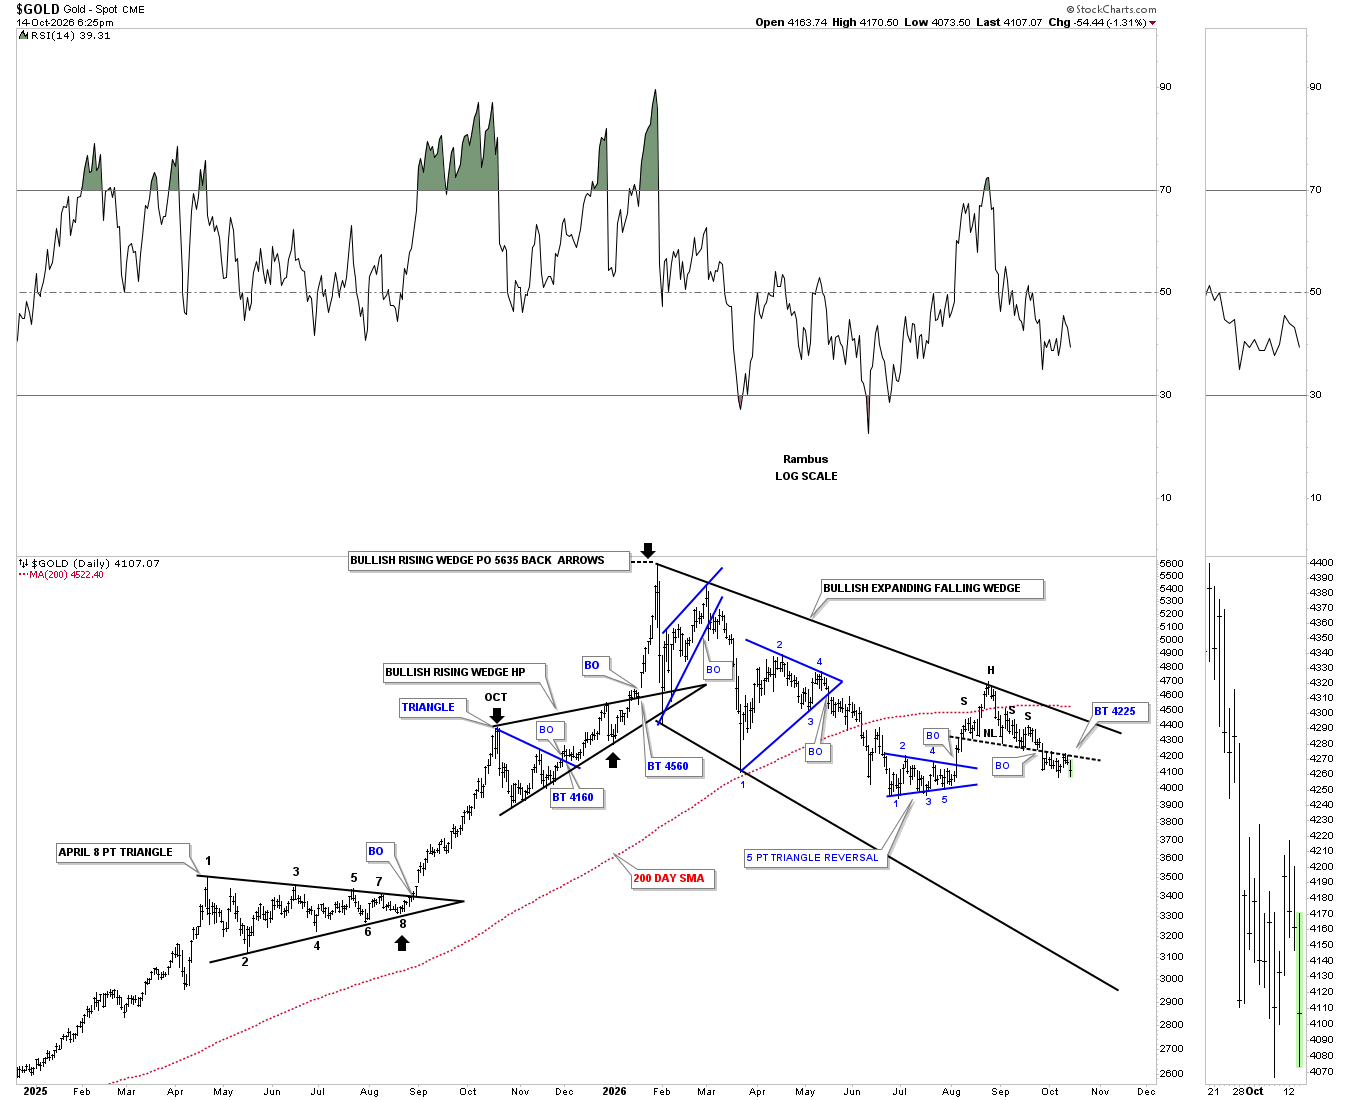
The longer term daily line chart shows the last two measured moves into the 2026 all time high.
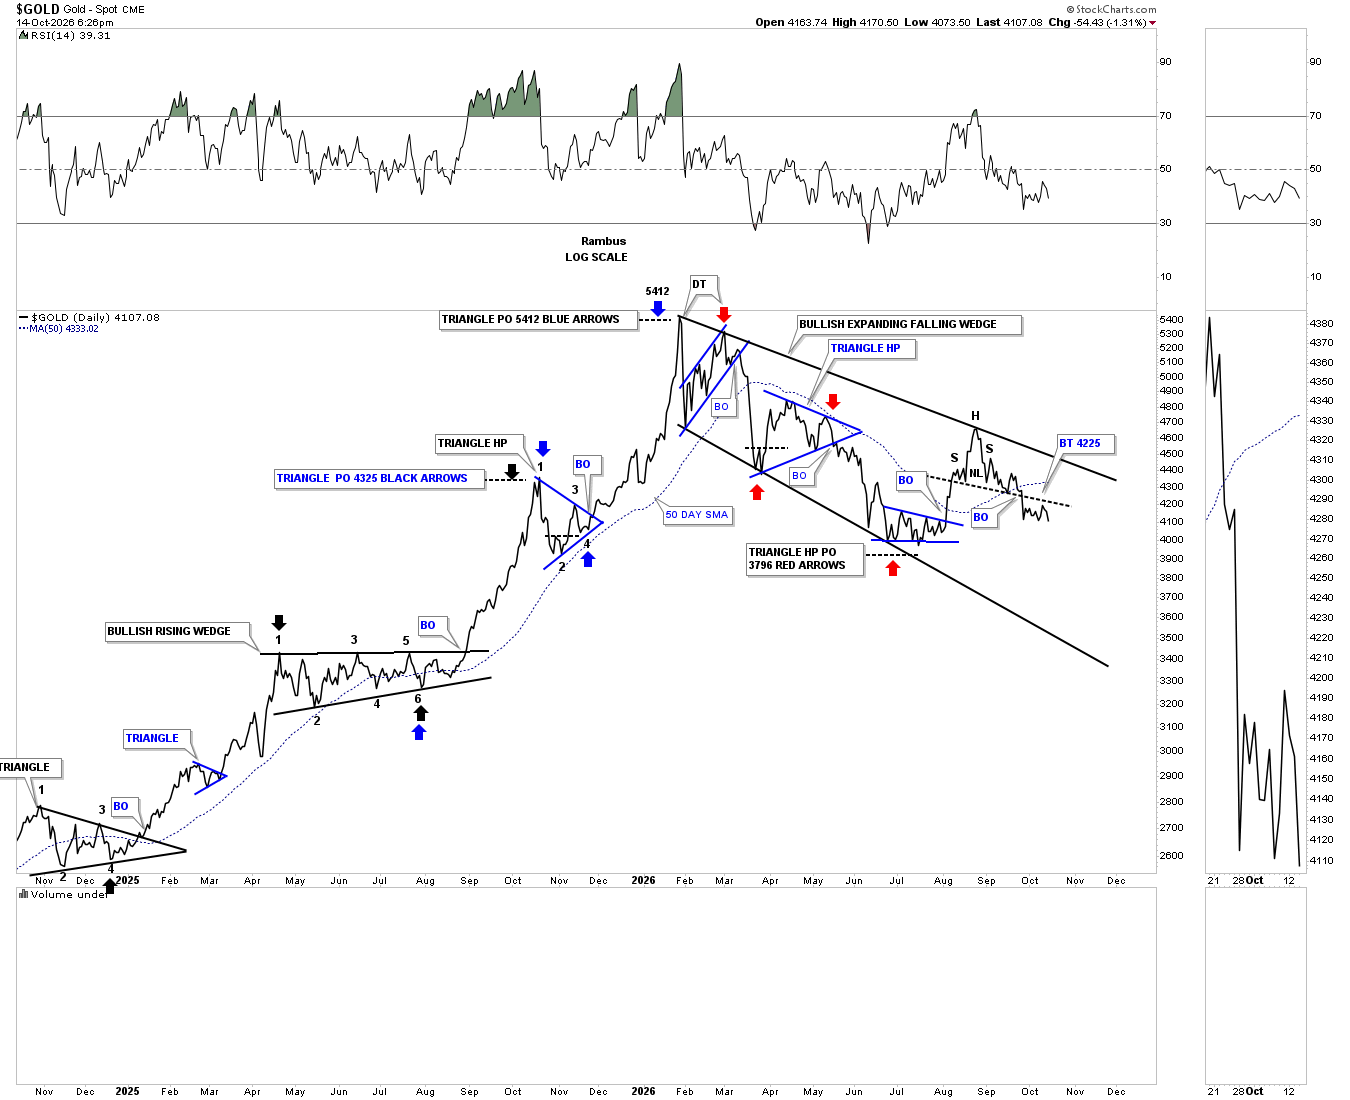
What’s difficult when you spot an H&S top early on is you have to wait for confirmation when the neckline breaks, which can feel like an eternity. The wait continues.
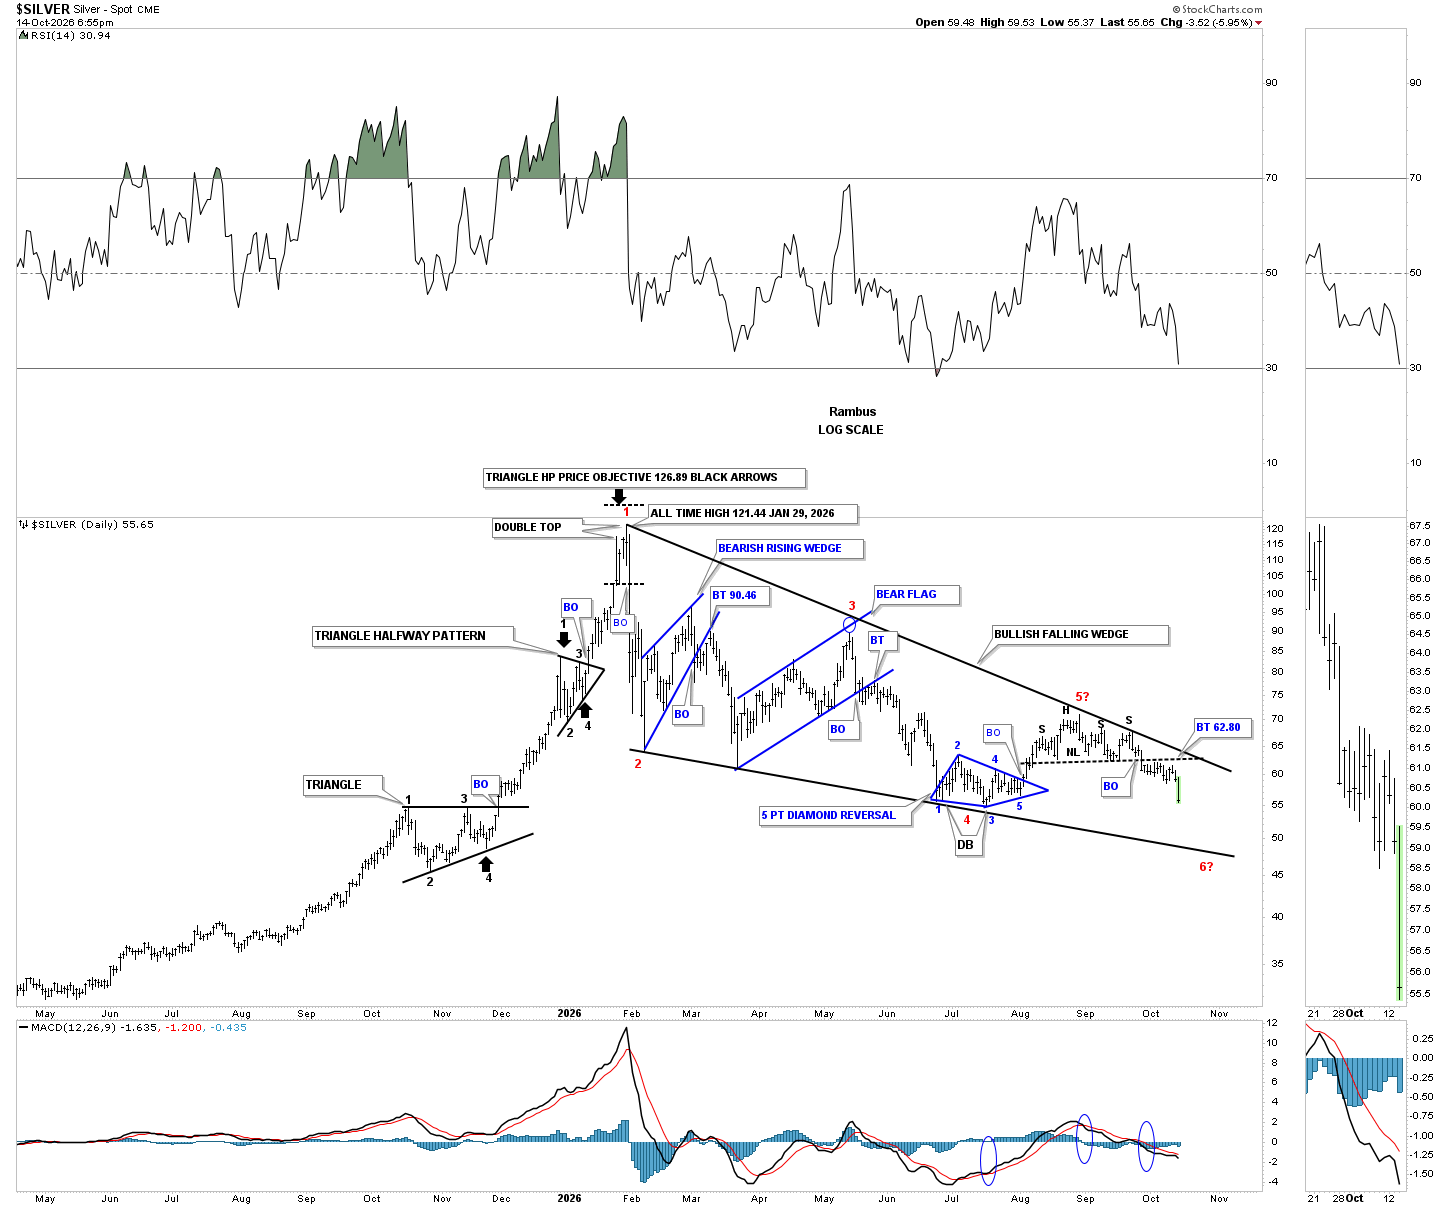
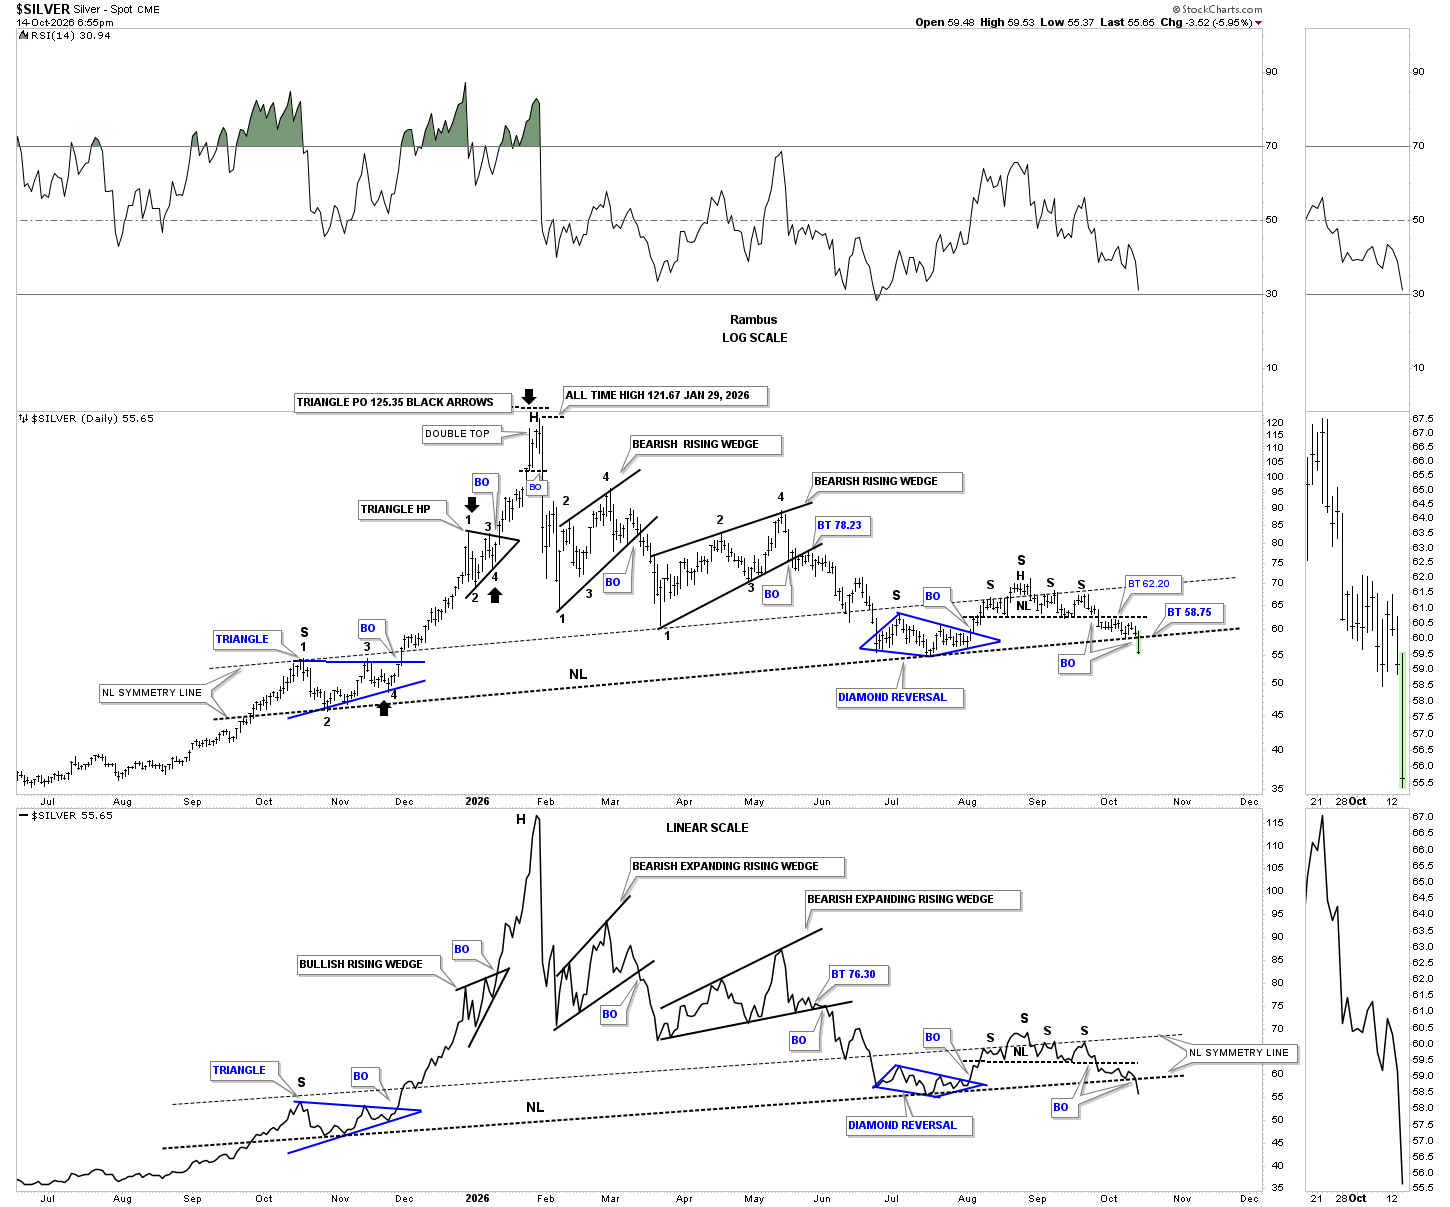
Silver has clearly broken out from its small H&S top, which formed just below the top trendline of its January 2026 falling wedge. It’s going to be very interesting to see how silver reacts to the bottom trendline of the 2026 falling wedge, which could be in the mid-40s.
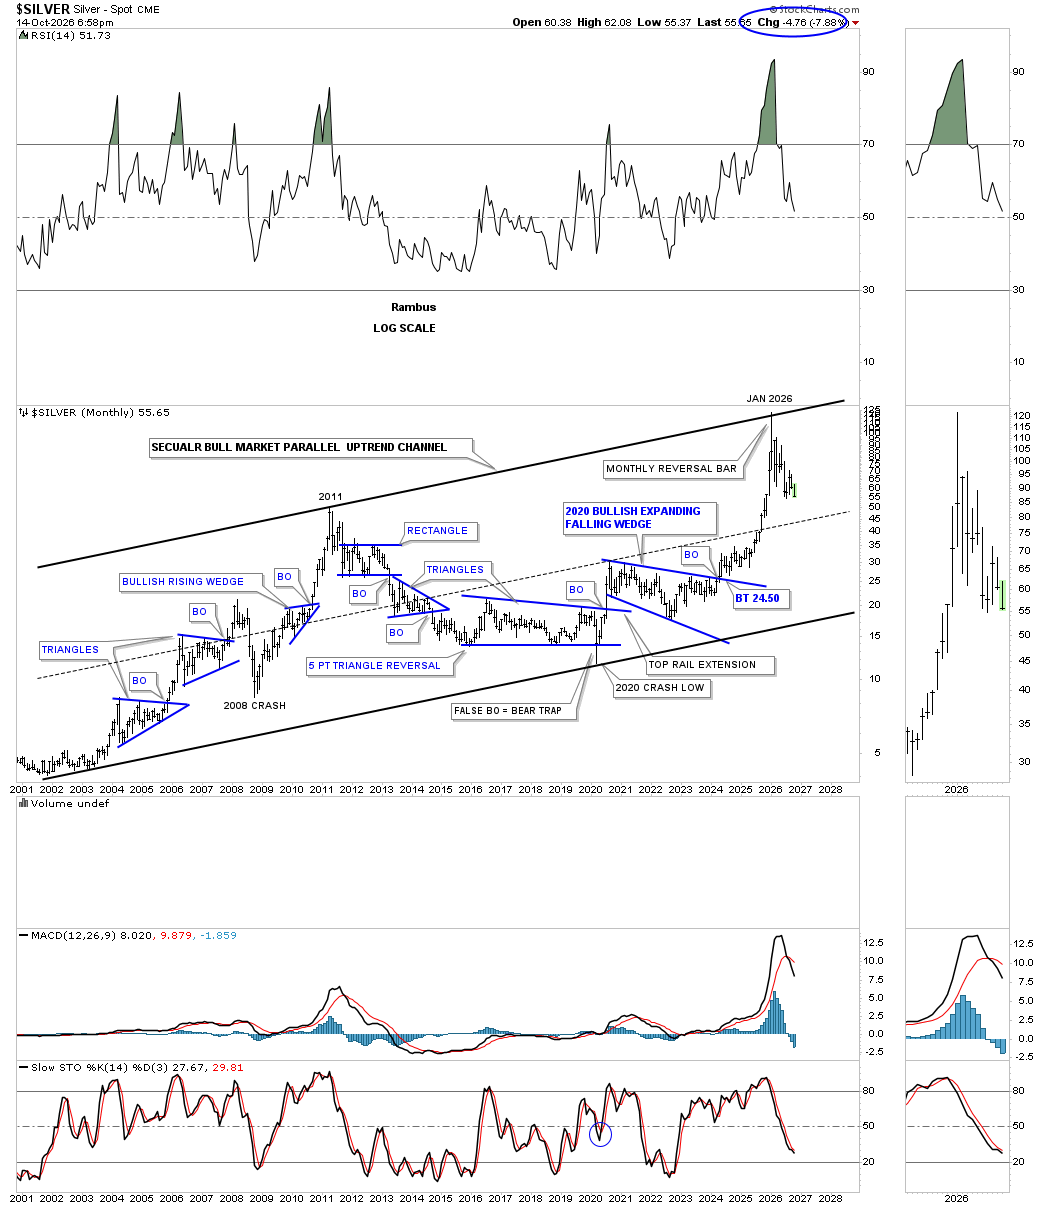
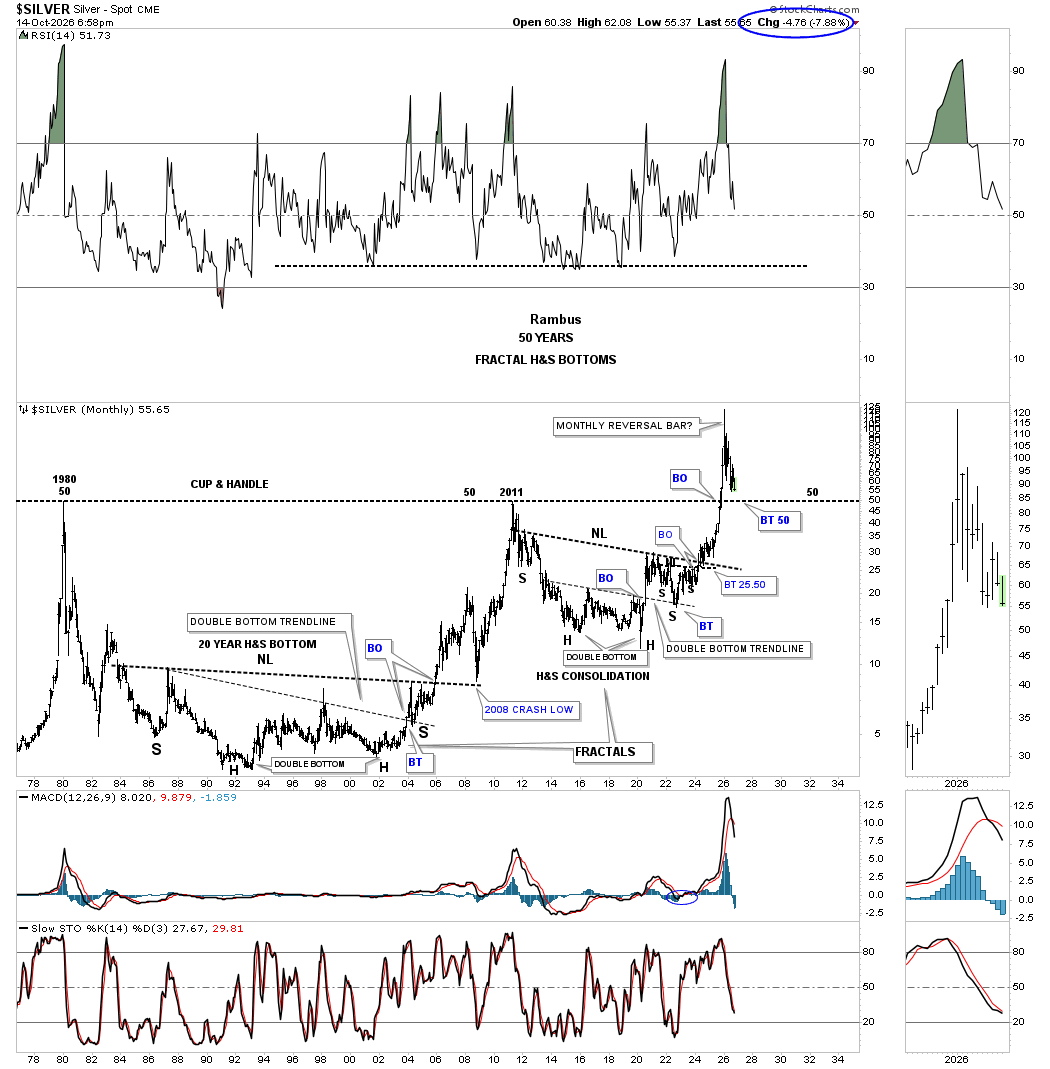
This long-term monthly chart for silver shows its 2002 parallel secular bull market uptrend channel. Unlike gold, which failed to reach its top trendline, silver hit the top trendline, forming a massive monthly reversal bar, which was a major warning shot across the bow at the time.
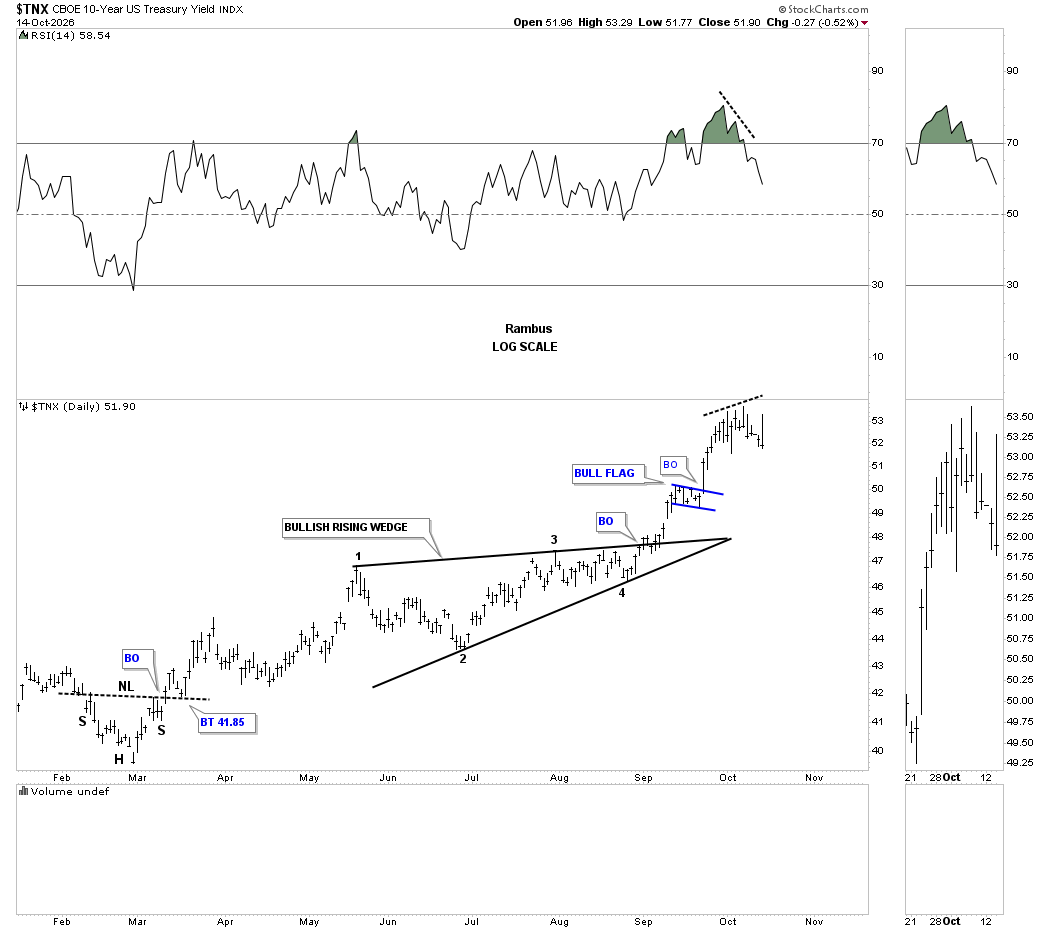
A quick update on the TNX. In the Weekend Report, we looked at the divergence taking place on this daily chart with the RSI, with today’s price action showing a possible outside reversal bar.
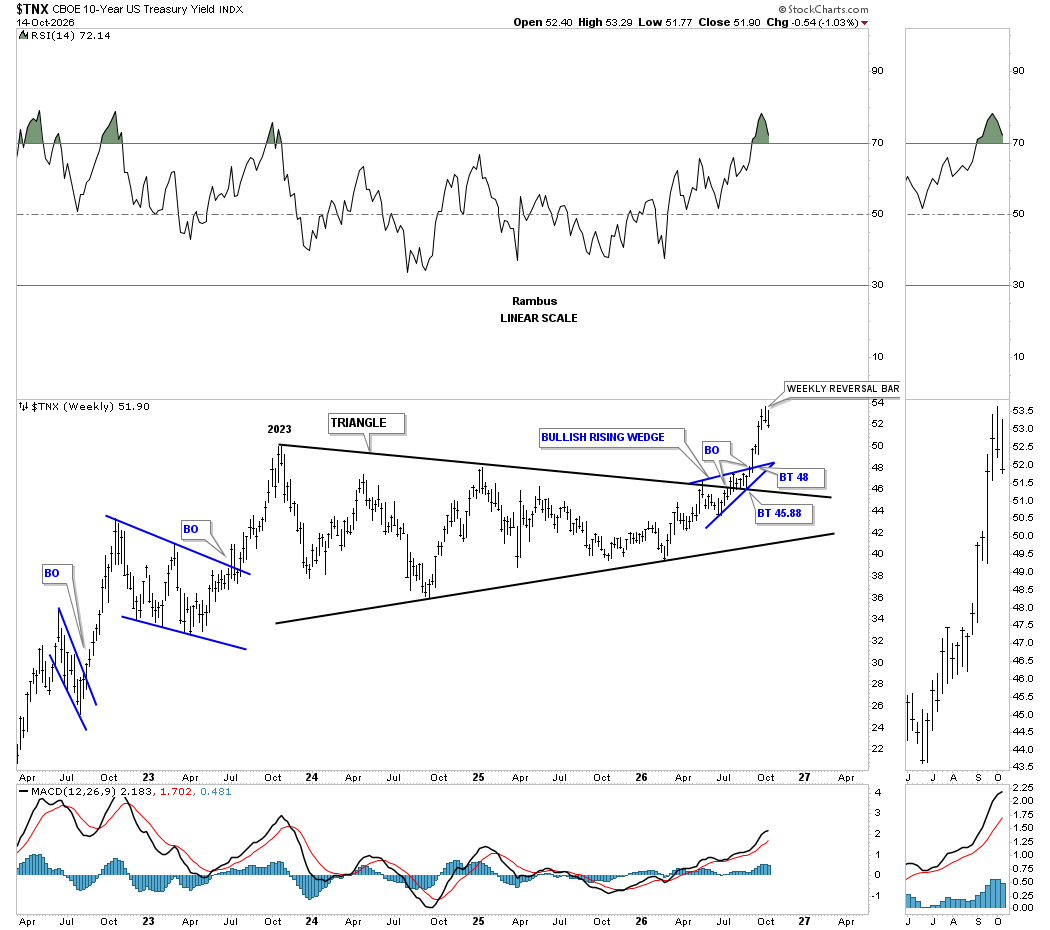
We also looked at this weekly chart, which was showing a weekly reversal bar, which is still in play as long as the price action doesn’t close above the high of the weekly reversal bar.
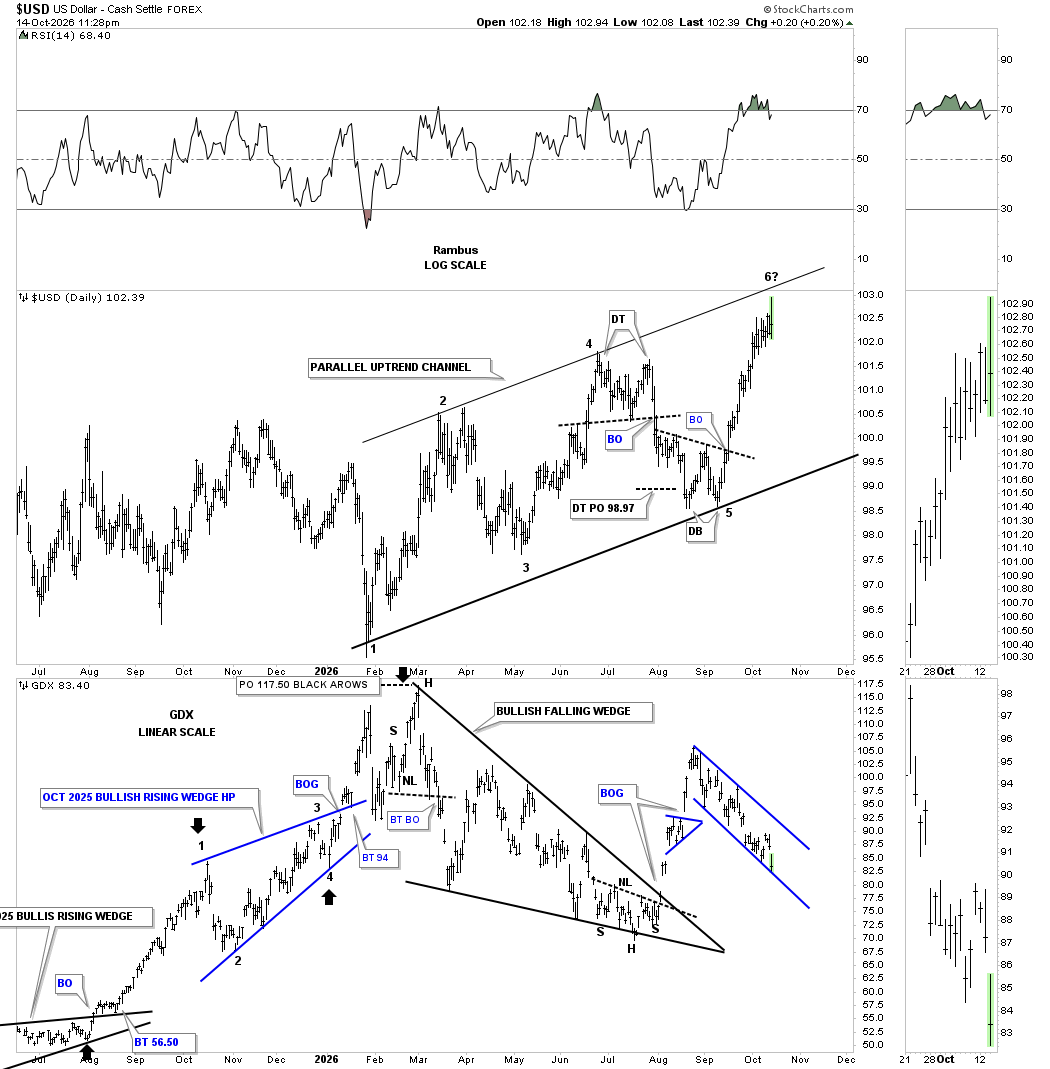
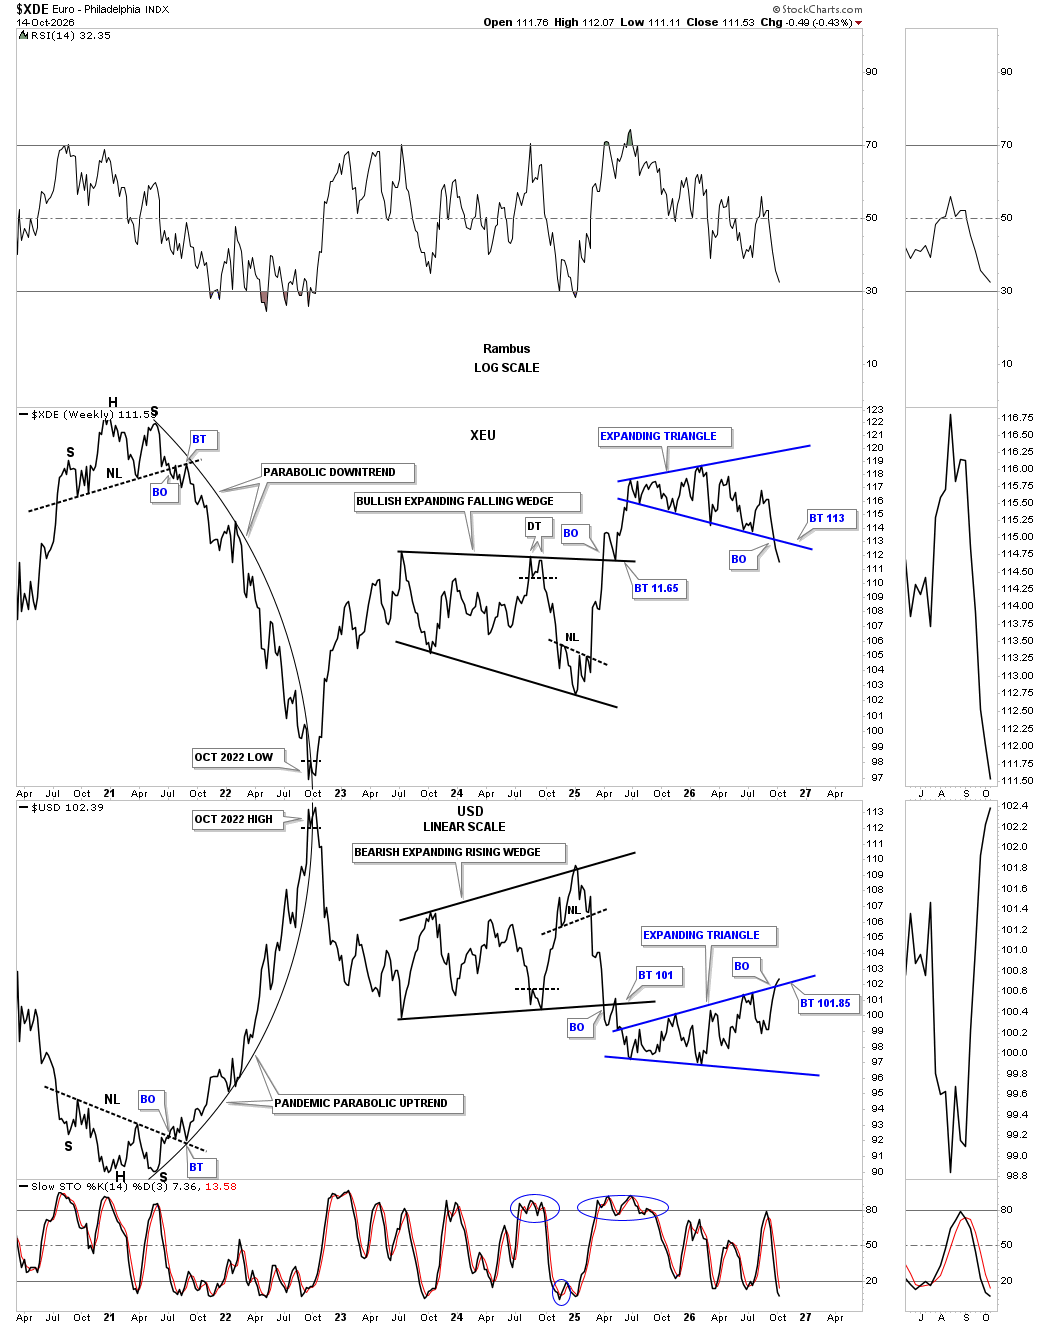
Next up is the daily combo chart for the US dollar on top, with the GDX on the bottom. I went back to the drawing board and found this possible uptrend channel on the US dollar, with the recent rally out of the 5th reversal point low getting very close to the top trendline. As the US dollar went nearly vertical, you can see the GDX formed its blue downtrend channel inversely to the US dollar.
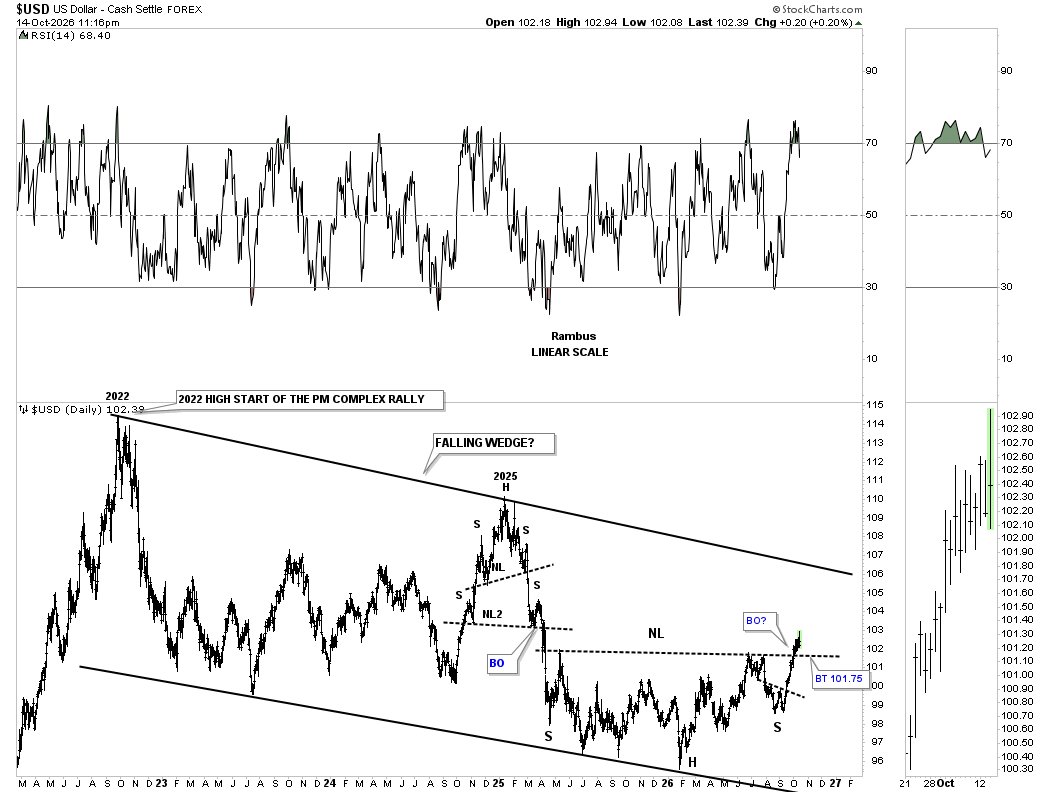
Then we have this longer-term daily chart, which shows the possible 2022 falling wedge, with the inverse H&S bottom forming at the most recent low, complete with a breakout. Now we’ll see if the backtest to the neckline holds support for confirmation.
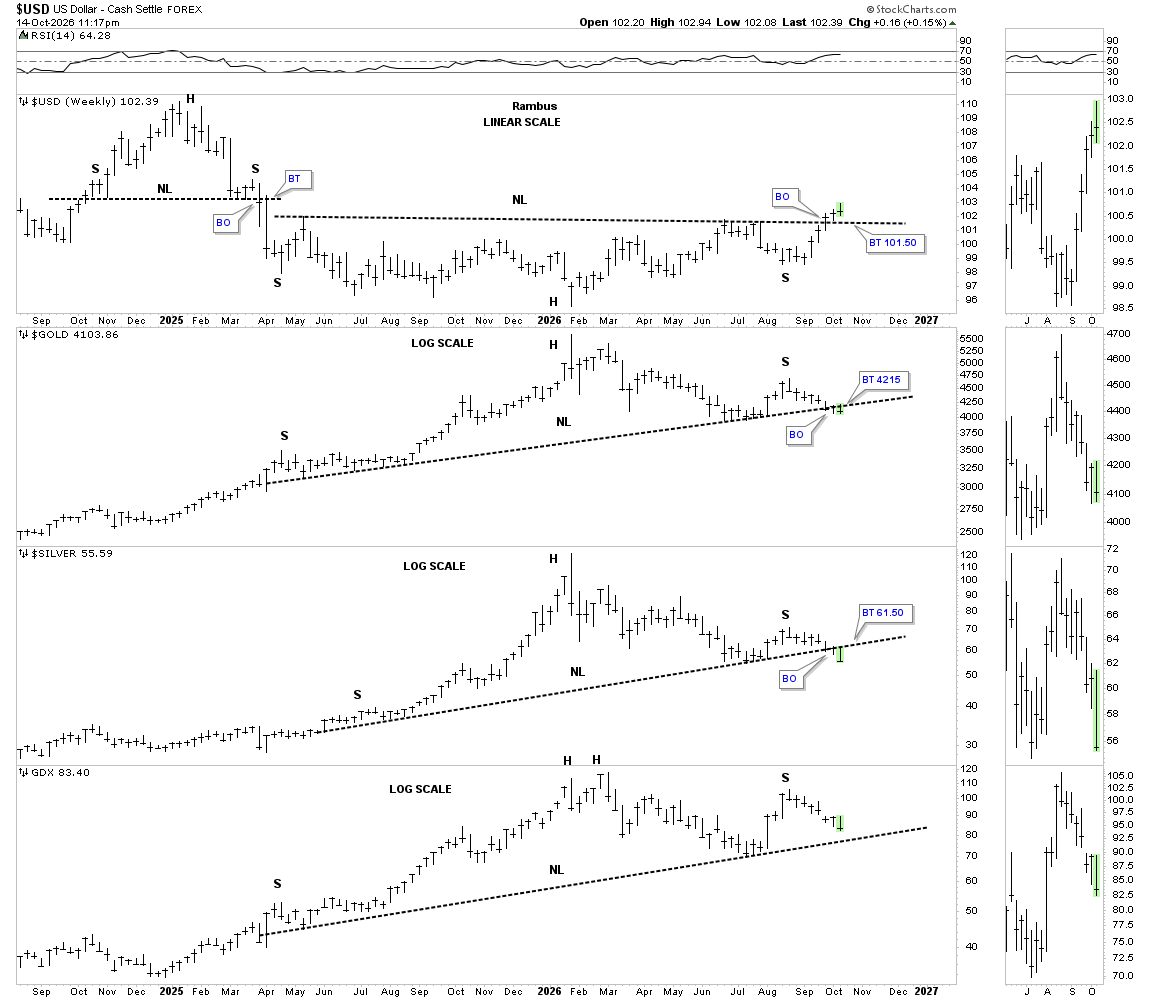
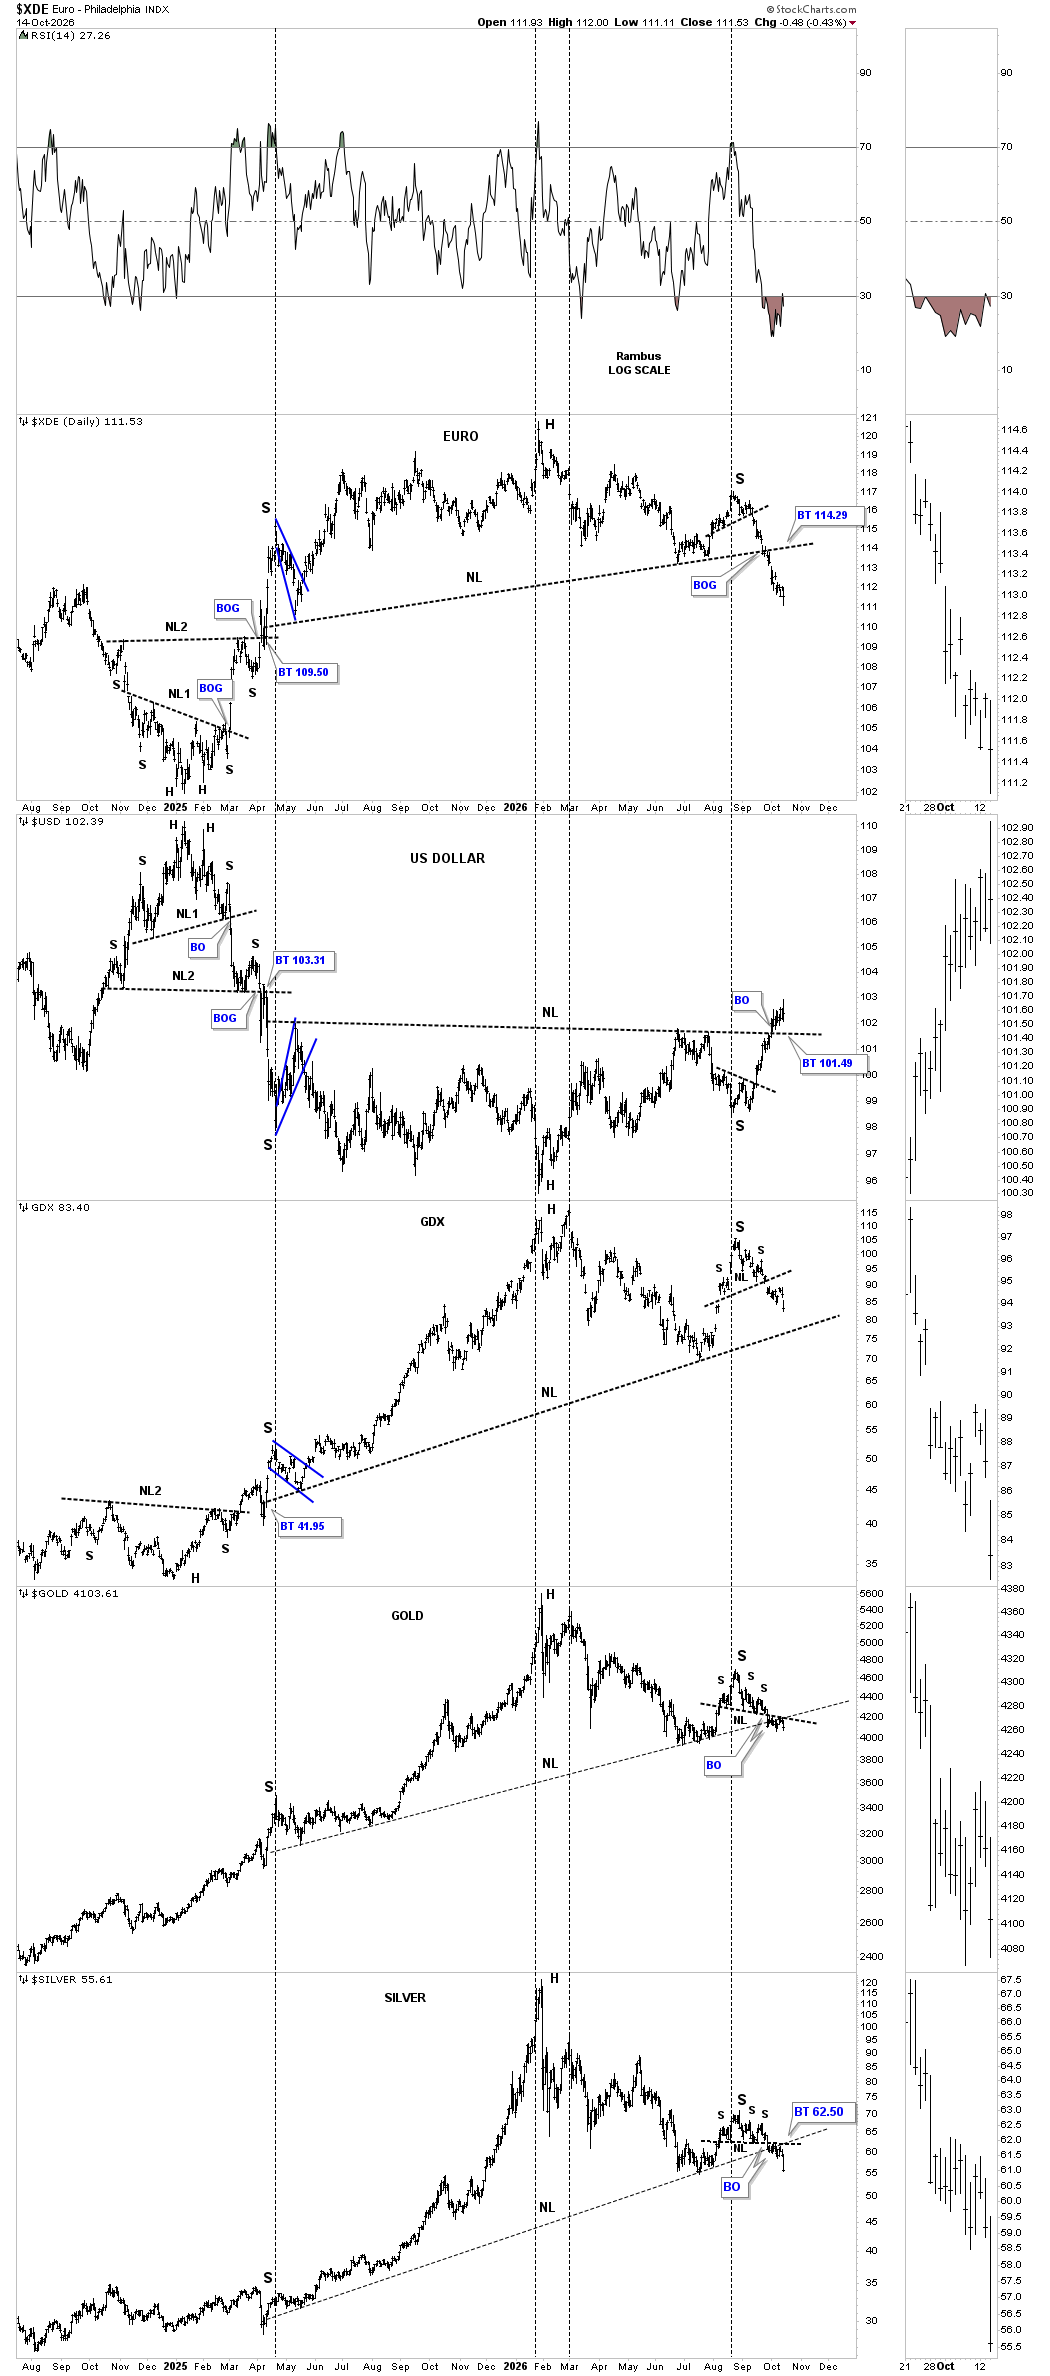
This weekly combo chart has the US dollar on top, followed by gold, silver, with the GDX on the bottom. The US dollar is now in its 3rd week of breaking out above its neckline, with gold and silver closing below their neckline this week, with the GDX not too far behind. This is the moment of truth we’ve been waiting for. Are the backtests going to hold?
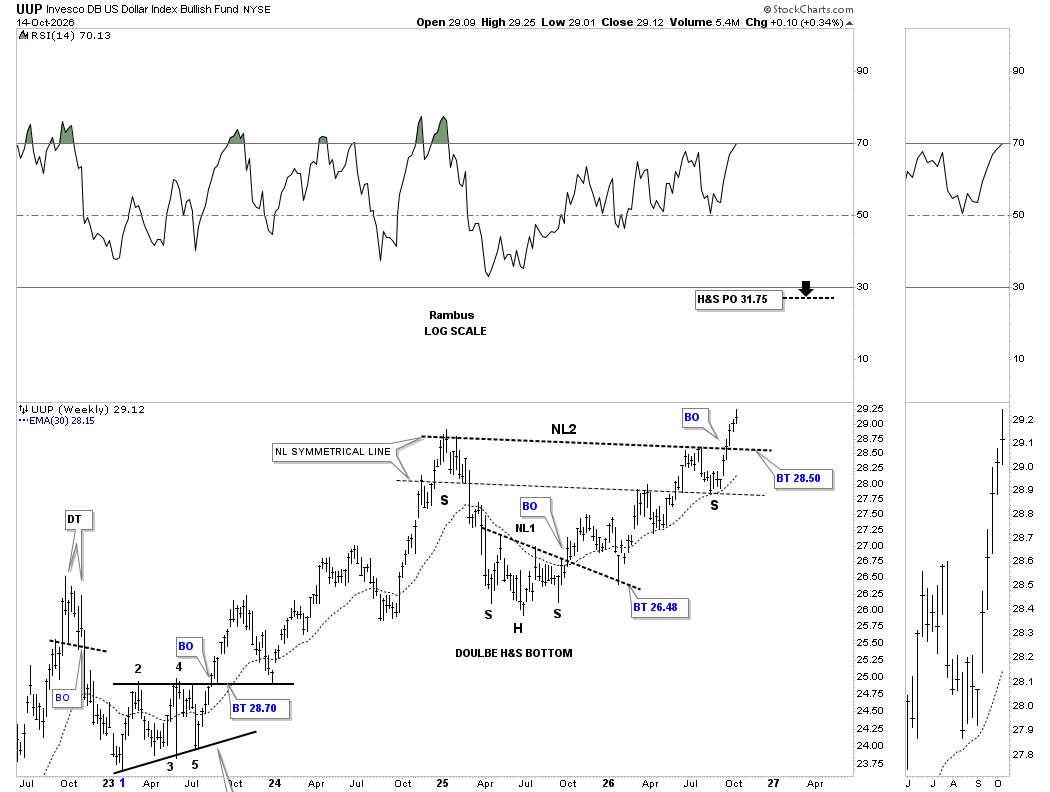
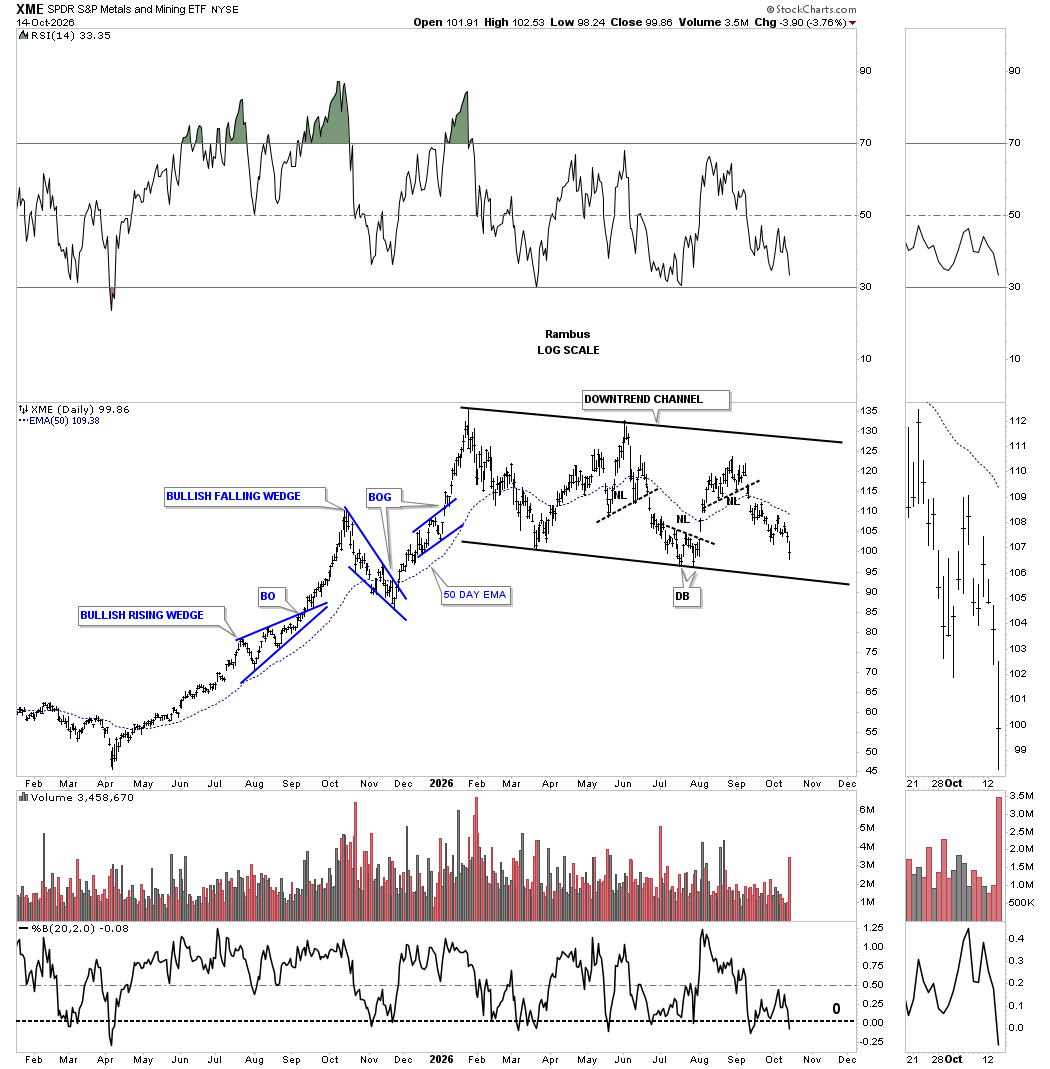
The XME, metals and mining etf, has been locked in the downtrend channel for all of 2026. What’s a little unsettling is that the last reversal point high fell way short of reaching the top trend line which shows weakness. There are also several large cap PM stocks in this index.
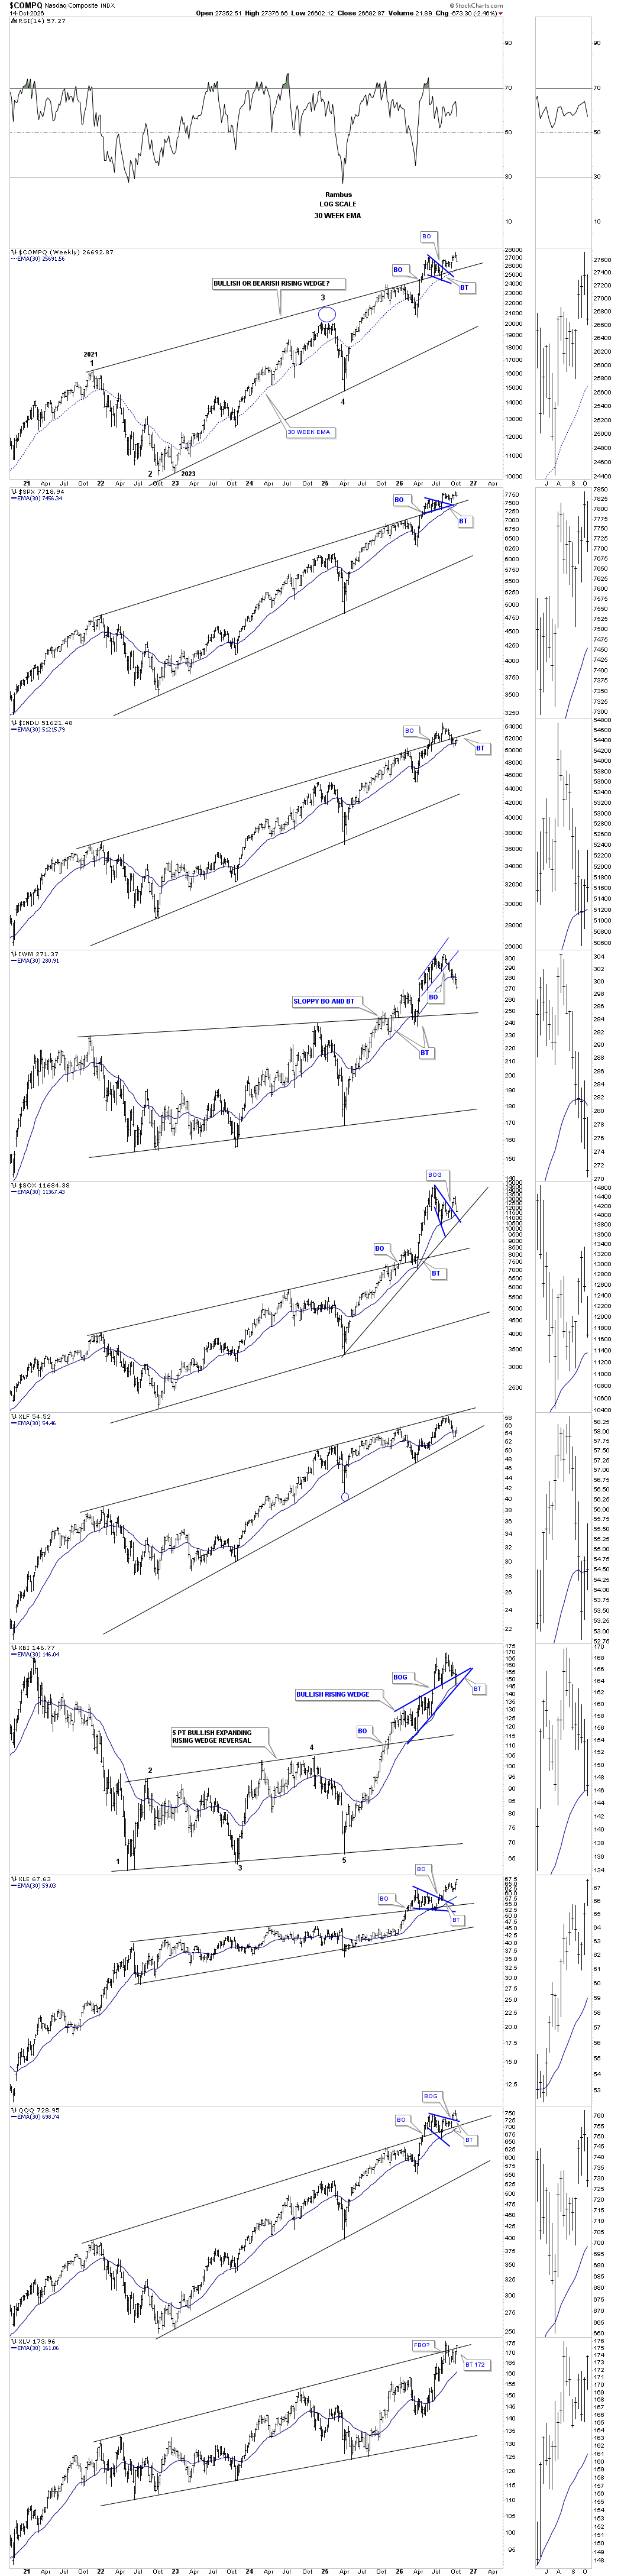
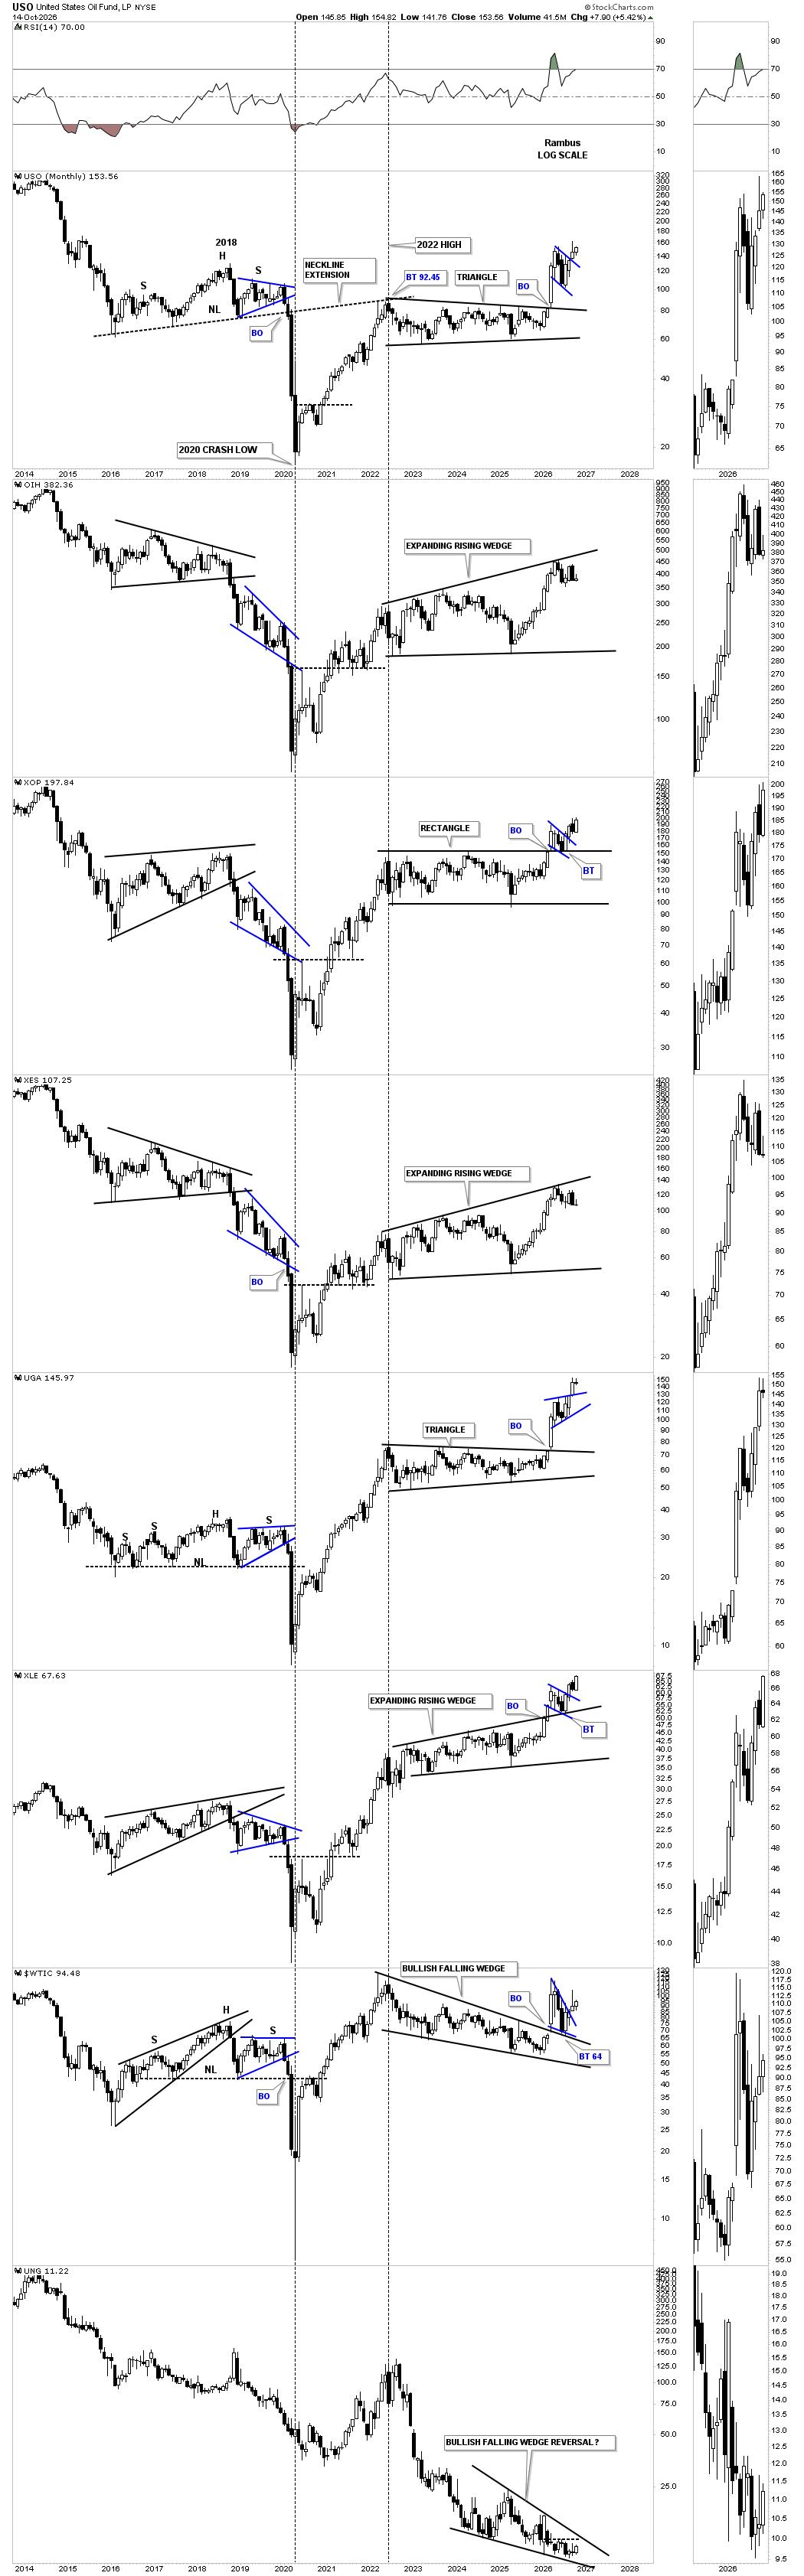
PS: The long term monthly candlestick charts for the energy complex.