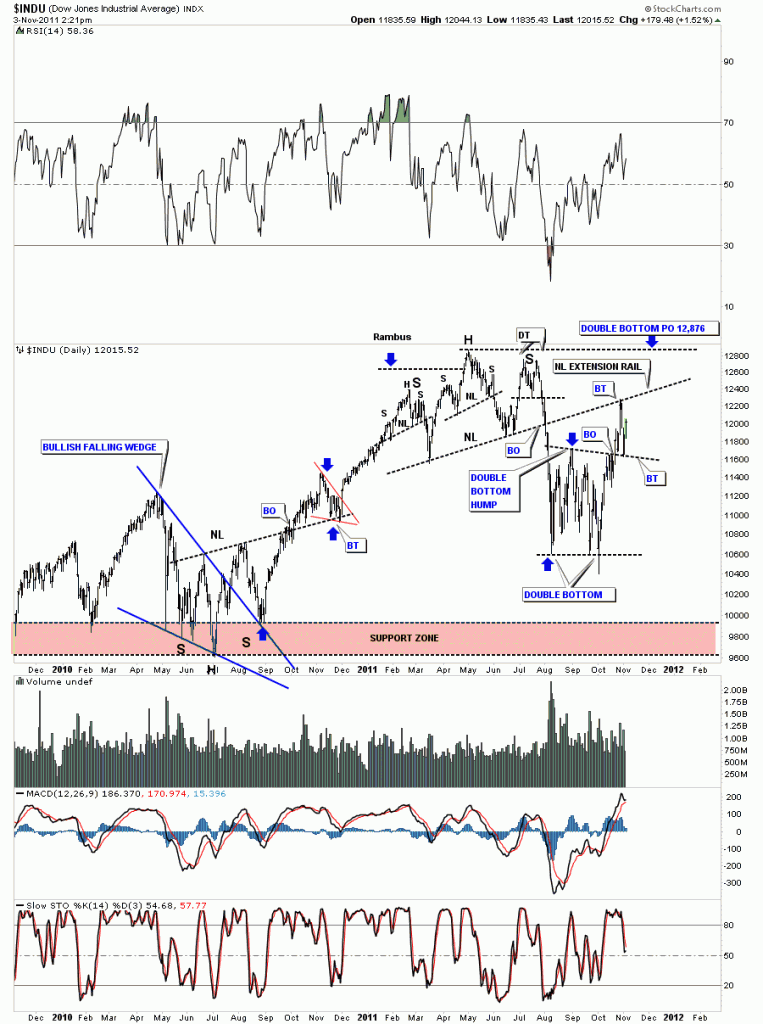
Tuesday of this week, when everything was down hard, stock markets and precious metals stocks, I showed the daily chart for the Dow Jones and where I thought the backtest would most likely take place. You can see on the chart below the Dow did come all the way back down to it’s breakout point at around the 11,600 area. So we can now give more credence to the double bottom being valid. That black dashed rail that marks the double bottom hump and the breakout point is now your line in the sand. Above the rail positive below negative. Note where our latest backtest started from, the most obvious place on the chart, the old neckline from the H&S top. You can see why support and resistance shows up at certain spots on a chart. So now we bounce between the big neckline and the top of the double bottom hump until one side wins out. An old stock market adage: The markets like to “climb a wall of worry”. If there isn’t enough to worry about with all the bad news you hear and read and see on TV, I think we have a substantial wall to climb and so far its doing a good job. The Dow has gained almost 2000 points in about a month and everyone is still debating when the end of the world is going to be.
Dow Jones daily breakout and backtest.

