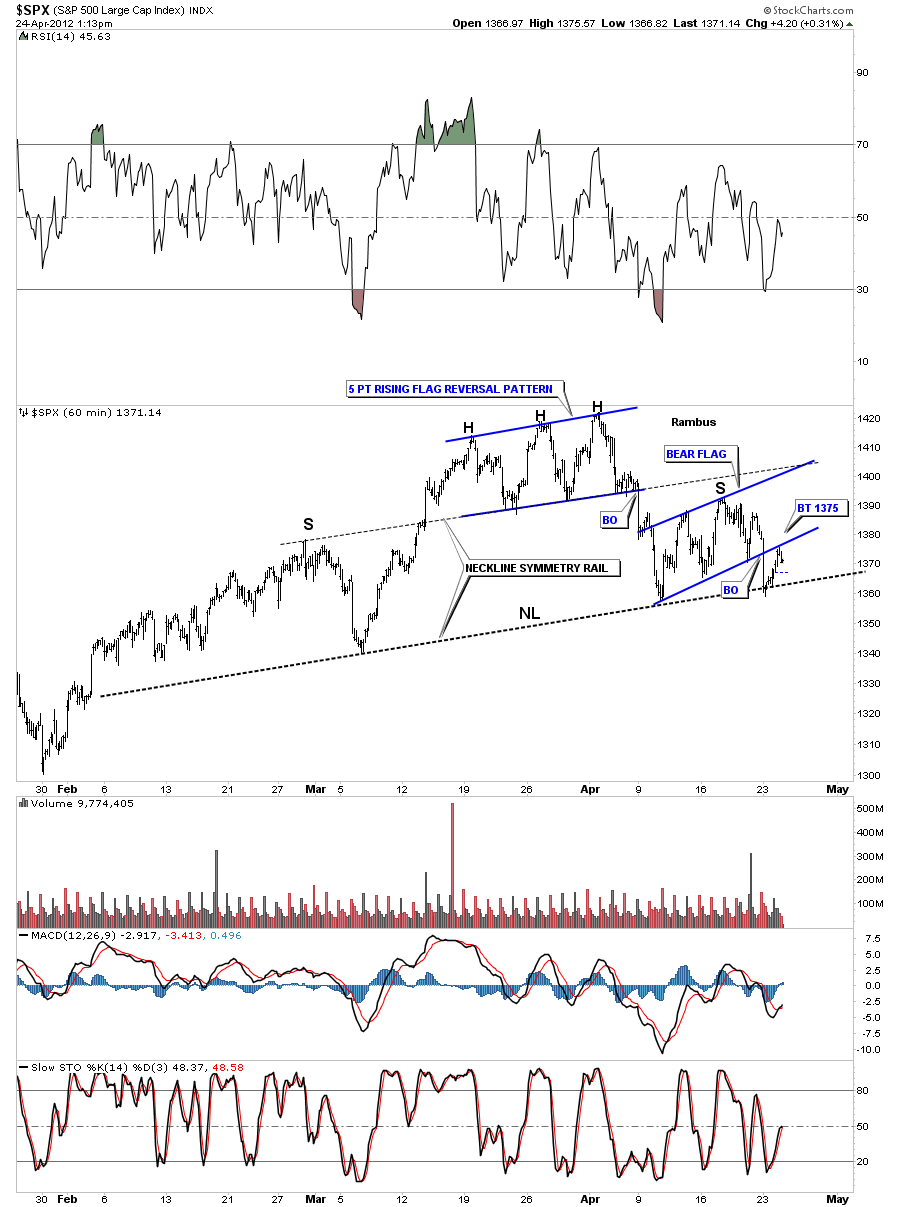
The SPX is a good proxy for the rest of the stock markets for the most part. How the 500 biggest cap stocks are doing should filter down through the food chain. So if the S&P 500 is topping or bottoming it stands to reason that the other stock market indexes will look some what similar. I’ve been watching the SPX very closely for the reasons mentioned above for signs of a top. Lets start with the 60 minute look that shows in detail the formation of a H&S top pattern. The biggest clue that a top maybe forming was the 5 point rising flag that broke through the bottom rail last week. Remember an odd number of reversal points creates a reversal pattern, and in this case the bottom rail was broken. If the SPX had broken out to the topside the pattern would have been a consolidation with four reversal points which is a totally different story. The first thing you need to see when creating a H&S is a hard break off the head area that takes prices below the top of the left shoulder. When that happens it is showing weakness as the top of the left shoulder should have acted as support. Once I see a hard break like that I will then look for a counter trend rally. Once we get a counter trend rally you can then connect the bottoms of both shoulders that creates the neckline. Once you have a possible neckline I like to draw a neckline symmetry rail that is parallel to the neckline. What this does is gives me a rough idea of where the top of the right shoulder may form. This is just a rule of thumb as many times the right shoulder can be much higher or lower than the neckline symmetry rail may suggest. Once I’m able to draw in the neckline I like to watch the price action and see what develops as a possible right shoulder. Many times the right and left shoulders will consists of a four point consolidation pattern. As you can see on this 60 minute chart of the SPX the right shoulder has four reversal points and looks like a bear flag. We are in the process of backtesting the bottom blue rail of the bear flag as we speak.
Now lets look at the daily chart and see how this possible H&S top pattern fits into the bigger picture. Remember a H&S pattern generally shows up as a trend reversal pattern coming in at tops and bottoms. They can also be a consolidation pattern which is much more rare. Note the H&S consolidation pattern that formed late last year that worked out very well. Alot of times when you have a rising wedge the top part of the wedge may encompass part of the H&S top. In the chart below you can see the rising wedge takes in the left shoulder and the head with the right shoulder as failed backtest. Our current possible H&S top is not a big one as seen in some other charts but the function of the H&S top is to reverse the trend. Sometimes a small H&S pattern will show up at a major top that reverses the uptrend for many months. The important thing to know is that it is reversing the trend and until some type of reversal pattern is built the trend will remain in place with consolidation patterns that show up along the way. So watch the neckline very close as a break will signal the completion of the pattern.


