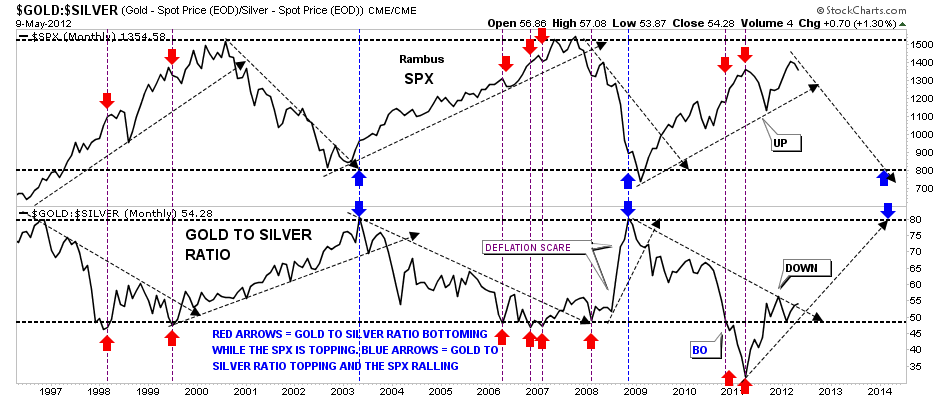
This week Sir rlscott63 is interested in the gold to silver ratio and how it plays into the movement of the stock markets.
First, we’ll start with the gold to silver ratio that can tell a very important story if one interprets the information correctly. The general theme of this ratio is when gold is outperforming silver the stock markets are generally declining and the ratio is rising. Just the opposite happens when the ratio is falling meaning silver is out preforming gold and the ratio trends downward. What it means when the ratio is falling is that silver is outperforming gold signaling to the stock markets that its time to rally as silver is still used as an industrial metal and the demand from a robust economy is putting a higher demand on the white metal vs when the economy is weak. This is why you see the ratio falling during rising stock markets. I built a chart four or five years ago that shows a very clear picture of how the ratio rises while the stock markets fall and falls when the markets rises. The chart below is a combo chart with the SPX on top and the gold to silver ratio on the bottom. You can see the general principal, I described above, at work on the chart. Notice when the ratio is falling the stock market is rallying and when the ratio is rising the stock markets are falling. Note the 2011 period when the gold to silver ratio plunged below the horizontal support rail at 49 or so. That’s when silver was in it’s near parabolic rise to 50 and was kicking golds butt all over the place. You can see the stock market was rallying hard and was at it’s high while the gold to silver ratio was extremely low at 34 not seen in a very long time. From that extremely low reading of 34 the ratio started to rise and the stock markets had their summer correction finally bottoming out in the fall. Note the steep rally in the gold to silver ratio during the stock market crash in 2008 labeled deflation scare. Even though gold fall hard silver fell much faster as investors were seeking the safety of gold over silver. Gold has been outperforming silver since the low in the stock market last fall and the raito has broken back above the horizontal rail at 49. This is a bit of a divergence as both the stock market and the ratio have been rising together just a tad. So its very interesting right now as the ratio is just about to break above it’s little downtrend rail that will signal a weaker stock market and once we see the SPX break below it’s uptrend rail that should signal the stock markets going back into it’s secular bear market. I’ll be watching this chart very carefully for more clues for a declining stock market and an out performance of gold over silver.

