We have several new subscribers that I would like to thank for joining our website and bring up to speed on some of the big H&S top patterns. I want to show some of the big H&S top patterns that are in different stages of completion. Some are still forming their right shoulders while several more have broken their necklines since the last time I posted them. Its really important to grasp what these big topping pattens are telling us. This correction, for the most part, is still in the early stages in time and price, I will keep it simple and let the charts speak for themselves with limited description.
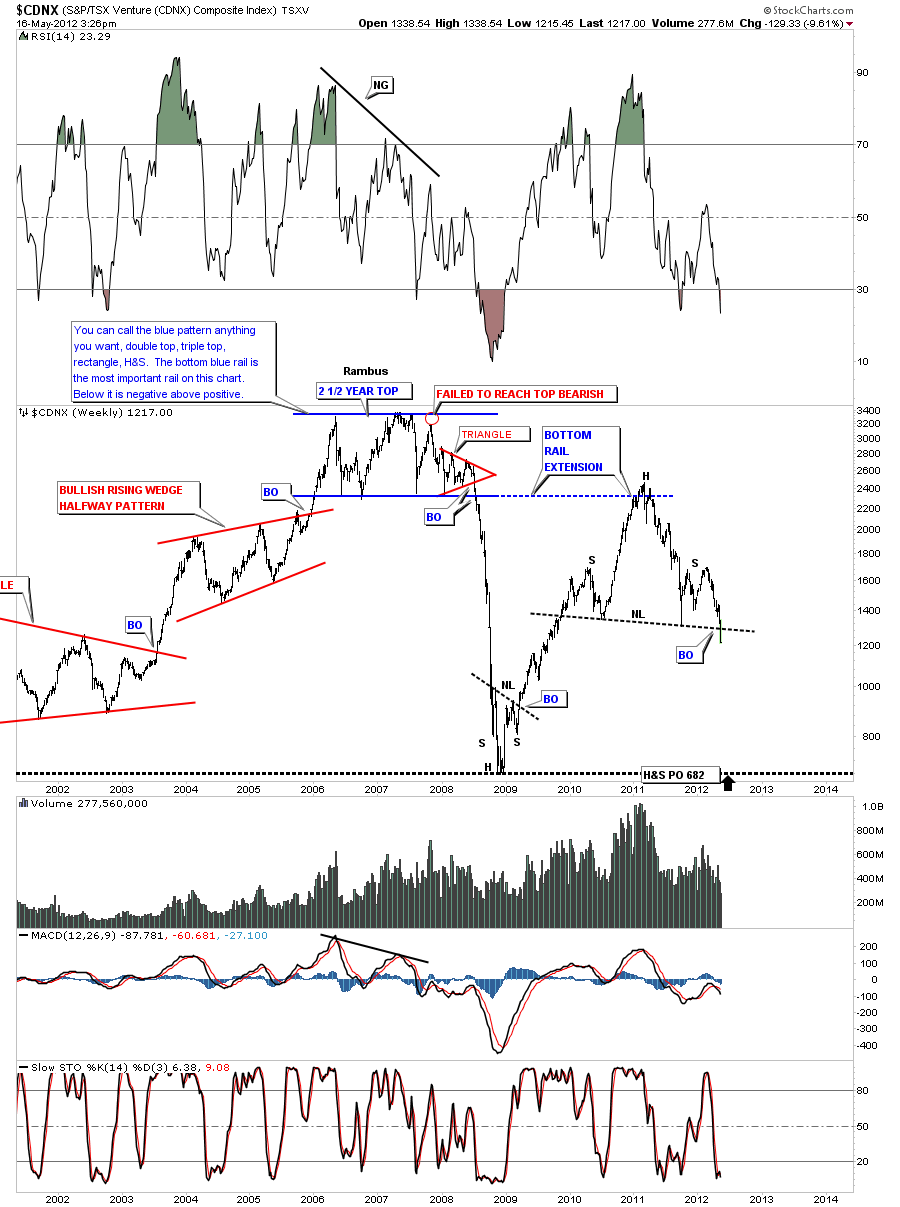
CDNX has now clearly broken the neckline of a big H&S top pattern. PO down to the 2008 crash lows at 682.
COPPER is still working on it’s right shoulder of a very big H&S top pattern.
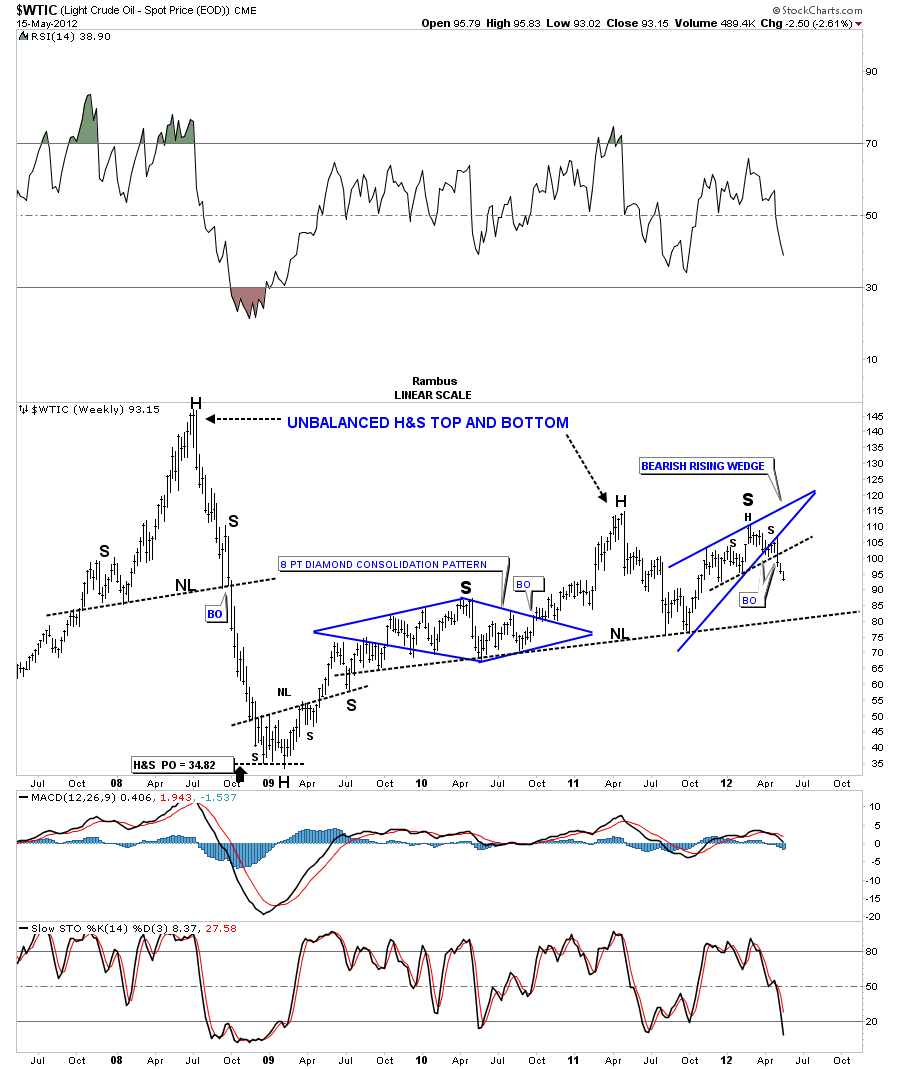
OIL has just broken down from a bearish rising wedge that maybe the right shoulder of a big H&S top.
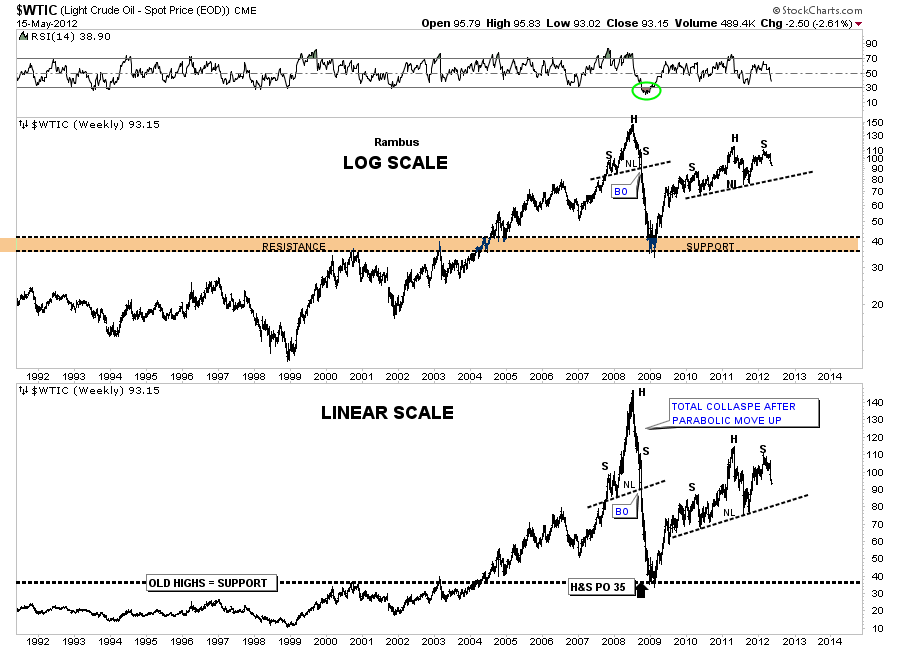
Below is a combo chart for oil in log scale and linear scale that takes in the parabolic move and the crash that followed.
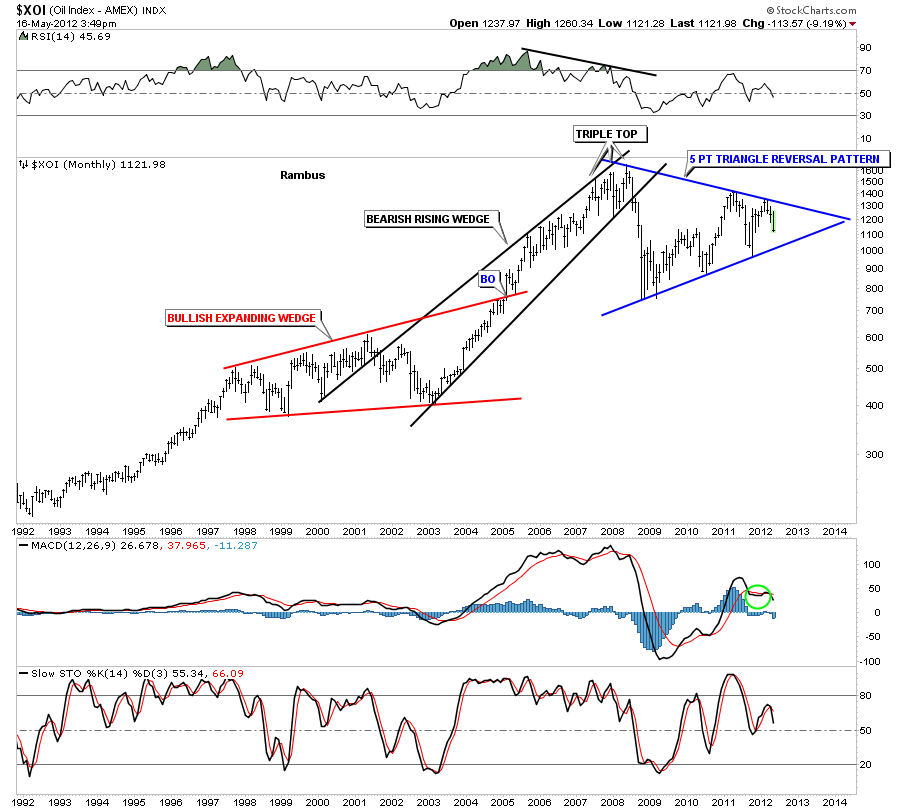
The XOI oil index is working on a 5 point triangle reversal pattern. A break below the bottom rail will confirm the top is in.
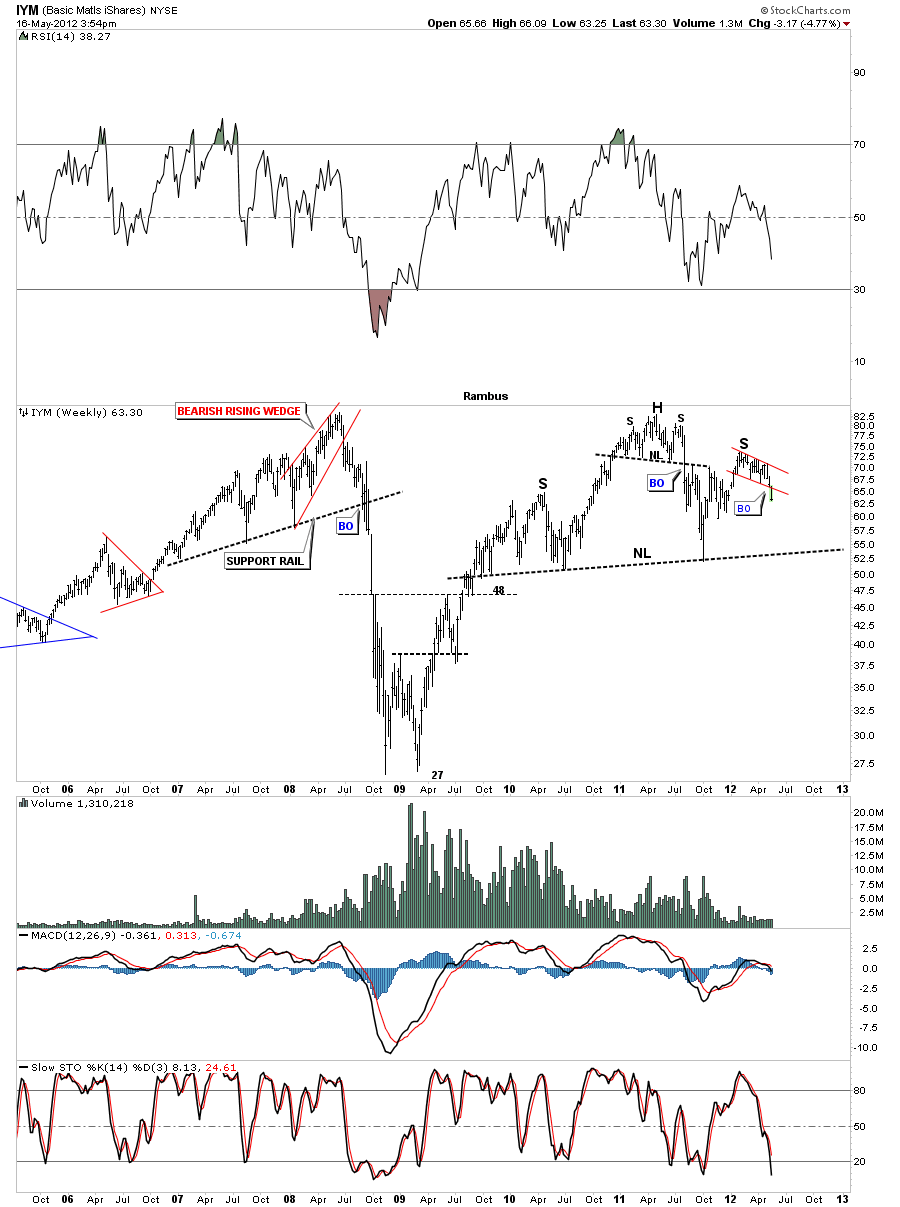
The weekly chart for IYM shows a big H&S top. This week we are breaking below the red 5 point falling flag that is creating the right shoulder. This chart shows why I recommended the inverse etf, SMN as a buy today.
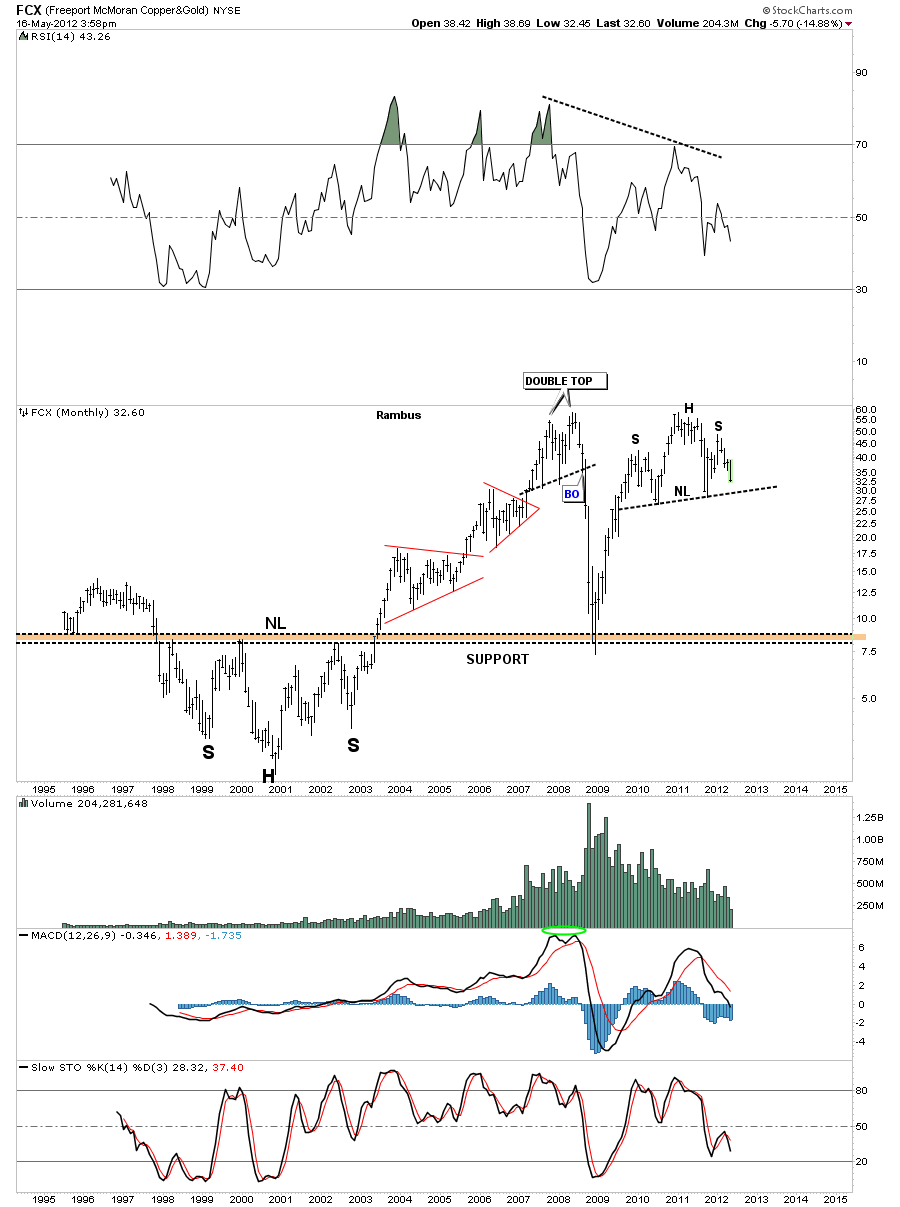
If the basic materials etf’s are showing weakness in here then that should also show up in the miners. FCX is moving closer to it’s neckline but not quite there yet. If that big monthly H&S plays out there is a long ways to go to the downside yet.
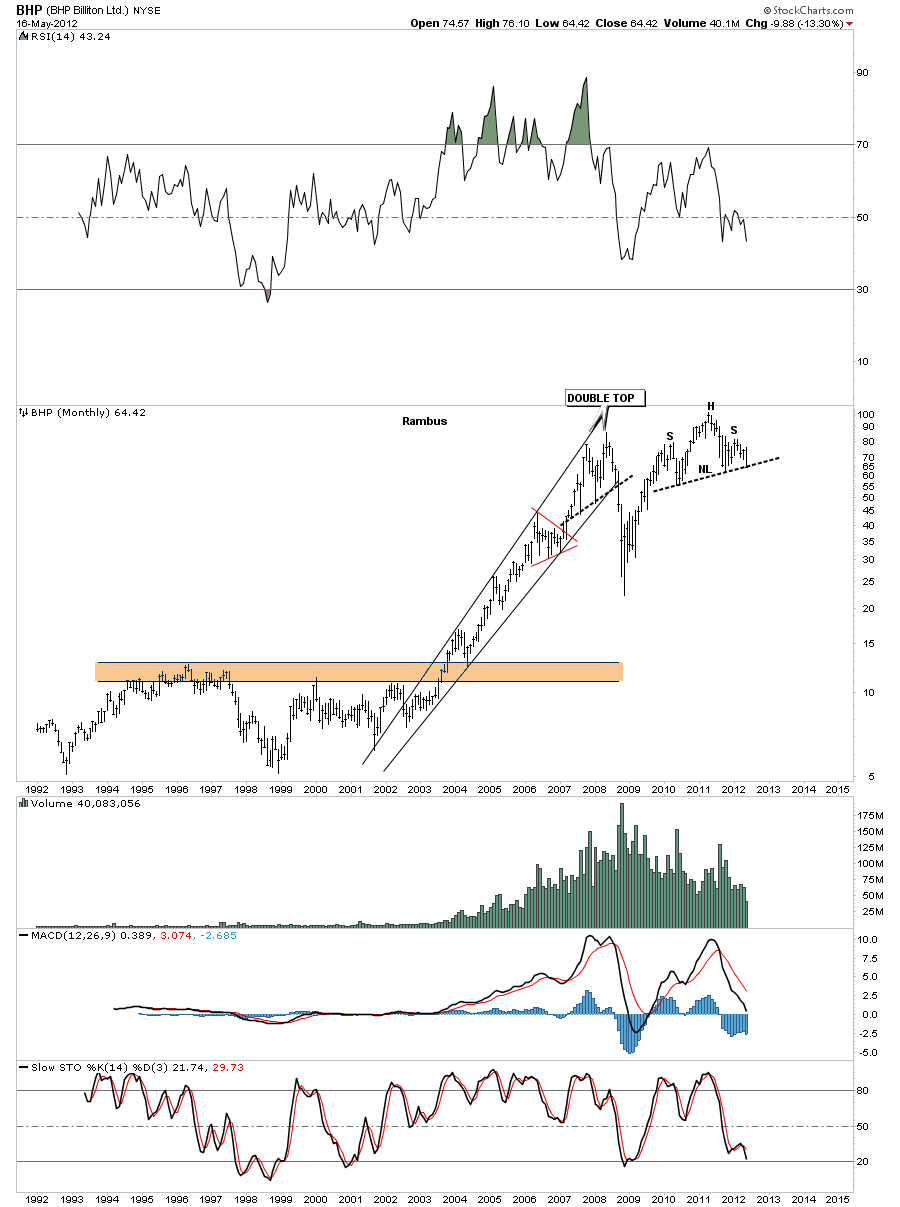
BHP is a big miner that is just slightly ahead of FCX as its testing the neckline right now. Watch for a break of the neckline to get the ball rolling to the downside.
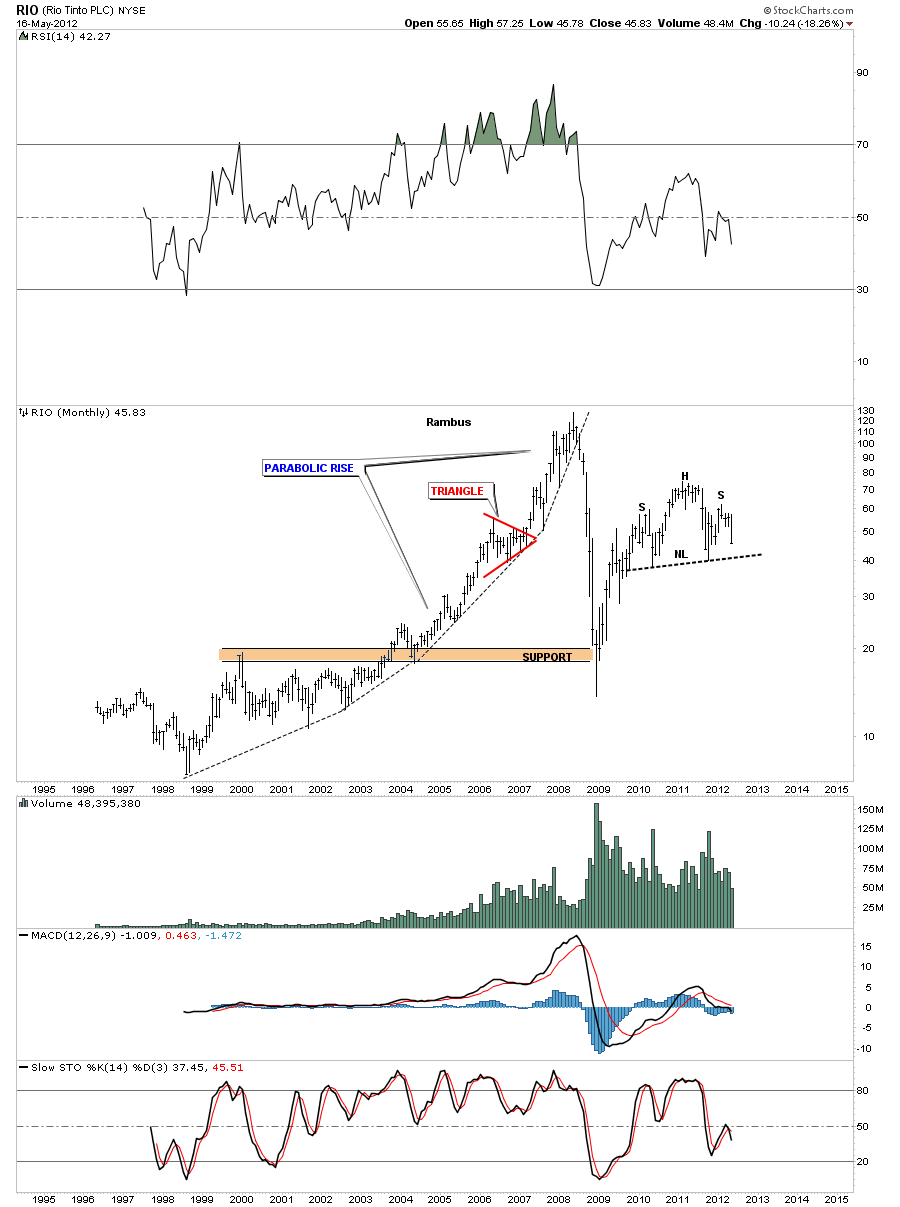
RIO is another big miner that is working on it’s right shoulder. I hope you are starting to see a pattern developing.
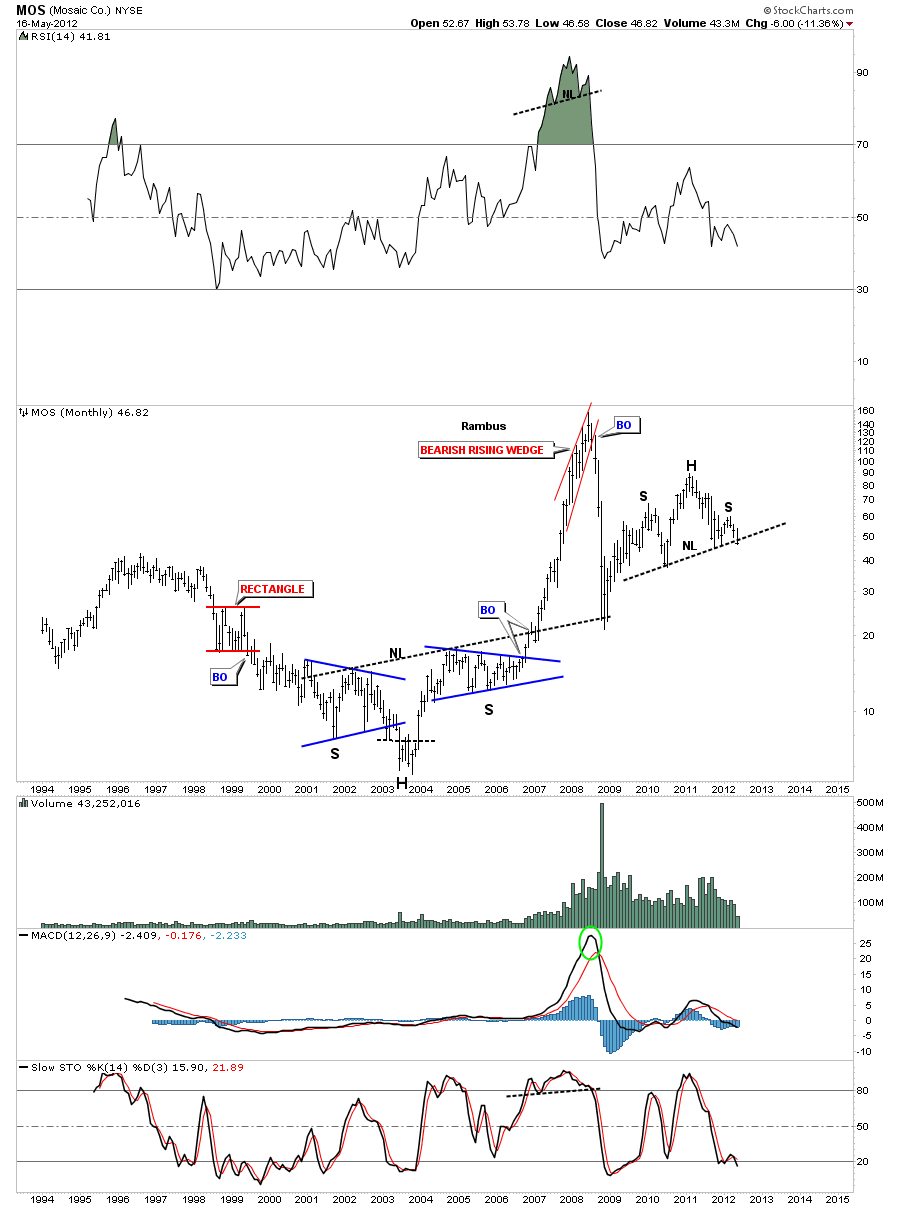
MOS is a basic materials stock that is now cracking the neckline of it’s H&S top pattern.
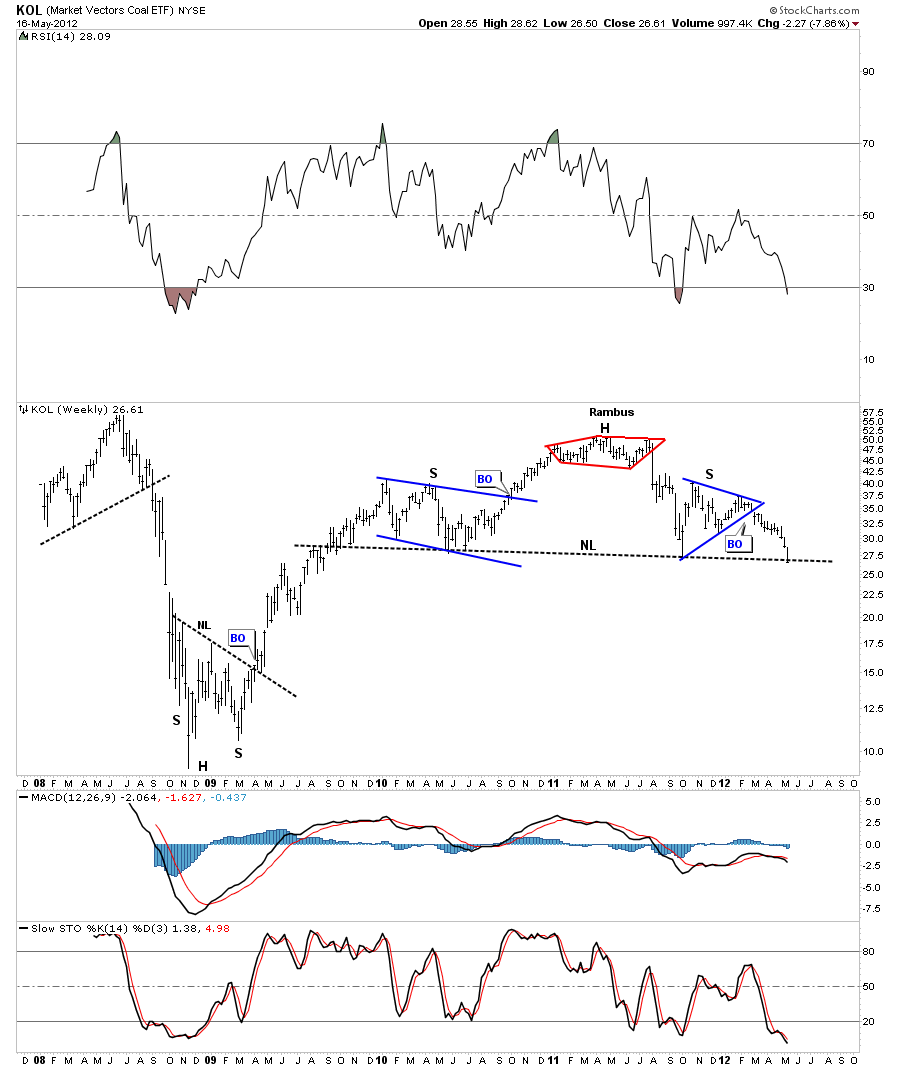
KOL is a coal etf that is trading right on its big neckline. A weak coal price tells me the world economy is in slowdown phase.
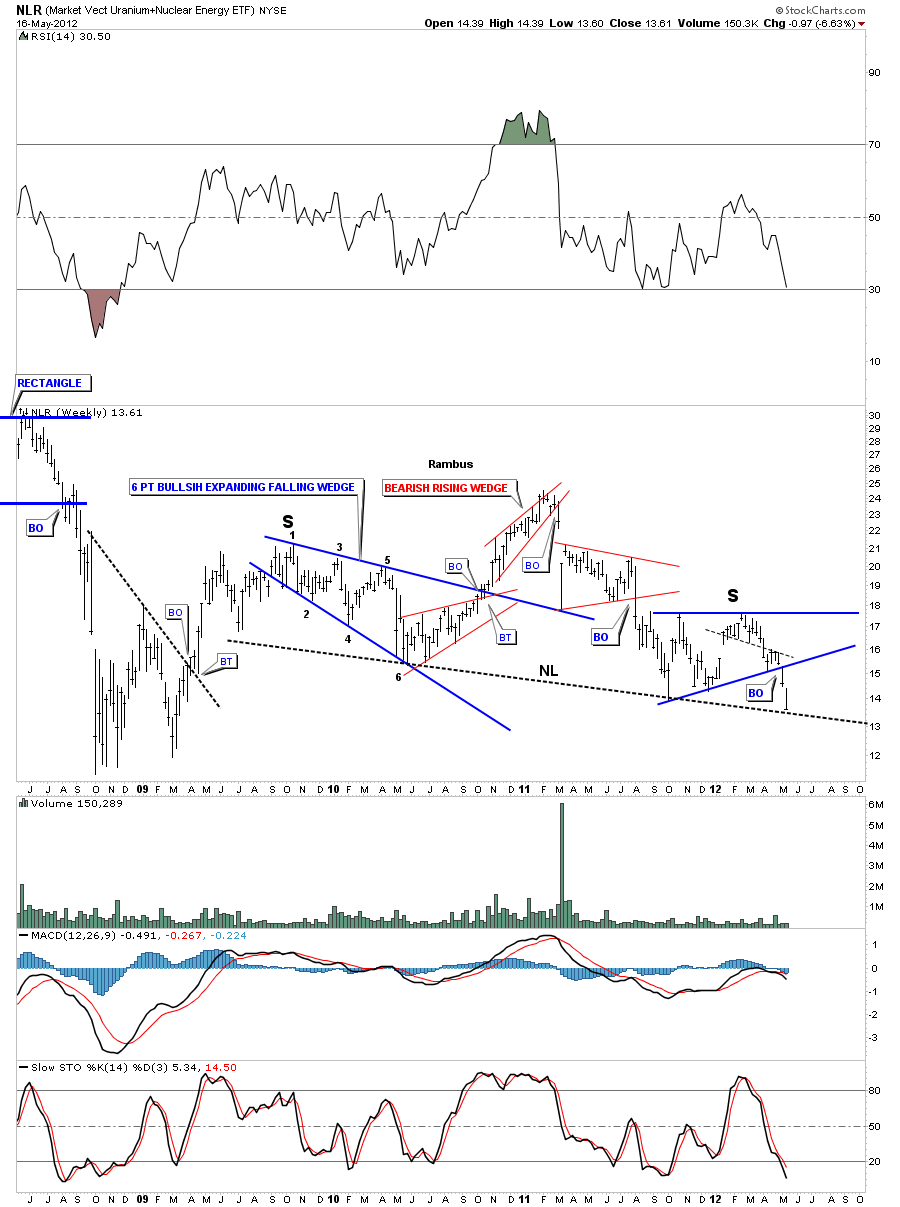
NLR is a Uranium etf that is testing it’s big H&S neckline. This chart is alittle busy but you can see the neckline and both shoulders.
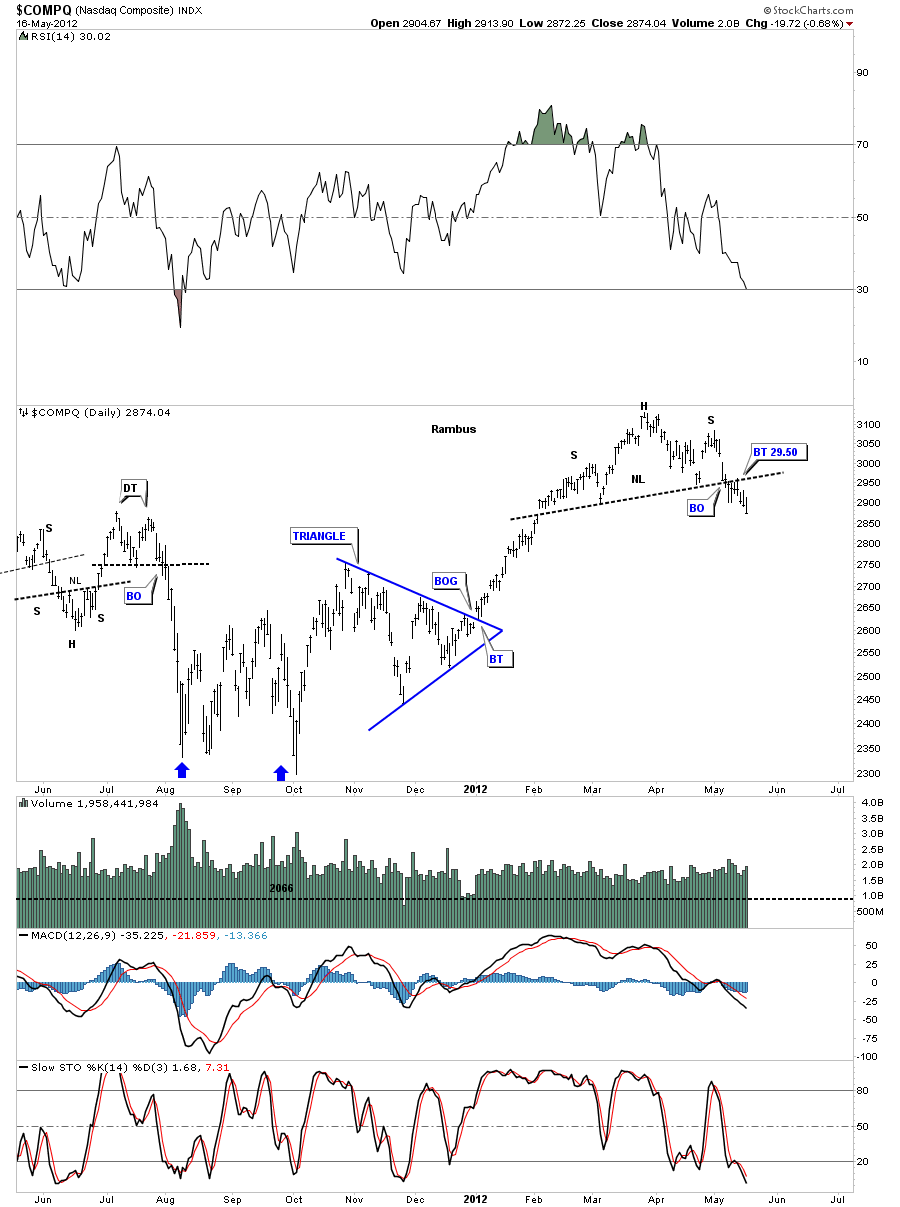
Lets now look at some stock market that are showing H&S top patterns. COMPQ had a nice breakout and backtest and is now in the impulse leg down.
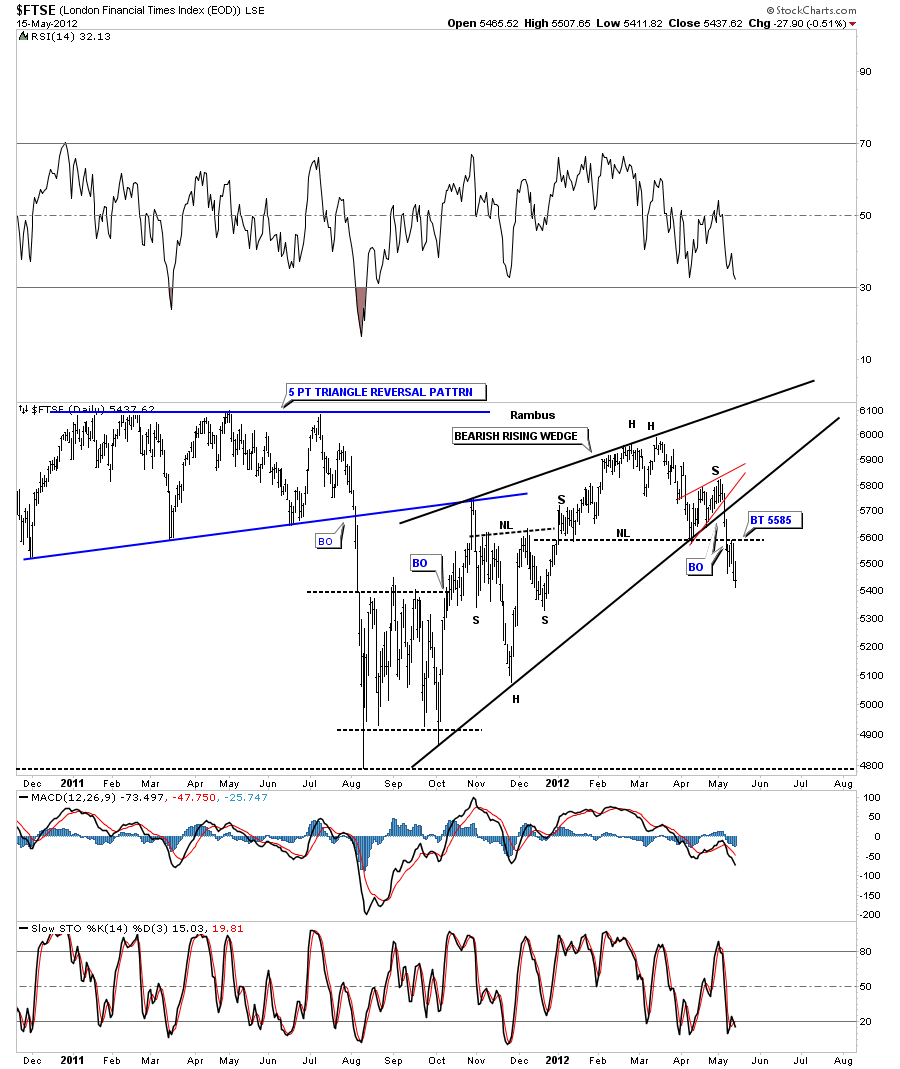
FTSE has broken out from its H&S top with a nice clean backtest.
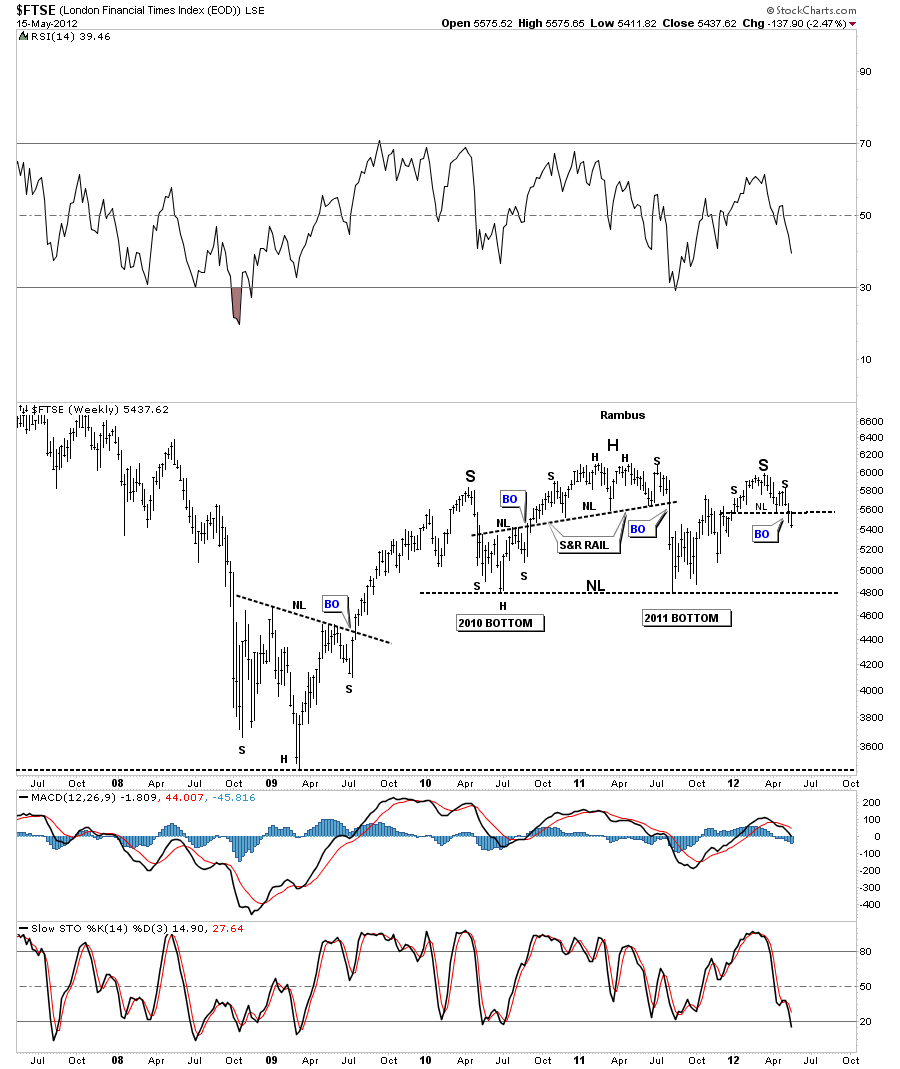
I want to show you another chart of the FTSE that is showing a much bigger H&S top forming. The daily chart above is just the right shoulder of the much bigger H&S top on the chart below.
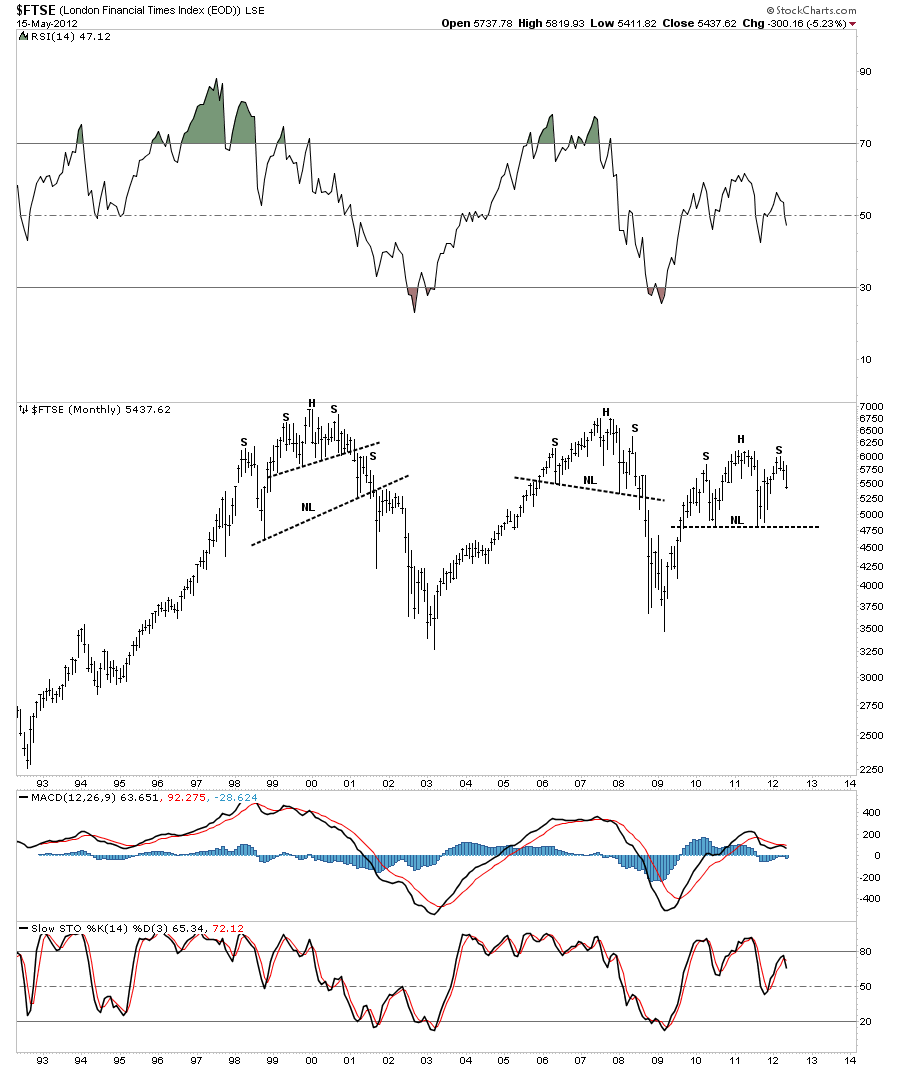
Lets look at the monthly chart of the FTSE as it shows why H&S patterns are so important to recognize. Do you see any similarities to the previous topping patterns?
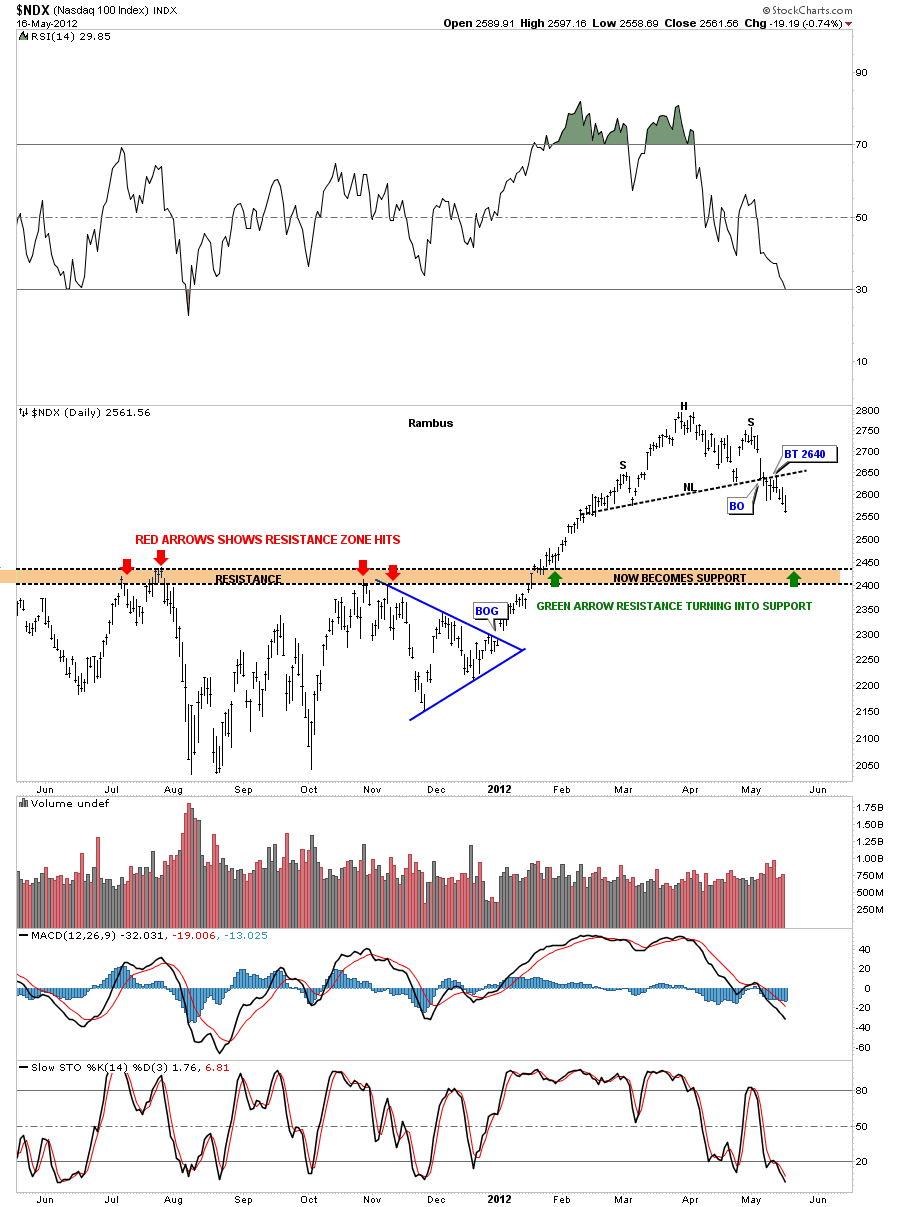
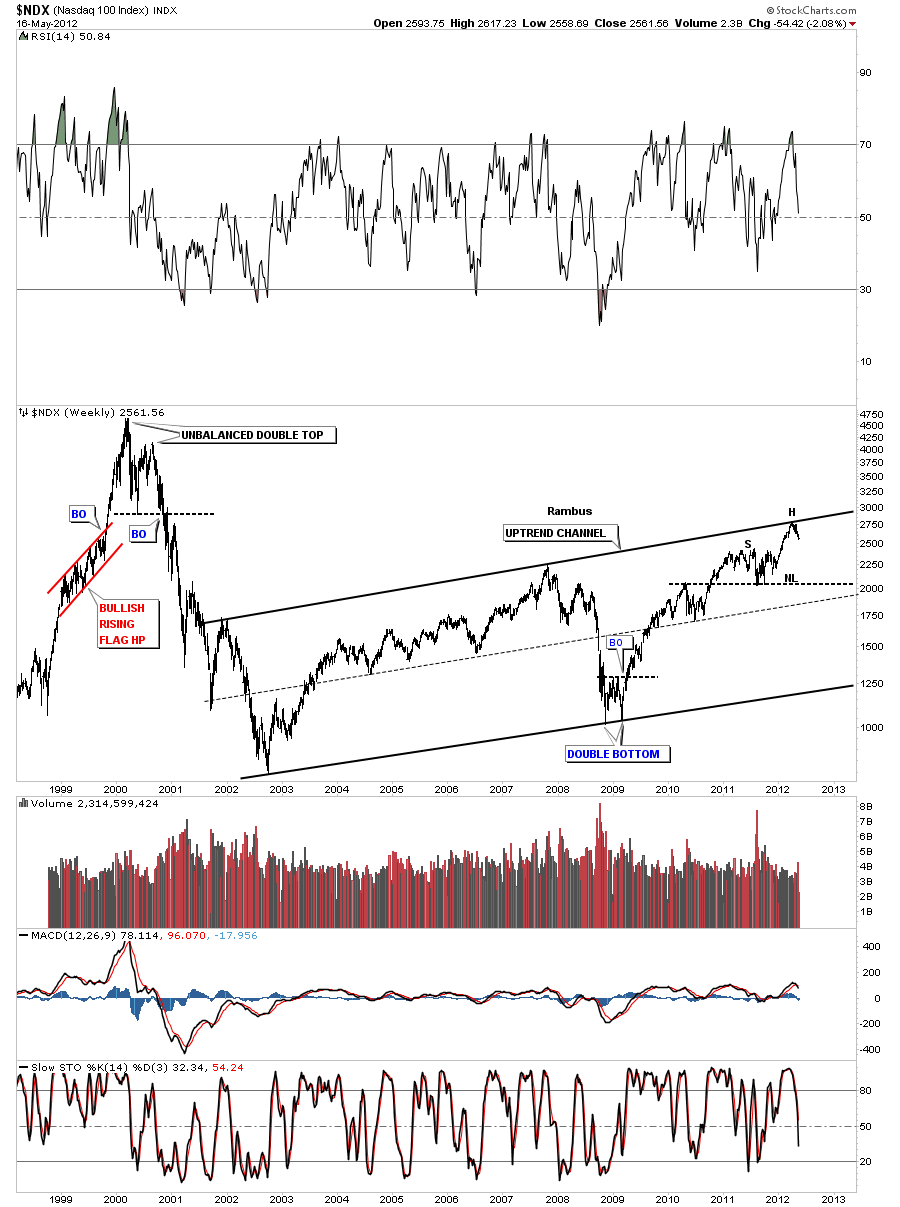
The NDX 100 is made up of the 100 biggest tech stocks. Stocks like Apple, Priceline and GOOG to name just a few.
The weekly look shows why the H&S top is forming where it is. You can see NDX is trading right up at the top rail of the big uptrend channel so a good place to look for a reversal pattern.
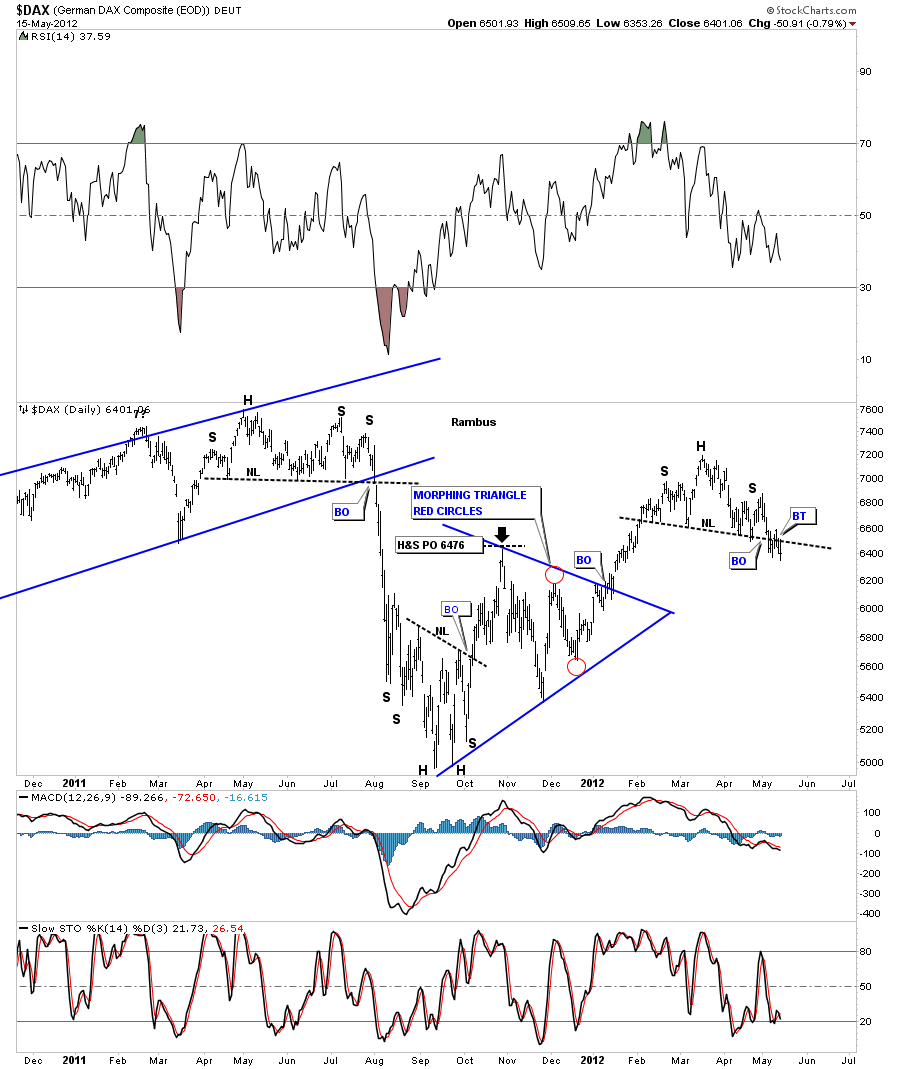
DAX is the German stock market and one of the stronger economies in Europe. As it has already broken it’s neckline and had a backtest this index is ready to start it’s next leg lower.
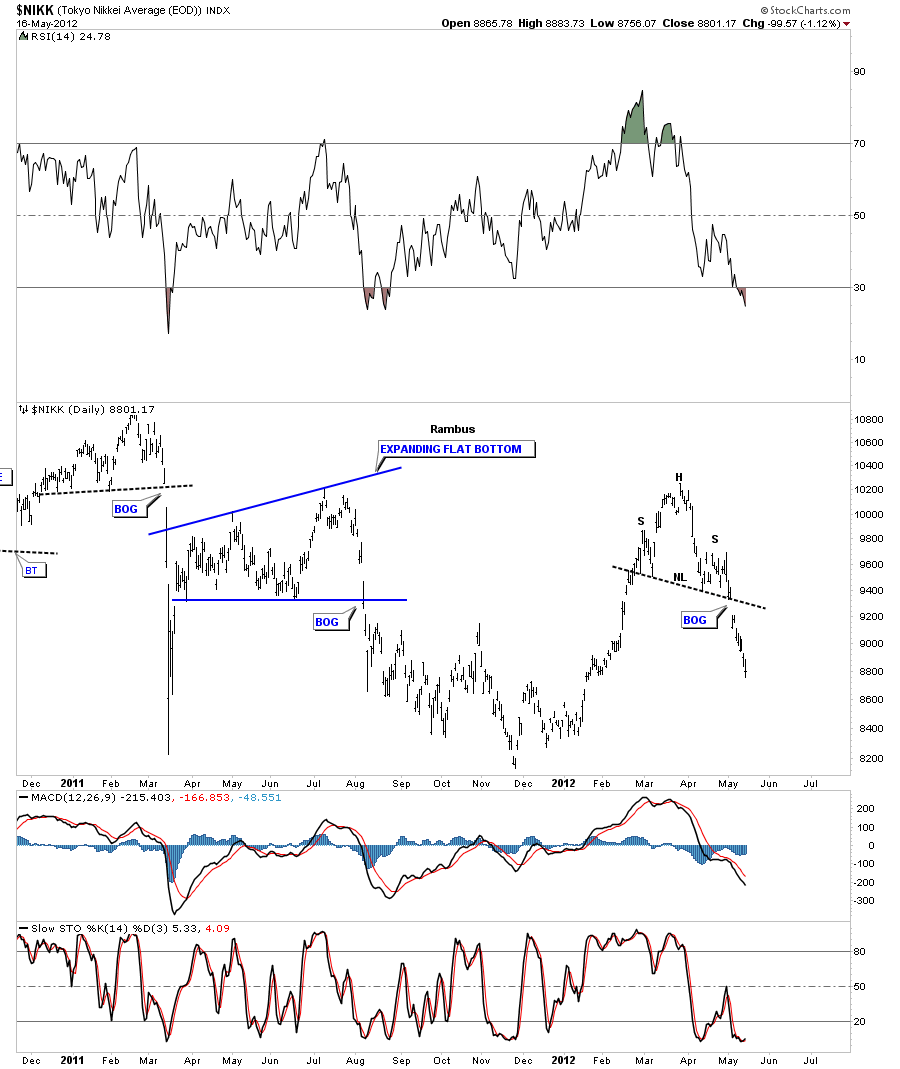
The Japanese stock market, the NIKK, had a big breakout gap when it left it’s H&S pattern. Notice how its reversing symmetry down. How it went up into the H&S top is how it is coming down.
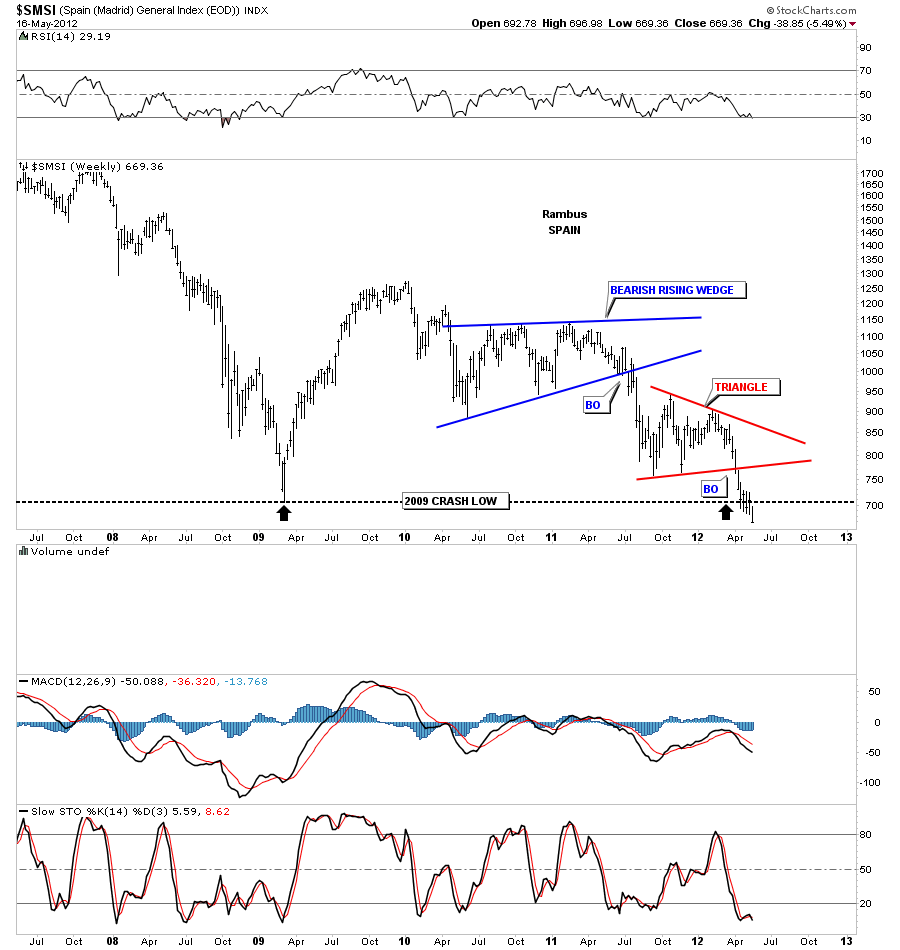
Now to a couple of weaker stock markets. The SMSI is one of the weaker European stock markets as it is now taking out the 2008 crash lows.
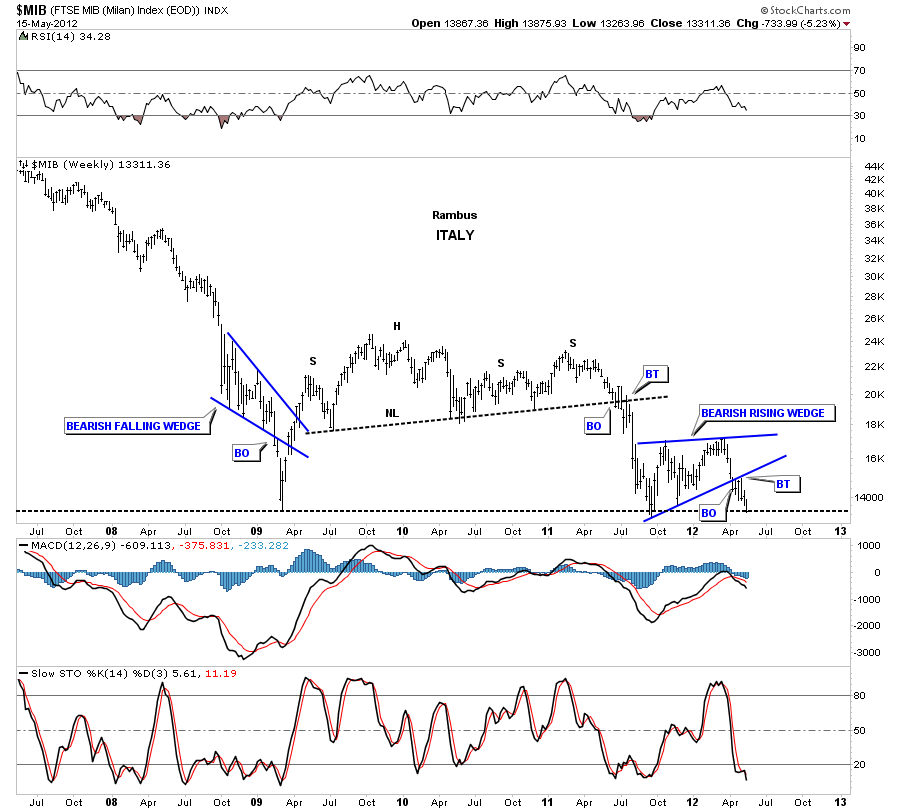
The MIB, Italian stock market, isn’t far behind the Spanish stock markets as it to is testing the 2008 lows.
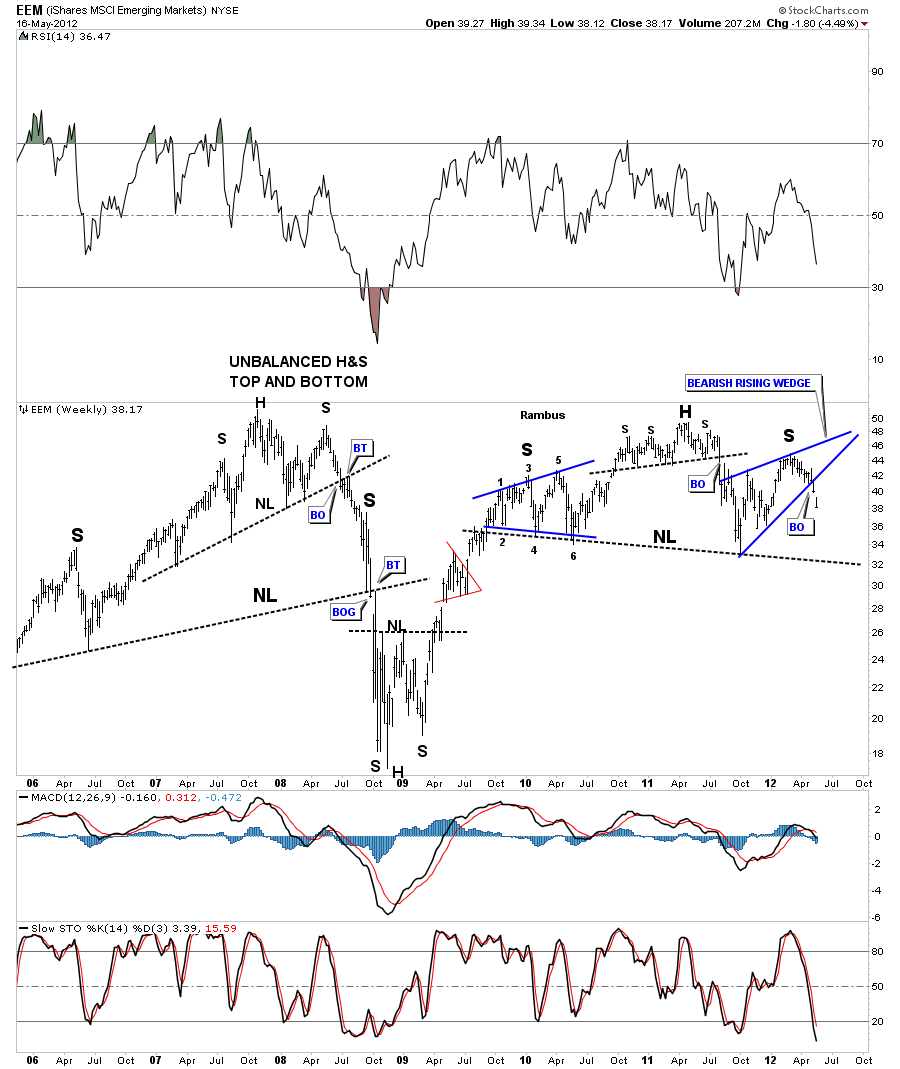
The EEM has broken out of a bearish rising wedge this week that looks like it will be part of the bigger H&S top pattern.
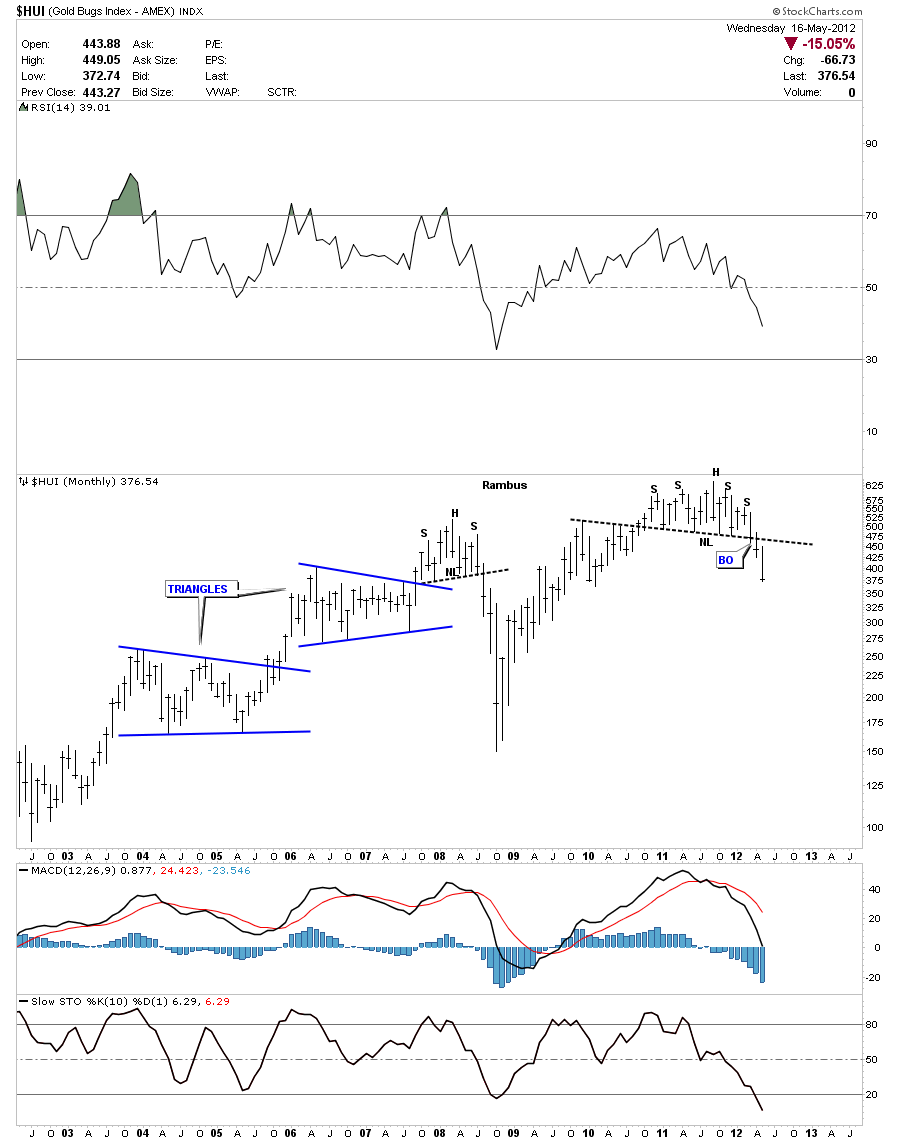
Lets now take a look at some of the precious metals stock indexes as they seem to be leading the charge lower. You can see they have all had big runs lower already. Notice how the monthly look at the HUI has already broken well below it’s big neckline compared to all the charts shown above.
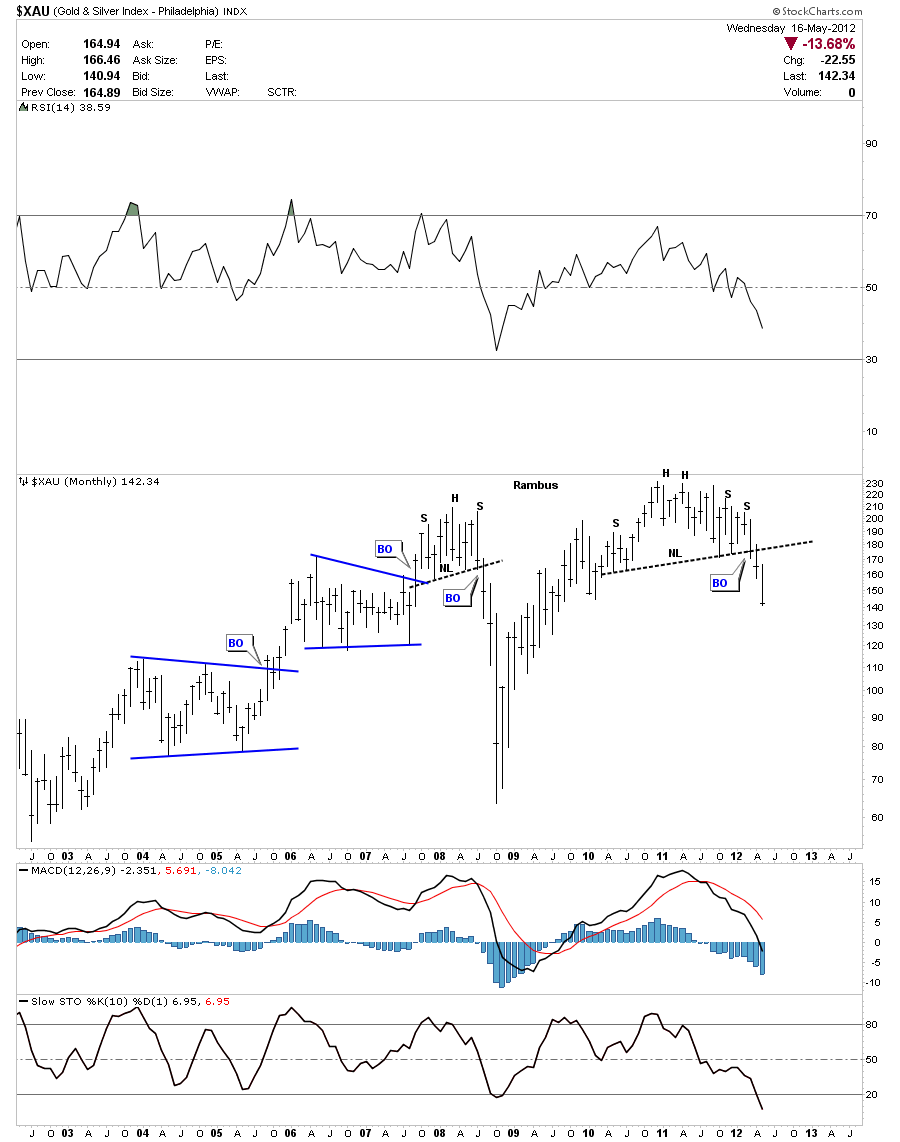
The XAU monthly look.
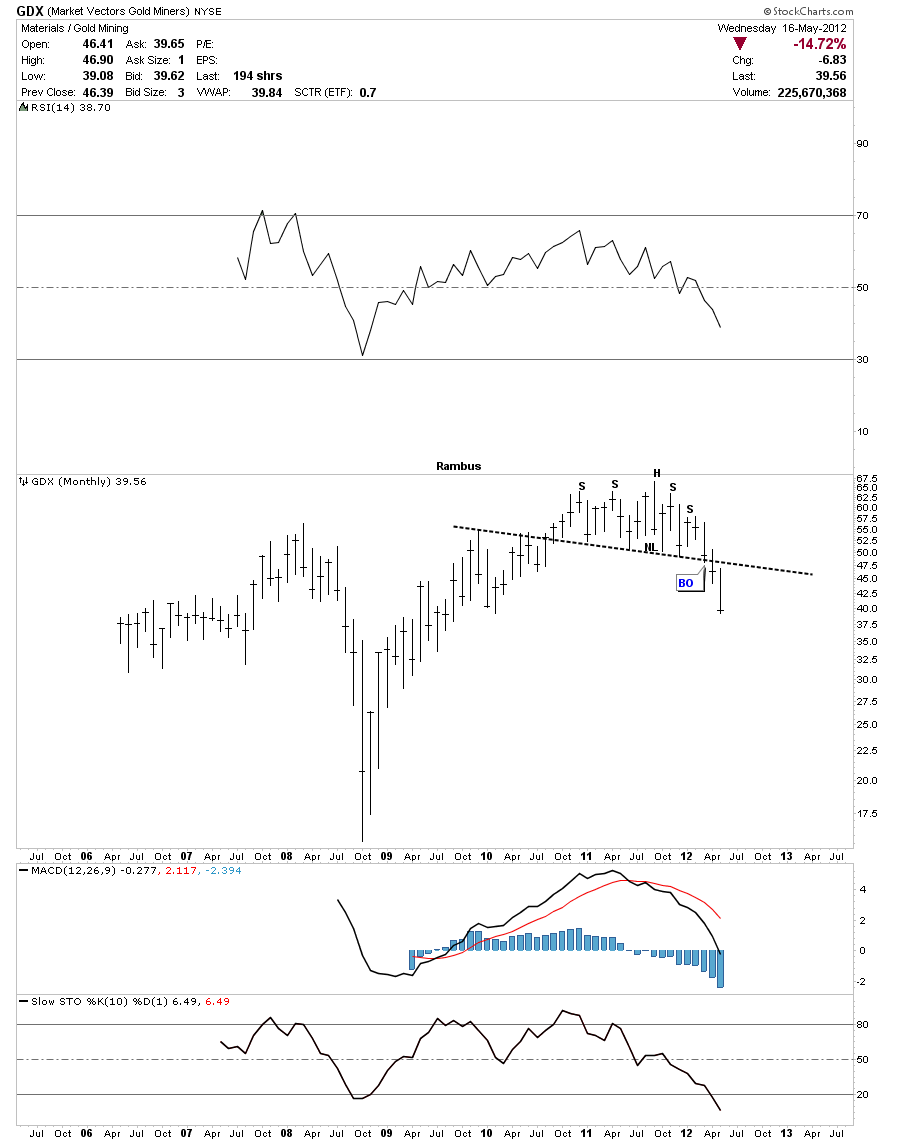
GDX monthly look.
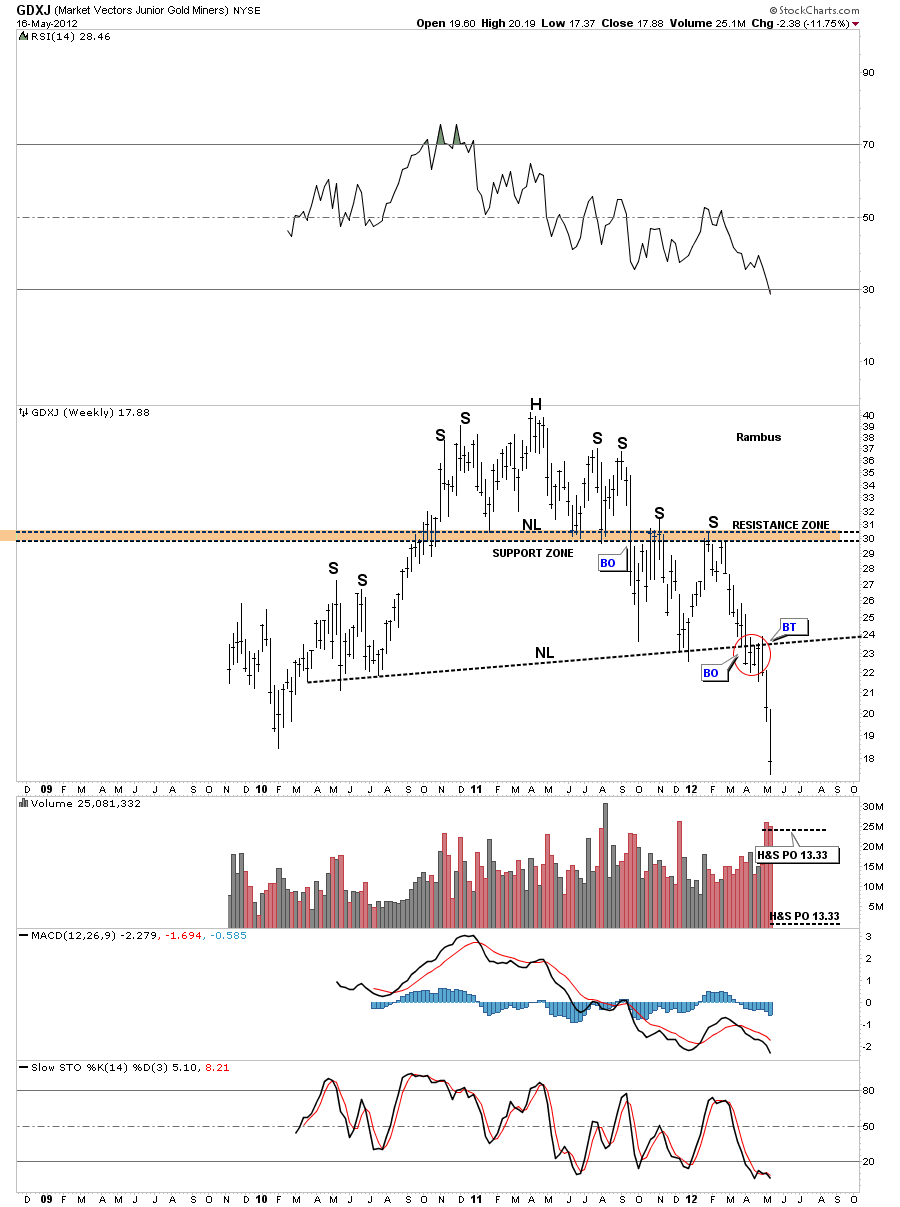
This weekly chart of the GDXJ shows the little juniors on the move to lower prices. I said at the time, when we broke the neckline, that this chart concerned me the most because most PM investors are heavily invested into the junior PM stocks. The selling has been relentless making it almost impossible to sell into any strength as there hasn’t been any to sell into.
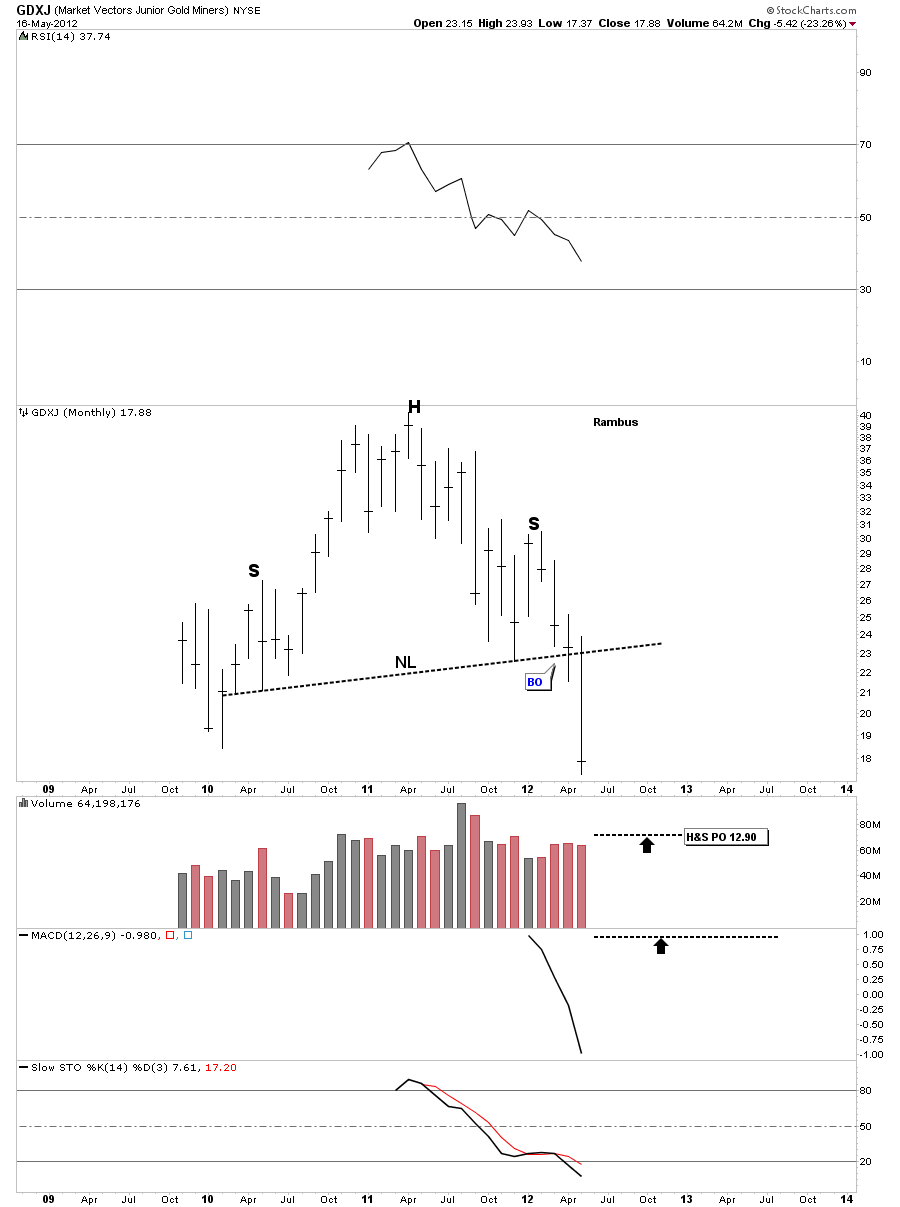
GDXJ monthly look.
These charts should get everyone up to speed now on what I’m seeing going forward. We are still very early yet in this move lower across the board. It looks like everything is going to be affected to some degree.
There is only one way that I want to play this new developing trend and that is to sit tight and ride out any counter trend rallies or short covering rallies that will come our way. I’ve learned along time ago the real big money is made when you can identify a big trend, either up or down, and ride it for all your worth. It will be the hardest thing you will ever do in the markets. Be right and sit tight is easier said than done. When we get a short covering rally you will think the bull is back but the bull won’t be back until all those big H&S top patterns play out to the downside. So I suggest getting your portfolio together using the different trade setups on the sidebar that suits your investment style. All the best…Rambus

