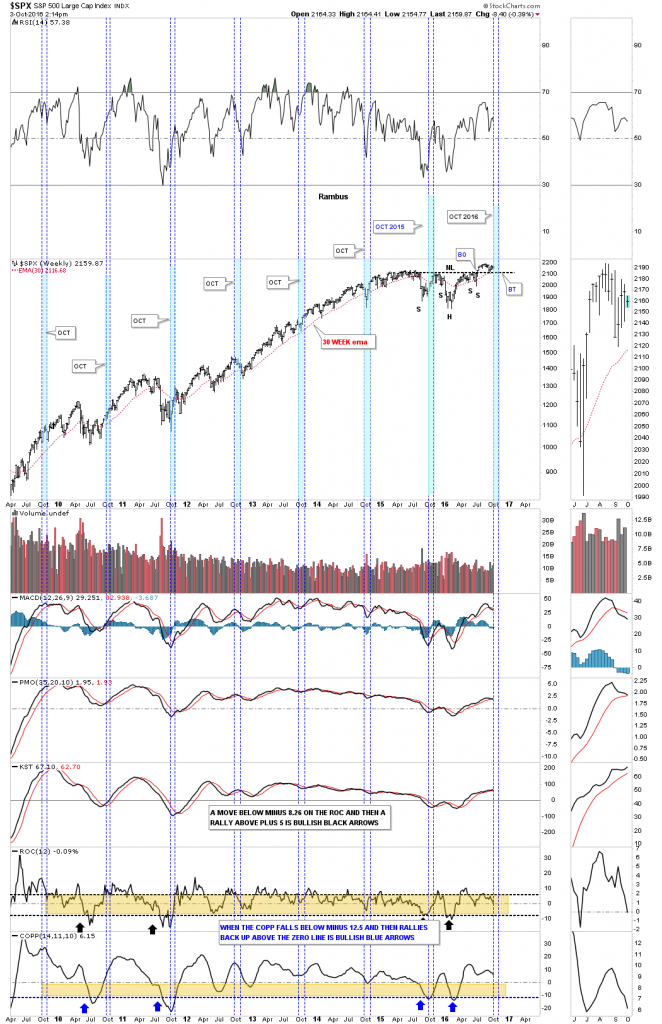
The stock markets have finally arrived at the dreaded month of October when investors begin to look for the markets to crash and burn. Some of the biggest crashes on record have occurred in October so it’s understandable why investors fear this month. For the most part though, October can mark an important low after weakness leading into this fearful month.
Below is a seven year weekly chart for the SPX in which I’ve highlighted the month of October to see if all the fear is warranted. What this chart shows it that if one bought the SPX sometime during the month of October they would have been profitable one year later. Even last year when the SPX showed some weakness during the month of October, which formed the head of the H&S consolidation pattern, one would still be ahead of the game as of today. As you can see we have the neckline and the 30 week ema offering support for this month of October. This is just the first day of trading for October so we’ll have to see how this chart looks at the end of the month.

