
This report continues the work from two weeks ago on the PBC which is now in its early stages. It is the single model which presently explains the actions of all of the world’s markets. By understanding the PBC we can best asses how to deploy our assets going forward.
I wish to reiterate the superb job Rambus has done in chronicling the decline in the precious metals sector. His charts and analysis of this sector put him way out in front of anyone else in the world. A few chartists and analysts have called for lower prices, but no one else has had a lock on the action which we have witnessed on a day to day basis here at this site. In these reports I attempt to reveal the meaning of these historic moves and explain why its happening. Knowing this we stand a decent chance to position ourselves for what is coming.
Let’s establish some of the tenants to the Post Bubble Contraction:
- A PBC comes at the end of a secular 50-70 year credit cycle expansion
- There have been 5 completed PBC’s since the beginning of the era of modern finance starting in the 1680’s in London.
- Our current cycle began in the late 1940’s
- A cycle begins from low debt levels and ends when the total of public and private debts are so large they become unsustainable by existing cash flows.
- The PBC resets the cycle by ridding balance sheets of debt through outright bankruptcy, restructuring or repayment. In the past this process normally takes 15-20 years and is very tumultuous.
- Once the process is complete debt levels are reduced and rapid growth renews itself. (Think rapid growth rates of the 1950’s)
- As the contraction begins stress is first felt at the periphery of the world’s economy
- Money seeks safety and flows towards the senior currency in the financial center.
- Since emerging market debt is mainly denominated in the senior currency (USD) it becomes more difficult to service as local currencies decline causing an EM collapse.
- A liquidity event then gets triggered as debts fail.
- First casualties are liquidity assets which provide a source of funds to pay debts…Gold being the ultimate liquidity asset often succumbs and declines initially.
- As financial stress gets transmitted to the core, senior equity and bond markets finally succumb and enter bear markets.
- Stalling economies undercut demand for commodities and prices collapse.
- The REAL price of gold begins to rise while simultaneously the input costs of gold mining declines. This flows through to improved balance sheets for the gold miners and gold stocks enter a bull market.
This is the process which is before us and has now begun.
What the past 10 years were all about
The PBC process actually began in 2008 as the natural end to the inflation cycle. A bank triggered debt bust ushered in the debt purging process to reset the cycle, however the intervention of the central banks of the world led by the FED reinflated the debt bubble and prevented the process from occurring. Let’s call the past 10 years the “Great Keynesian Science Experiment”. The accepted narrative is that it was successful, however all it really did was extend the inflation in the form of an even larger bubble and cause even larger distortions in the economy. These distortions are called malinvestments and still need to be corrected. The PBC that began in 2008 is now reasserting itself as the FED and other world CBs withdraw their artificial stimulus.
As QT continues and a trade war progresses the markets will reach a breaking point. They will crack and it’s at that point the FED will respond. The critical question then becomes will they be able to reinflate another bubble. No one knows, however I think not for various reasons. Chiefly, QE had become toxic in distorting the economy and causing adverse social consequences. QE is essentially why the US citizenship elected a populist. The FED will probably try QE again, although in a different form such as helicopter money, but it has reached the law of diminishing returns and its future effect will be adverse. Likely it will manifest itself in a rampant inflation or a failure of the currency.
Let’s review where we are right now:
As mentioned the initial stress occurs at the periphery of the world’s economy. We see this happening now in spades. For the past few months emerging equity markets have entered into vicious bear markets. In addition, their bond markets are now getting slammed PLUS there is nowhere to hide as their currencies are collapsing. So what is one to do? Send new money towards the USA as its the only safe haven remaining, and that’s what we see happening:
World Markets (Ex-USA) Entering a Bear Market:
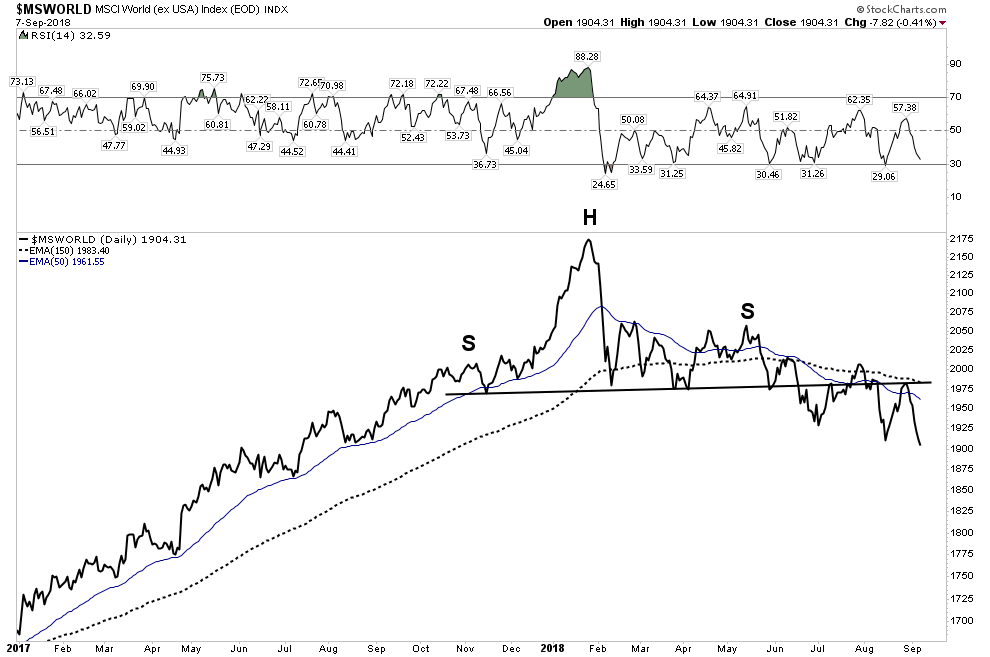
The above chart combines all of the markets in the world Ex-USA and it has now declined 13%. I am calling this the beginning of a world wide bear market. The CNBC types like to require a 20% decline for such a declaration, however that is a very shallow criteria. A bear market requires duration as well as extent. The technical action around the NL and its moving averages is enough for me to give it the bear nod. Plus it just closed at a new low. This index is made up from the charts published below and we see ongoing distributive action which we see in bear markets.
Emerging Markets now well entrenched in a Bear Market- down 21%
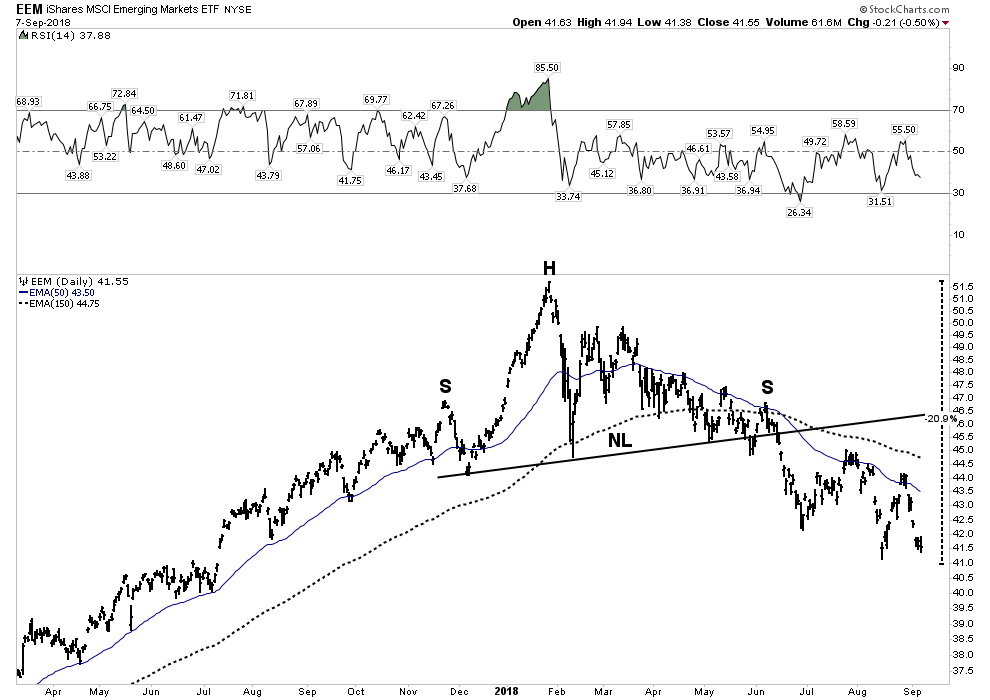
EEM down 21%, but it is much more that that. We see waves of liquidation. All rallies are being sold, they don’t last but a few days and its right back down again.
Pacific Ex-Japan- Full rollover:
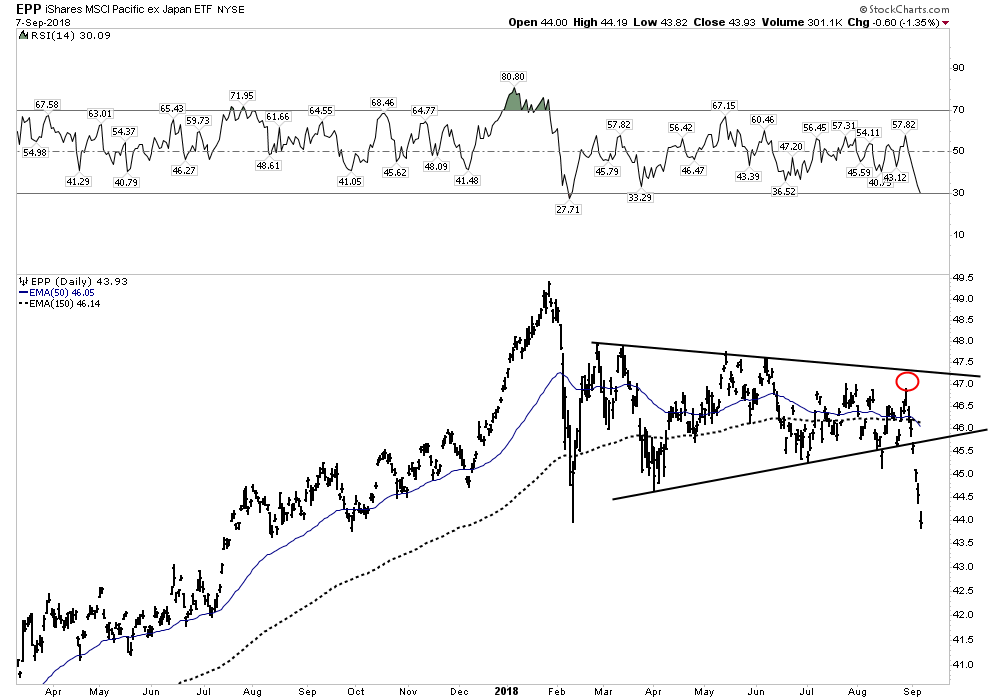
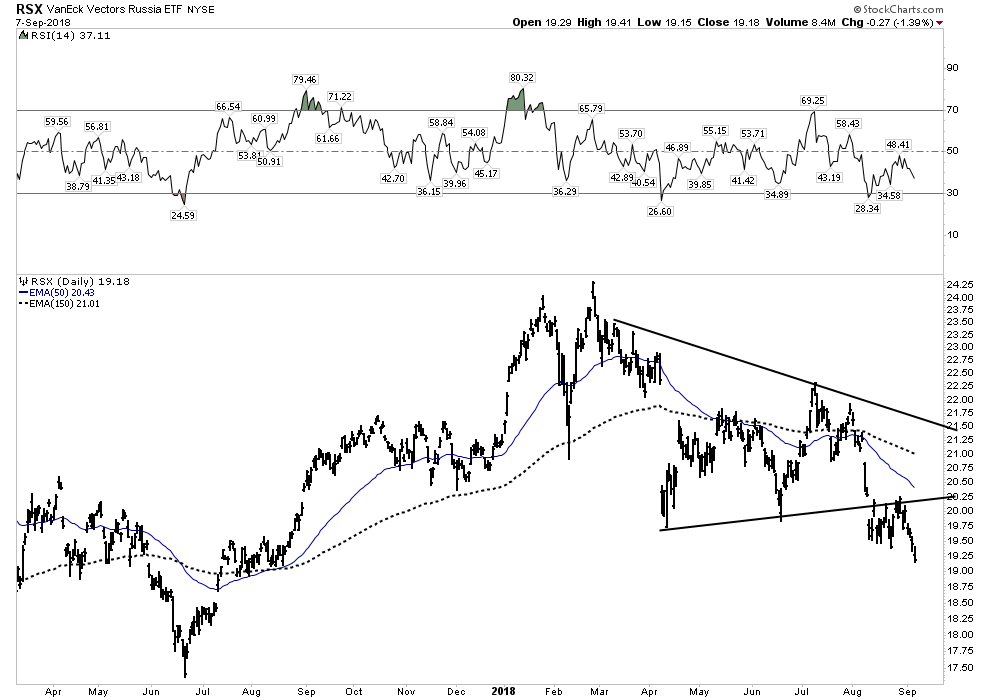
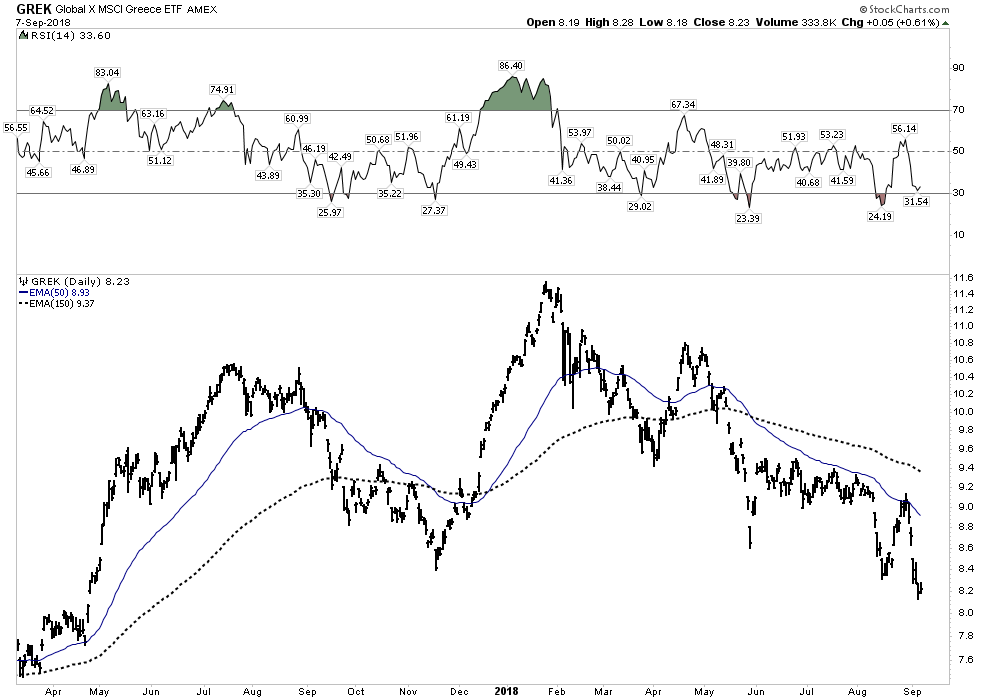
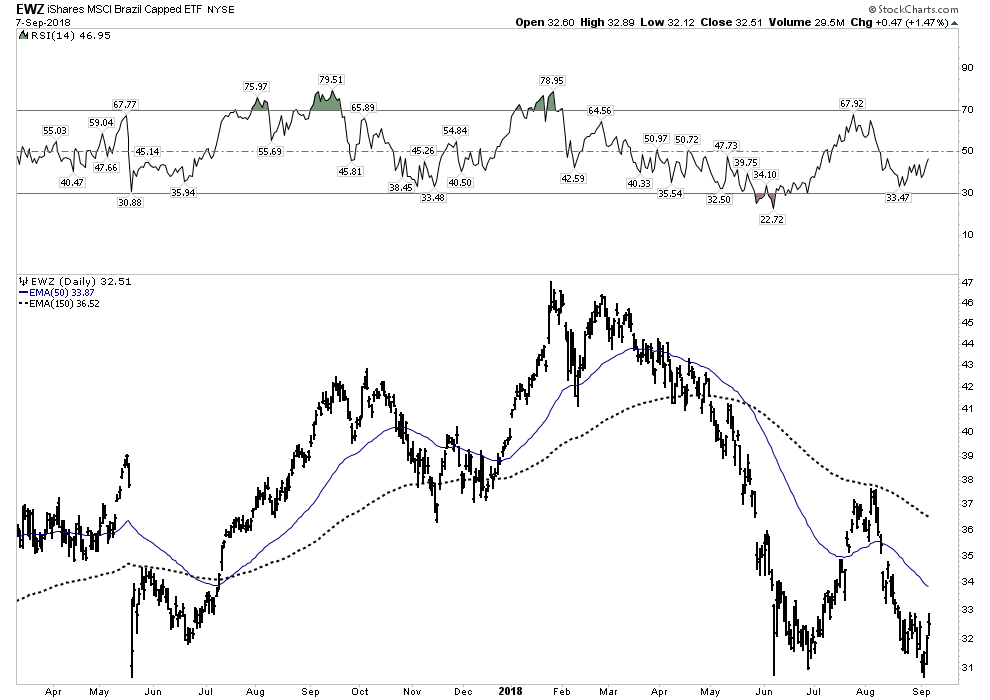
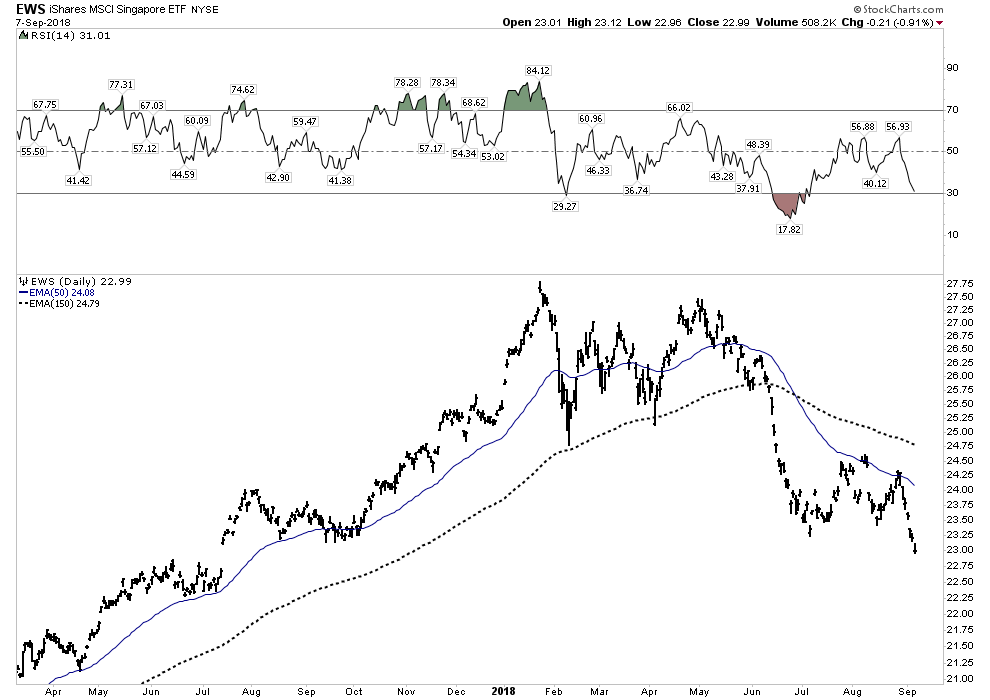
Let’s look at some other Emerging Markets. When we look at these charts you should recognized these common features:
- Failed Rally Attempts immediately pushing to fresh new lows
- Persistant active distribution
- Every rally being distributed
- No attempts to buy
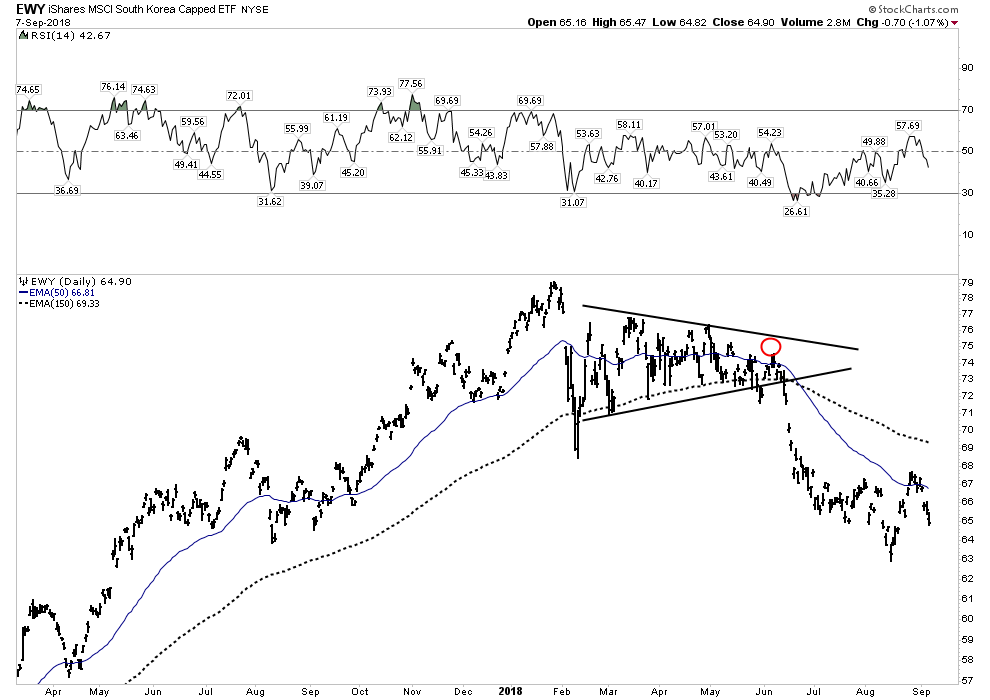
South Korea
Russia
Greece– So much for Kyle Bass’ recover thesis for Greece
Brazil
Singapore
Turkey:
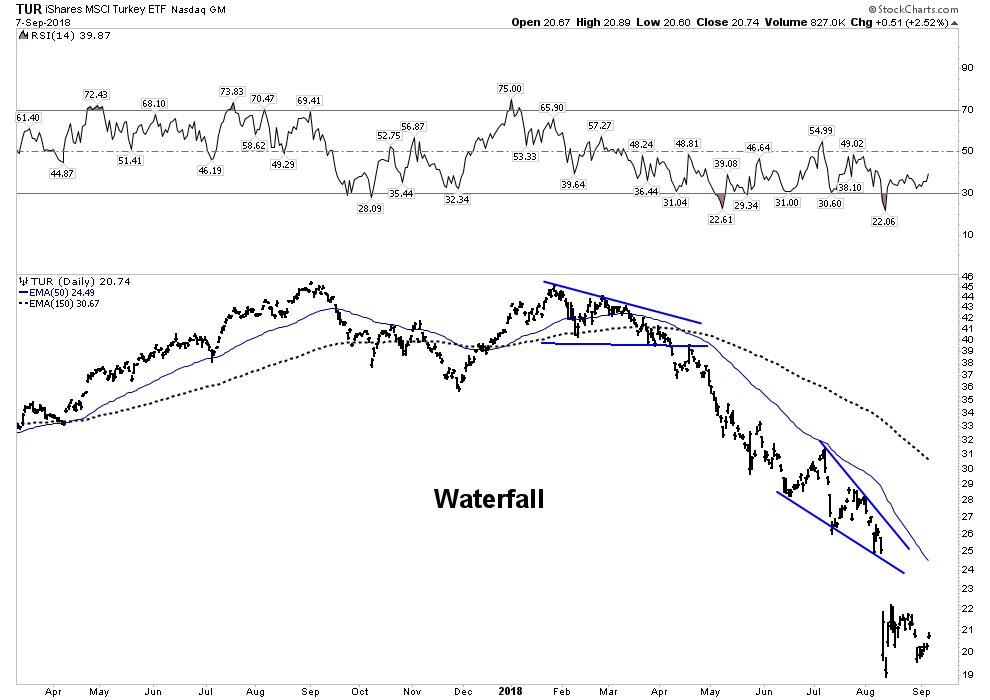
There are plenty more, but you get the message.
You can Run but You Can’t Hide
I mentioned virtually ALL EM Currencies are getting incinerated right now. The India Rupee, Indonesia Rupee, Turkish Lira of course, Brazilian Real, Argentina Peso. Its a blood bath out there. So if one can’t go to cash how about your local bond market?
Sorry, no place to hide in bonds either:
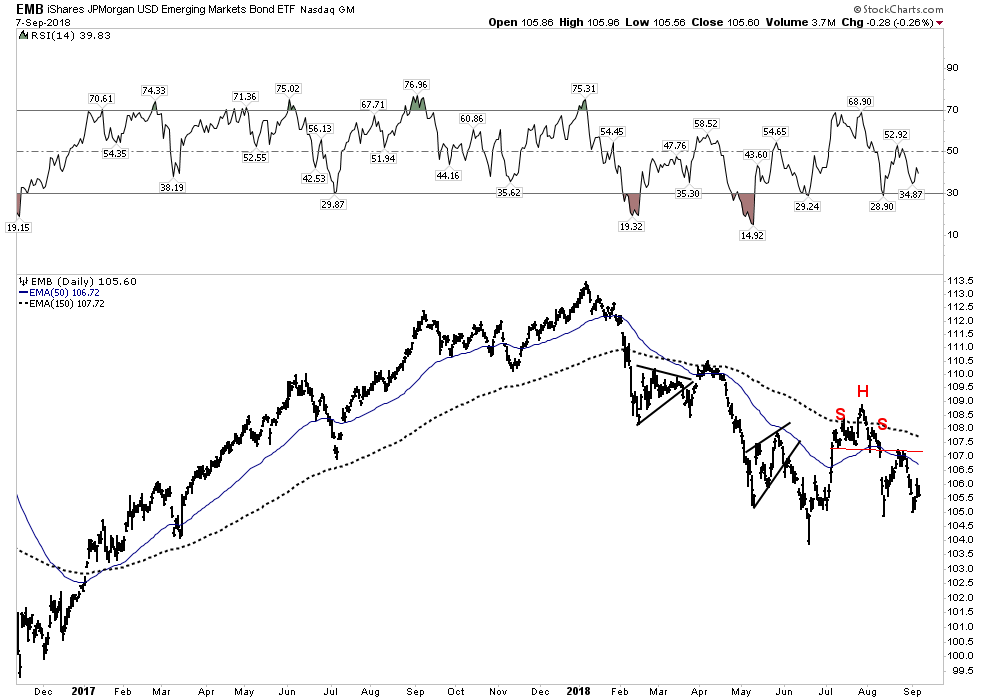
So if you are a periphery economy you are currently experiencing a simultaneous crash in both of your equity and bond markets as well as a crash in your local currency. It is a full-on rout to the downside. There is no safe haven, therefore money flows into the USD and the US stock market. Any money left in ones local economy is getting killed right now and at some point this will drive a global recession and contraction.
The Next Phase- Stress being transmitted to senior economies
We are now seeing this occur with senior markets in Europe and Japan now in full rollover mode. They are clearly advertising their tops are in. Let’s take a look using a weekly perspective:
Europe 50:
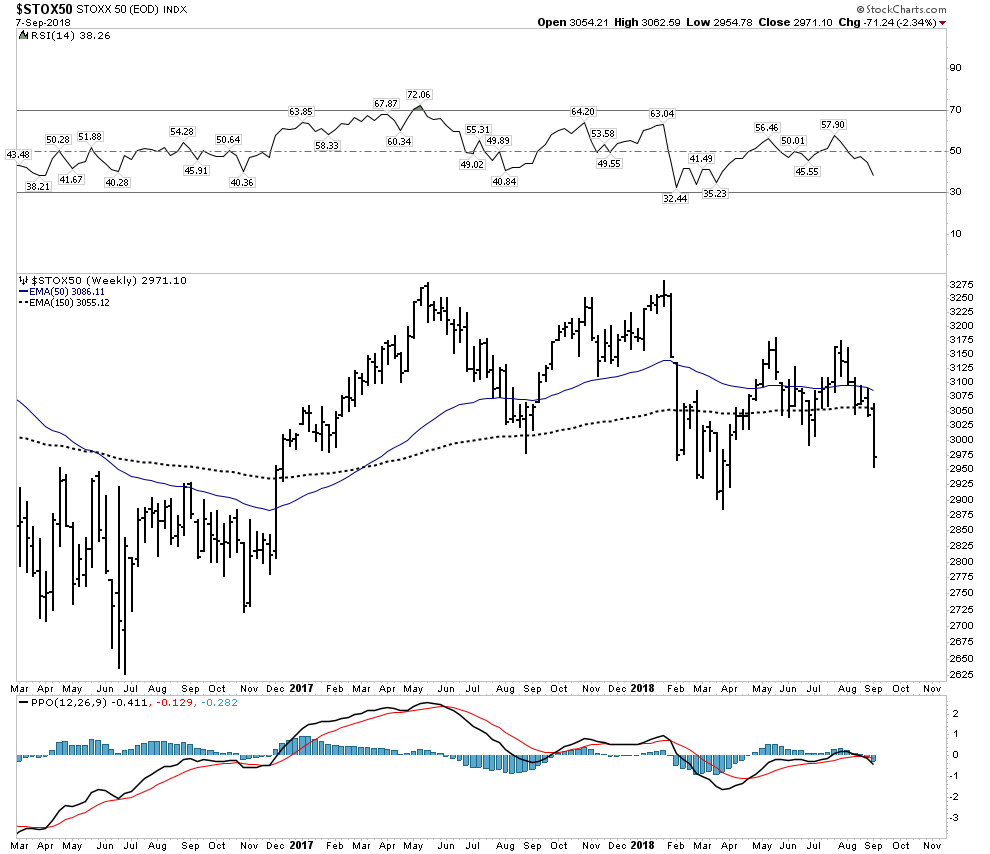
Above: waning RSI momentum as well as the PPO rolling over. Price has now broken below a declining 30 W EMA.
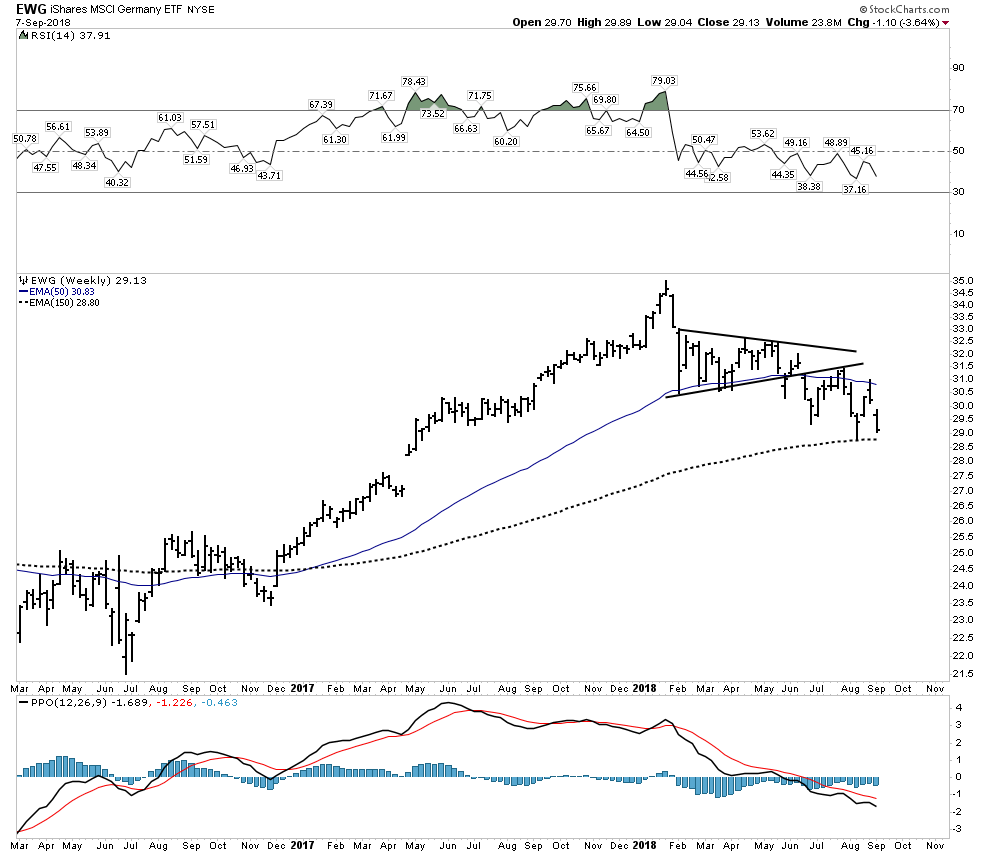
Germany:
Active distribution setting up for a break lower
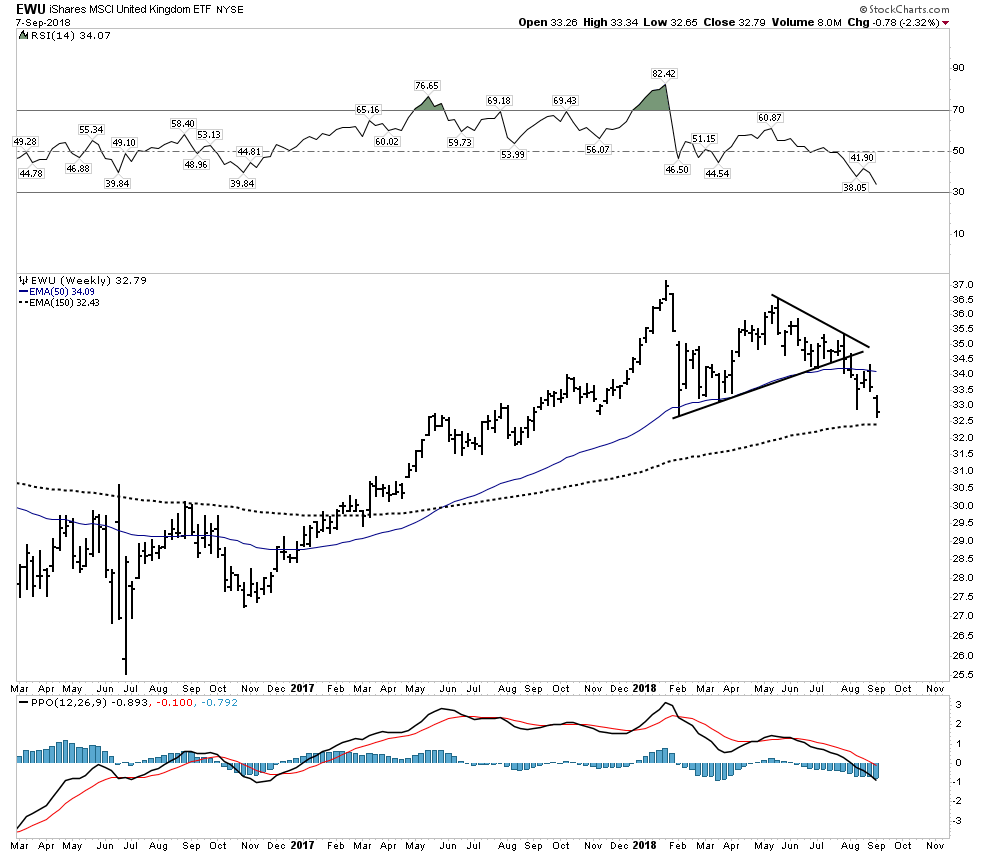
London: Prepare for a drop
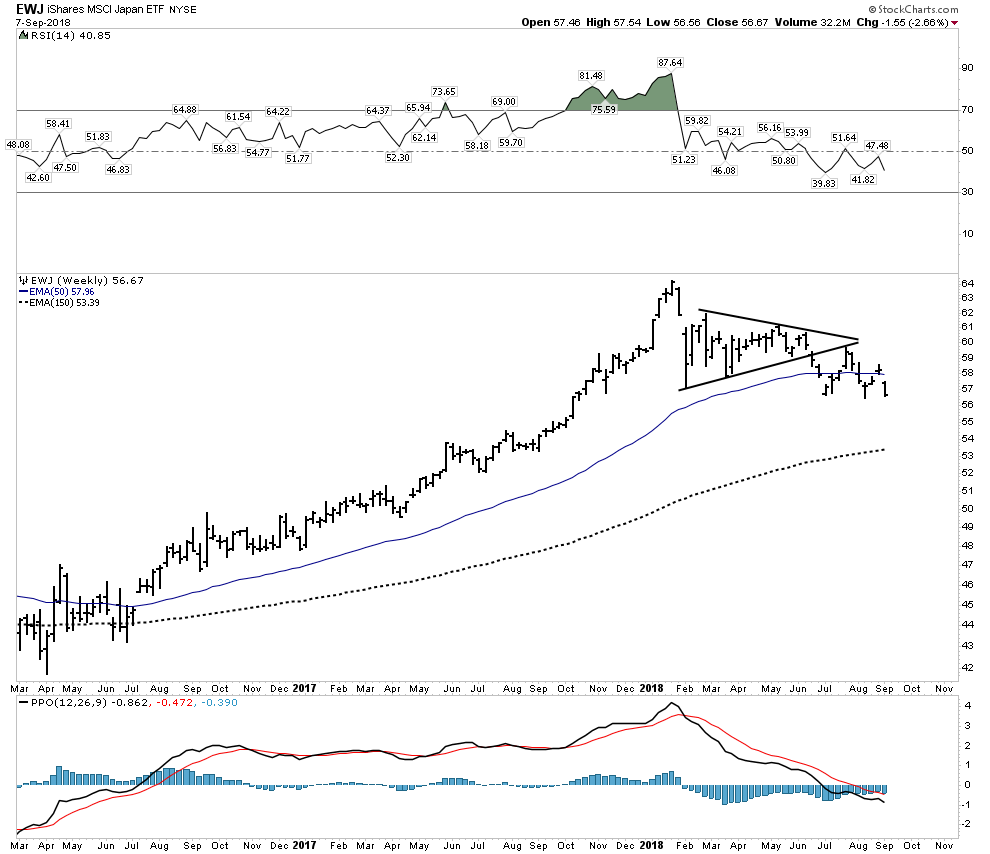
Japan– More Distribution:
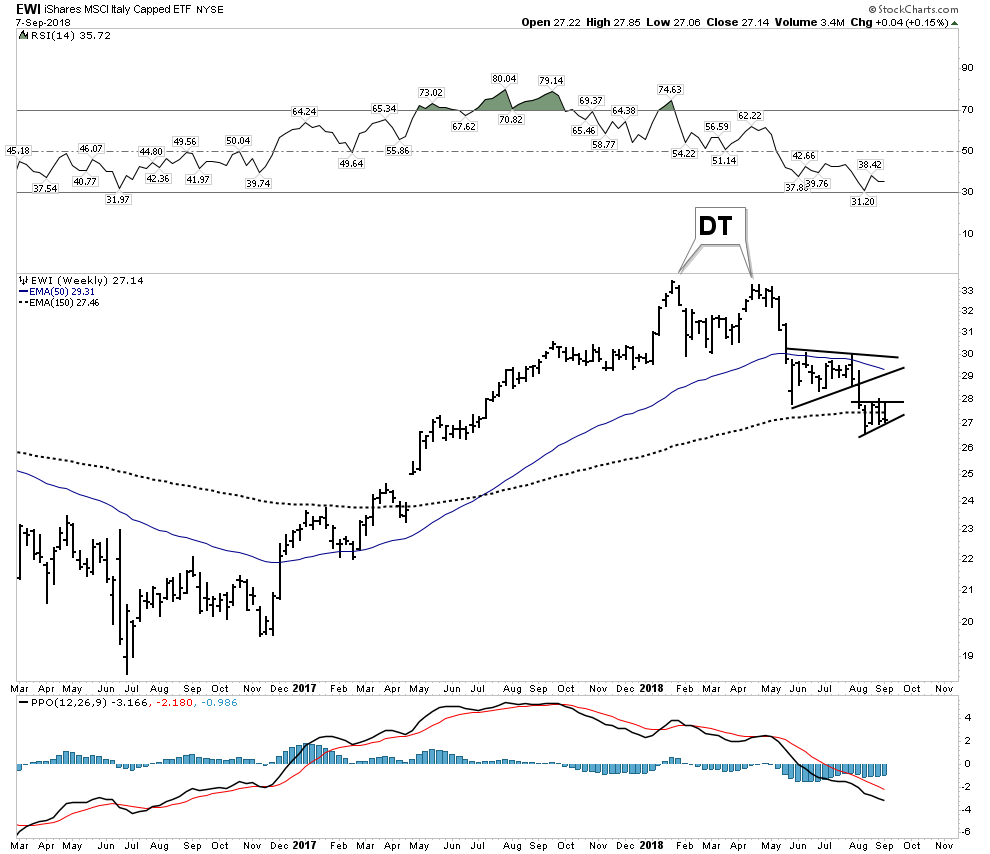
Italy– Sequential Bear Flags
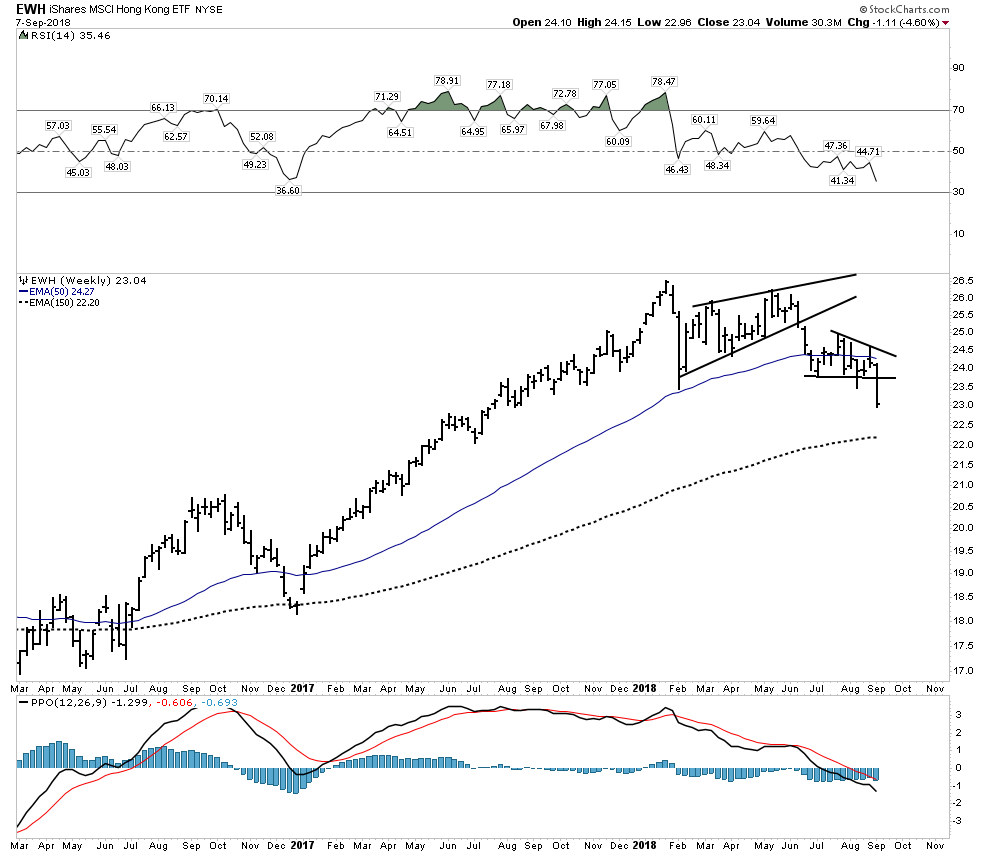
Hong Kong- Financial Center 7th Largest exchange in the world:
Spain– Poised to drop
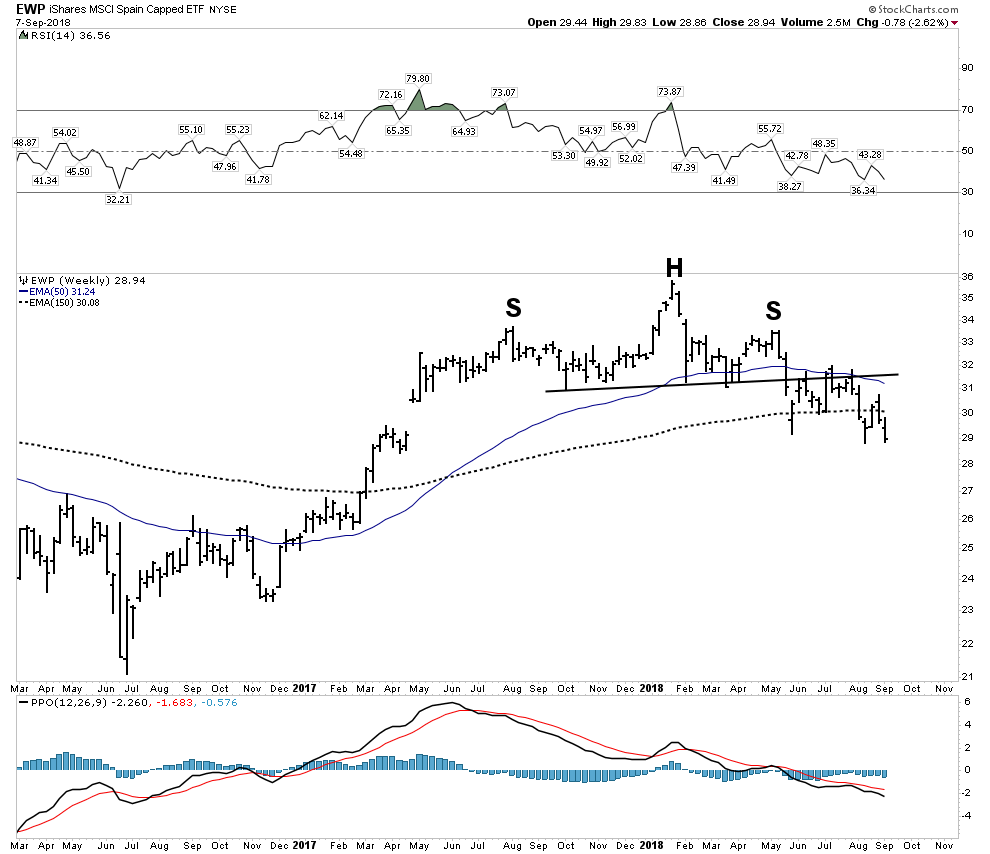
The US Markets- Can we be far behind?
We see the contraction is now transmitting itself into the senior markets of the world, but it hasn’t yet arrived to the US markets. The US is still pushing new highs. The question becomes with a global slowdown in its early stages when will the US markets care?
The US cannot prevent succumbing to these forces forever. In fact many indications point towards that moment by mid October. September has two powerful bullish forces keeping this market advancing. Money manager window dressing before the end of the quarter pushing money into the momentum stocks and an active time window for corporate stock buy backs. These dynamics have about 2-3 weeks remaining and then the market must face continued QT tightening and weakening foreign markets. Once foreign economies go into recession, likely early next year, the US should also enter with a lag of 3-5 months. The stock market should begin to discount this event months in advance.
Cracks beneath the surface
Already we are seeing cracks begin to appear. If you have been waiting to short the FAANG stocks the time is almost at hand. In fact the F in FAANG is ready to short now. Facebook is the first FAANG stock to fall out of the pack. Just like wolf’s stalking buffalo the wolf pack can now pounce on the first vulnerable FAANG to fall out of the heard.
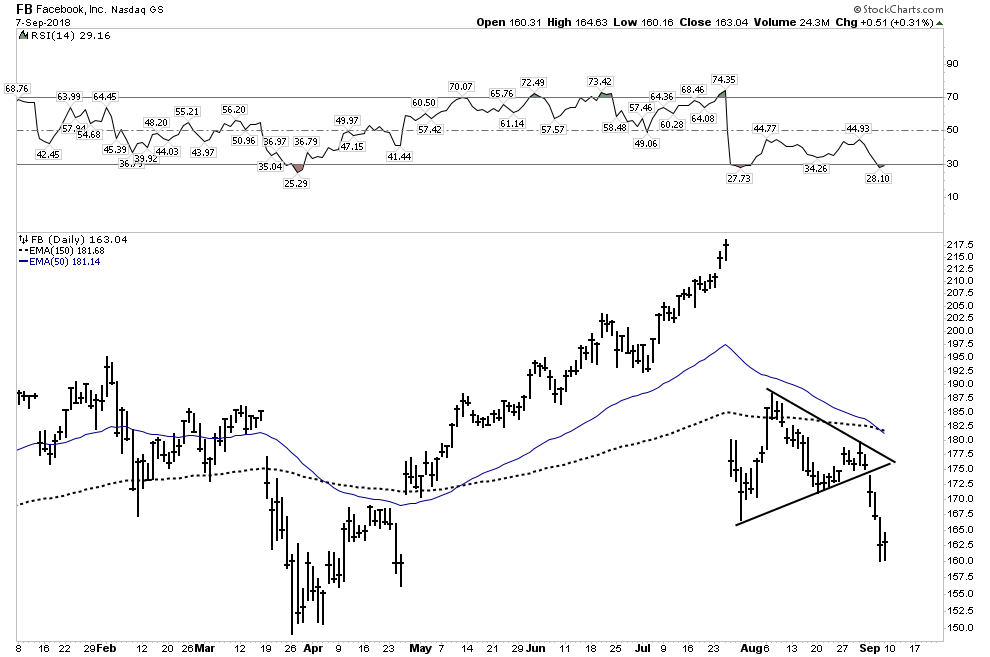
What we see now is distributive action. After the huge drop right off the top it has not been able to recover. The dip buyers failed to show up and instead delivered lower highs and a gap down out of its triangle consolidation. If it back tests its breakdown that would be a safe belly entry into a short position.
Netflix may be the next to go but it hasn’t shown yet if it is being distributed or it’s just in a correction. We will keep an eye on it.
The Year 2018- A rolling top for US markets
I have been chronicling this all year long. The Phase III of the bull market ended in January of this year. It had a classic blow-off overthrow top in December and January. These types of tops often include an object of speculation. In this instance it was Bitcoin. It blew out simultaneously with the markets top.
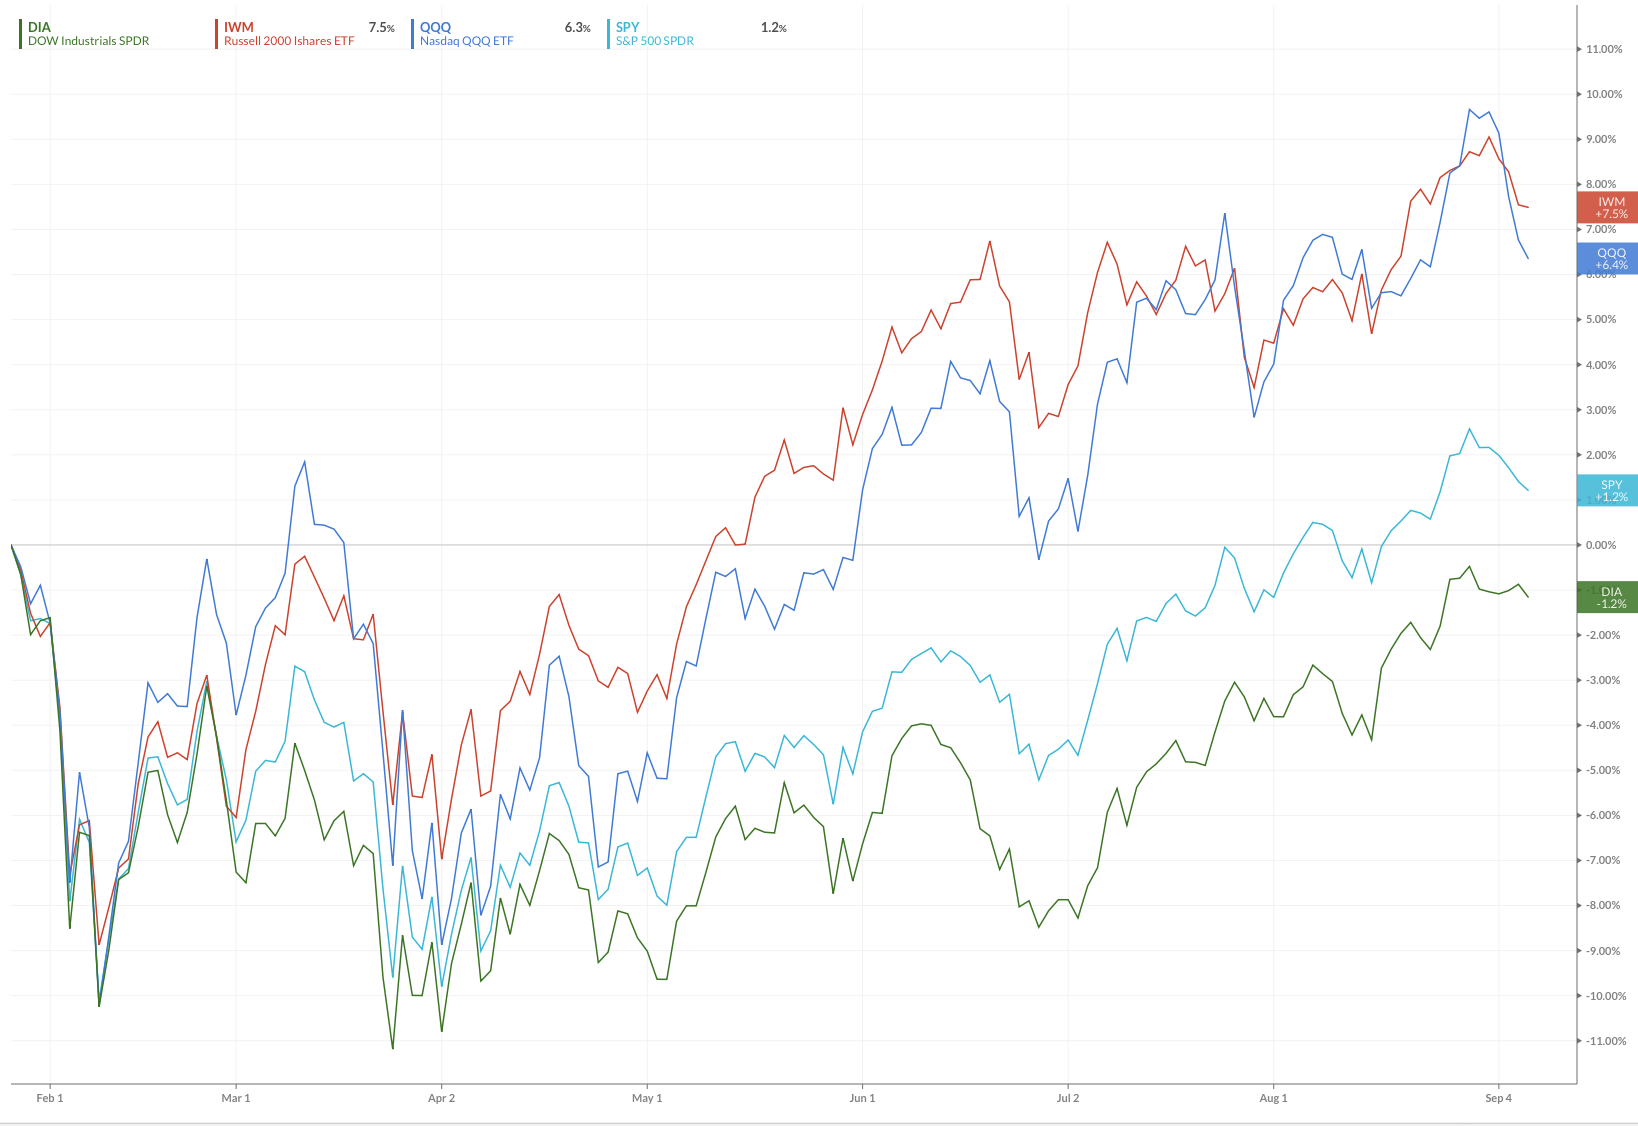
Since the top the rest of the year has entailed various averages attempting to recover their old highs. Some have, while some haven’t. This is also classic rolling top action. The tech sector and the QQQs have blown far past the old highs and have served as a Red Herring for Mr. Bear keeping the public in the market. The small stocks in the Russell 2000 have also been standout performers. The Dow and the NY Composite however have failed to recapture their old highs. This has been a blatant non confirmation of the market typically seen at market tops. Dow Theory has confirmed the same with transports reaching new highs with the DOW failing to confirm.
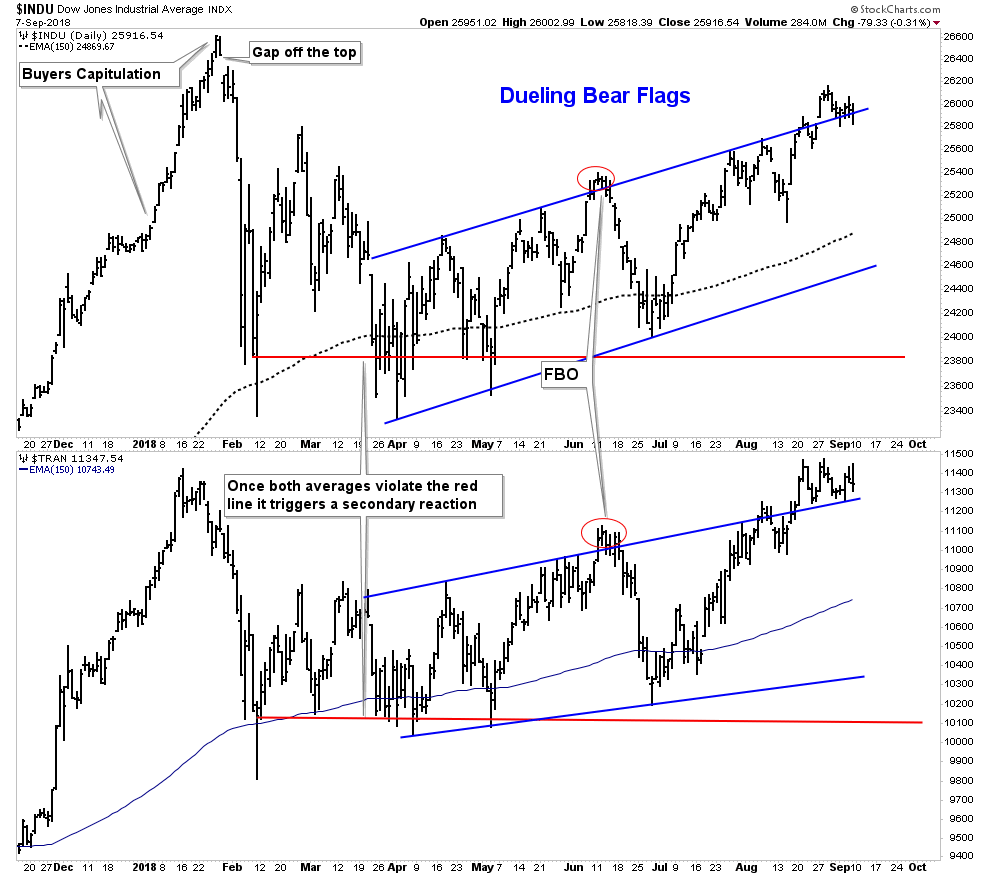
We have been waiting all year for the DOW to confirm the uptrend by going on to new highs. As of yet it has not, whereas the transports have.
The below chart shows the relative performance of the popular four indexes beginning at the market high in January. The Dow is the only index not going on to a new high
The Next Crisis- A Global Liquidity Crisis (GLC)
In 2008 the world fell into the global financial crisis. This was centered around the banks and mortgage finance. The next crisis will not be a bank collapse it will be a liquidity void. Markets will lock-up due to a lack of liquidity. Massive blocks of ETF’s and Index funds will be cast upon the exchanges to be sold by computers on autopilot. There will be huge gaps down in prices because there will be no liquidity due to no buyers. When the tide finally turns in the US market it will go full bitcoin.
Initially there will be no safe space with the possible exception of US Government bonds. Virtually all stocks will get sold. Even fine companies such as Cameco which appears in an early stage bull trend should get smashed as selling will provide liquidity. Stocks such as Amazon will be gorged possibly losing 50% or more.
Corporate bonds will be smashed and foreign currencies devalued. The roots of the GLC is a shortage of US dollars due to a breakdown of exchange systems around the world. This has all been enabled by the ending of the Bretton Woods Monetary regime in 1971. Since then trade has not effectively cleared and debts have been built up to monstrous levels.
Commodities in a Post Bubble Contraction
It is easy to see that commodities will initially decline as a global recession takes hold. This time a decline could be rather dramatic as China consumes upwards of 50% of many industrial commodities. By reviewing the below charts one can get a sense that there may be an epic decline in commodity prices on the horizon.
The narrative early this year was that commodities were in a long term secular bull market with copper and oil prices to rise for years. The charts below tell me this narrative was false and was the result of recency bias from an uptrend that has been going on for 2-3 years.

Again the above long term CRB chart raises the possibility that the past 2+ years was simply a slow motion back test of the break down below the 40 year support zone. It is after all a rising wedge which is usually bearish. We can see it if did break down from here there is no support all the way down to those early 1970 prices. This type of drop seems virtually inconceivable until one understands the PBC model and the looming GLC event coming. In fact it a collapse to 1970 levels fits it perfectly. A flash vertical drop down to those levels would be caused by a lack of liquidity.
Let’s zero in on the past 3 years of the CRB chart and look at that bear flag close-up:
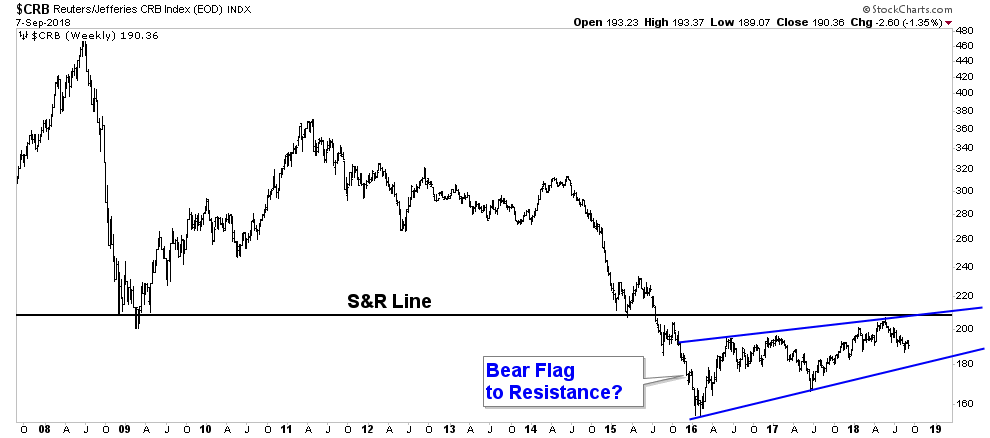
It’s pathetic. It certainly doesn’t look like a new bull market as it can hardly get out of its own way. If it breaks below the lower support line it would be a huge tell and would be an awesome short entry.
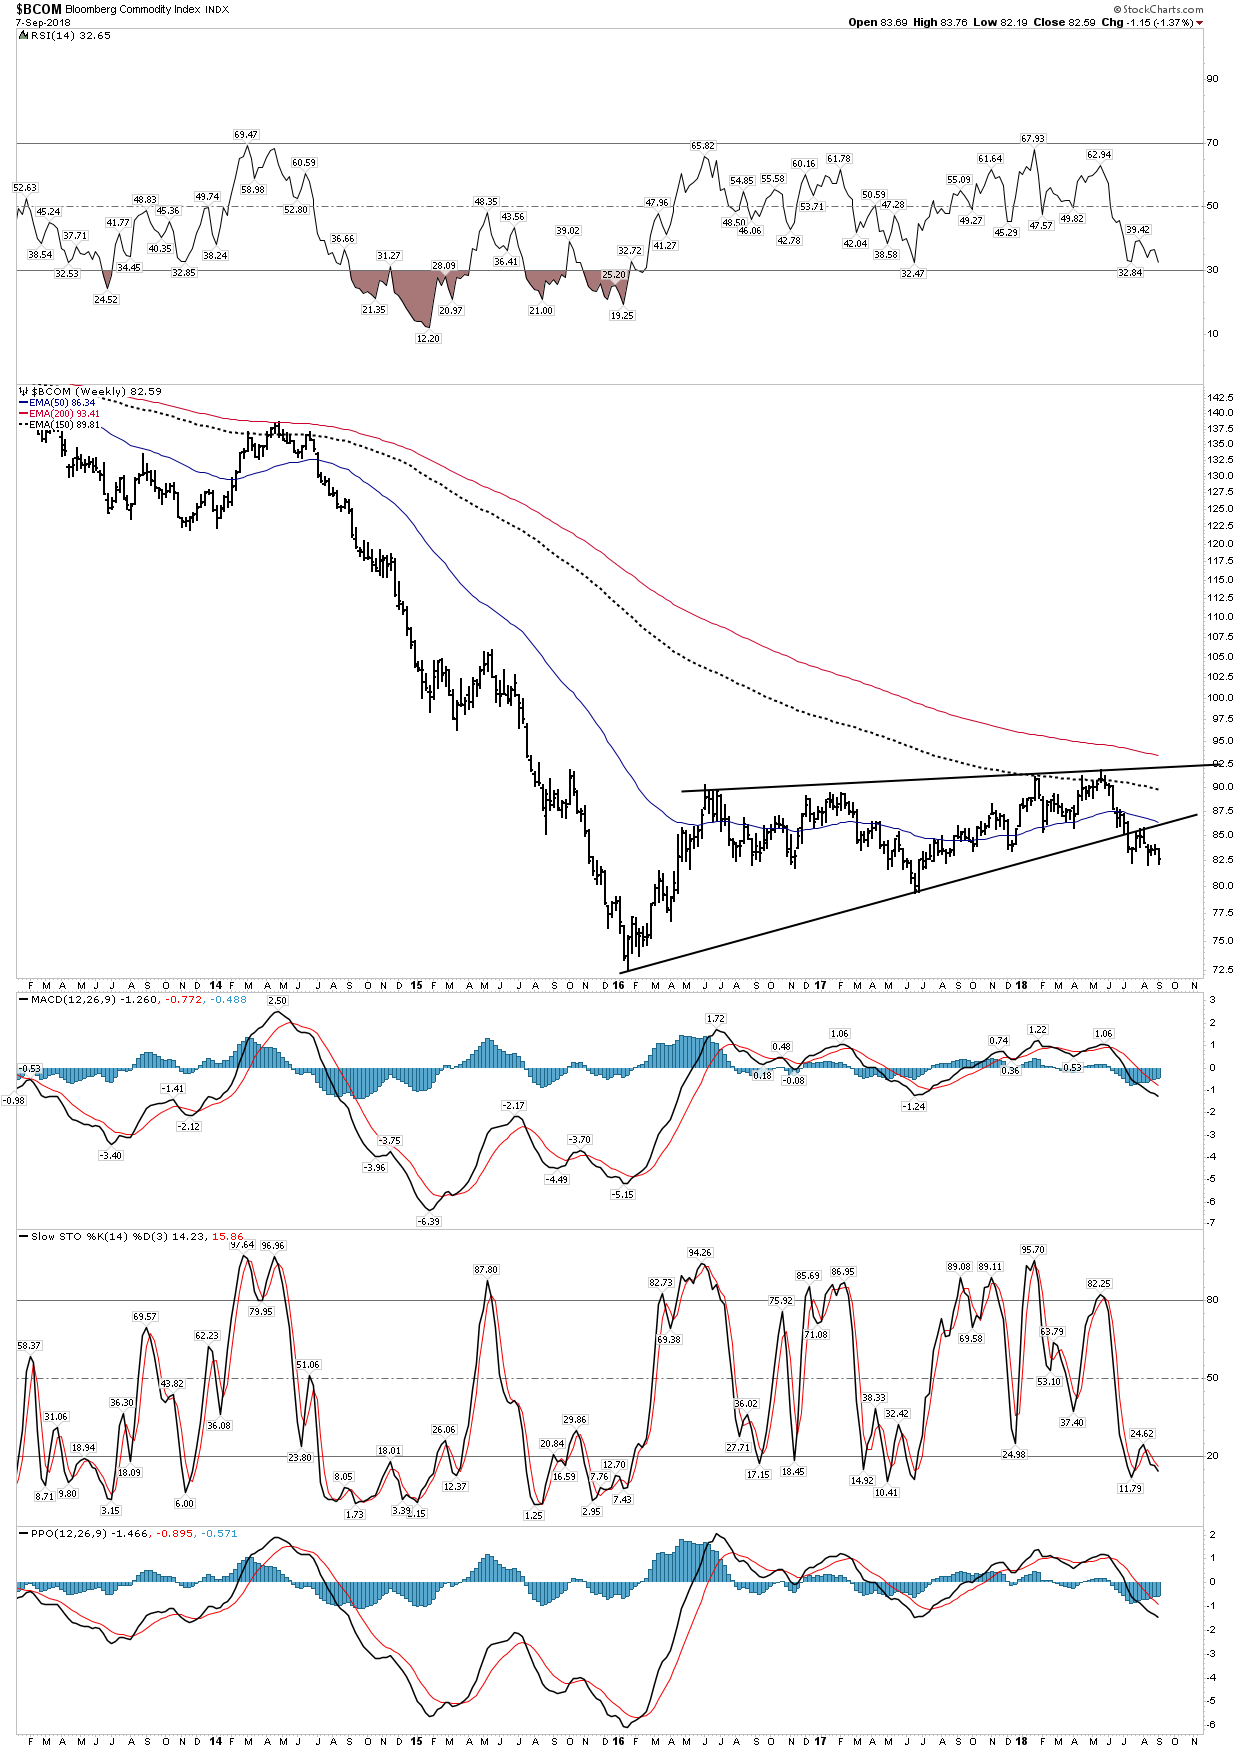
Now some are quick to criticize the CRB for various reasons such as its composition etc. So lets look at other commodity indexes:
Bloomberg…. it’s already broken the lower bound and it also looks pathetic:
Below the Goldman Sachs index a bit more frisky but has not broken to the upside.

The DBC- Weak bounce struggling with the 200 EMA
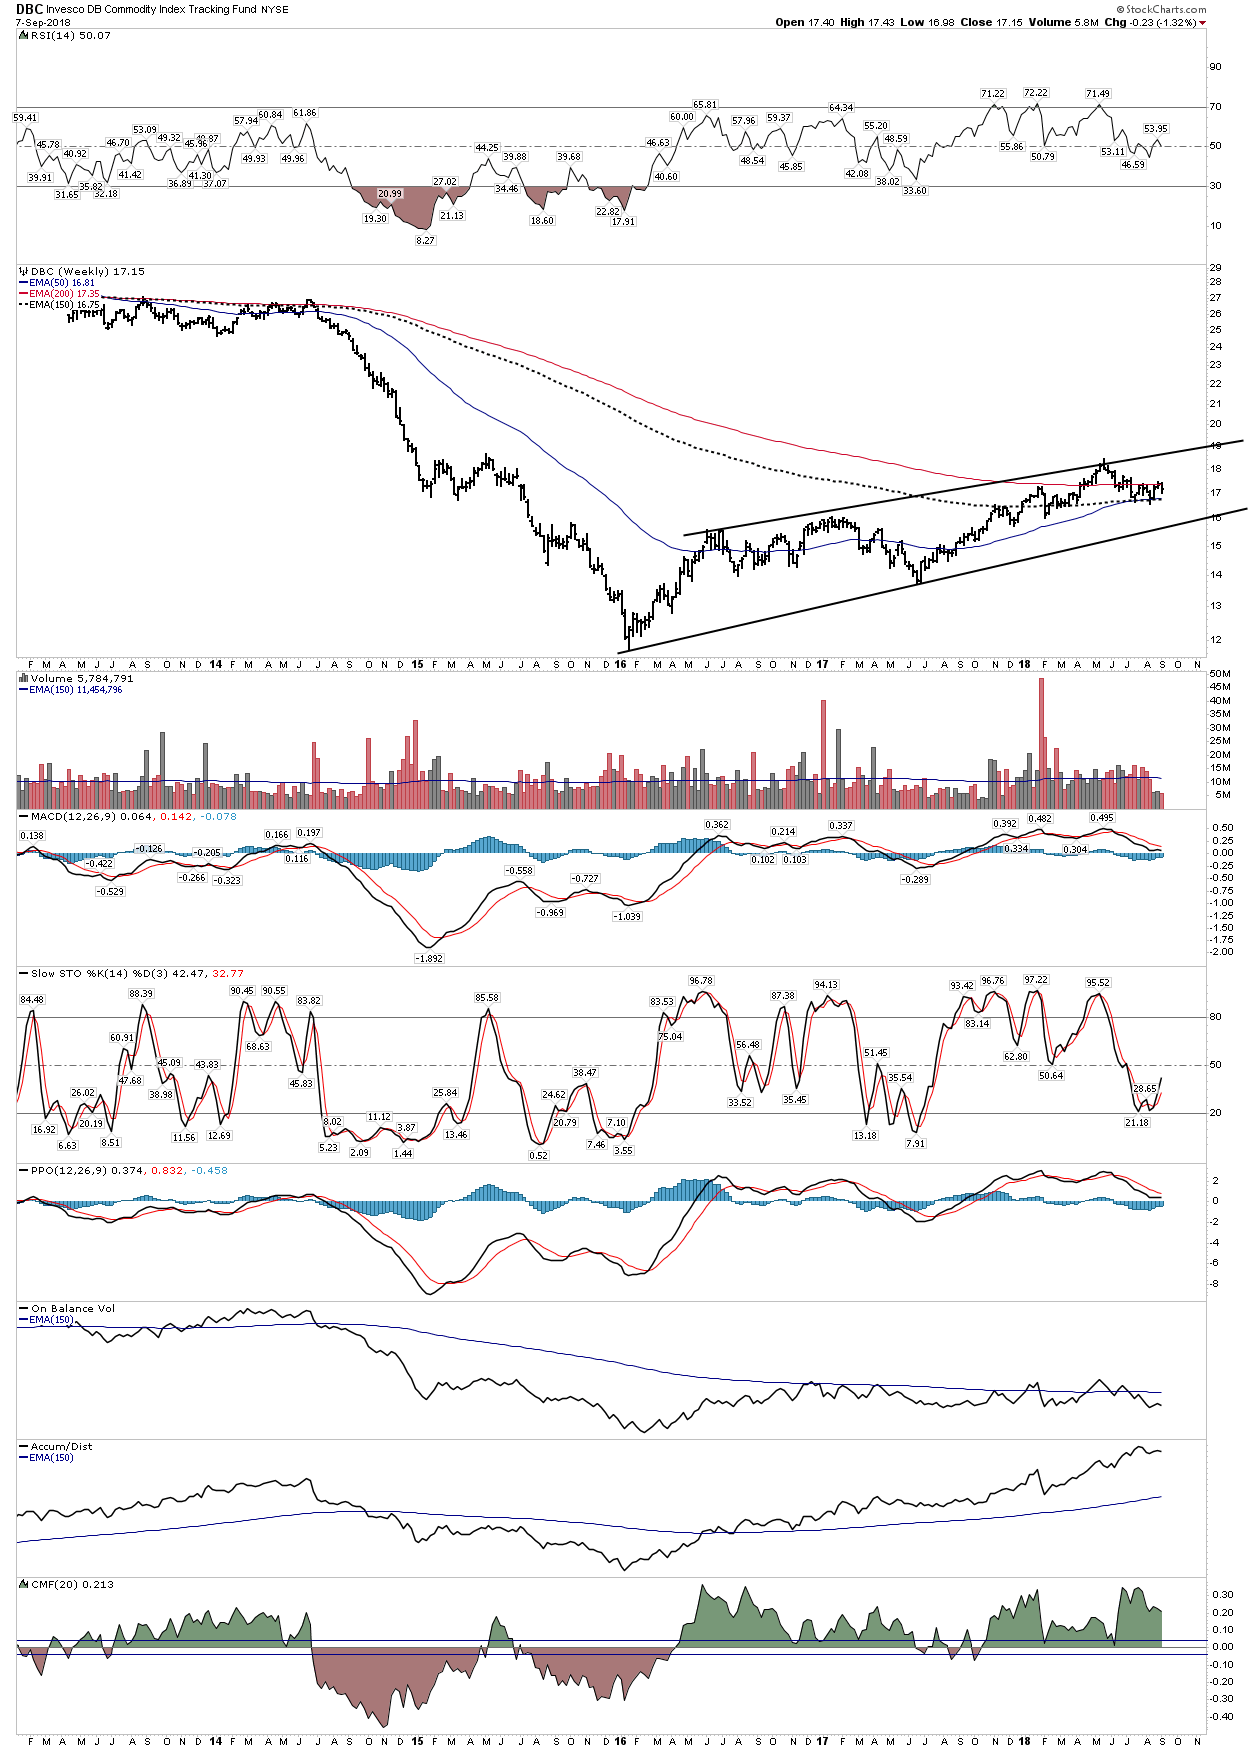
What all of these commodity charts show is the action over the past 30 months was likely just a cyclical bull market within a secular down trend.
Australian Dollar– Confirming the same:
The AUD is a commodity based currency therefore it’s a great proxy for the commodity market. What it has been saying is that the 30 month cyclical bull market was indeed just a counter trend bull market within the context of a secular bear market and the currency is leading the way down saying those commodity bull markets are now over. This chart says look out below as the 2 year rising trend in the AUD may prove to be a half-way pattern for the down move.
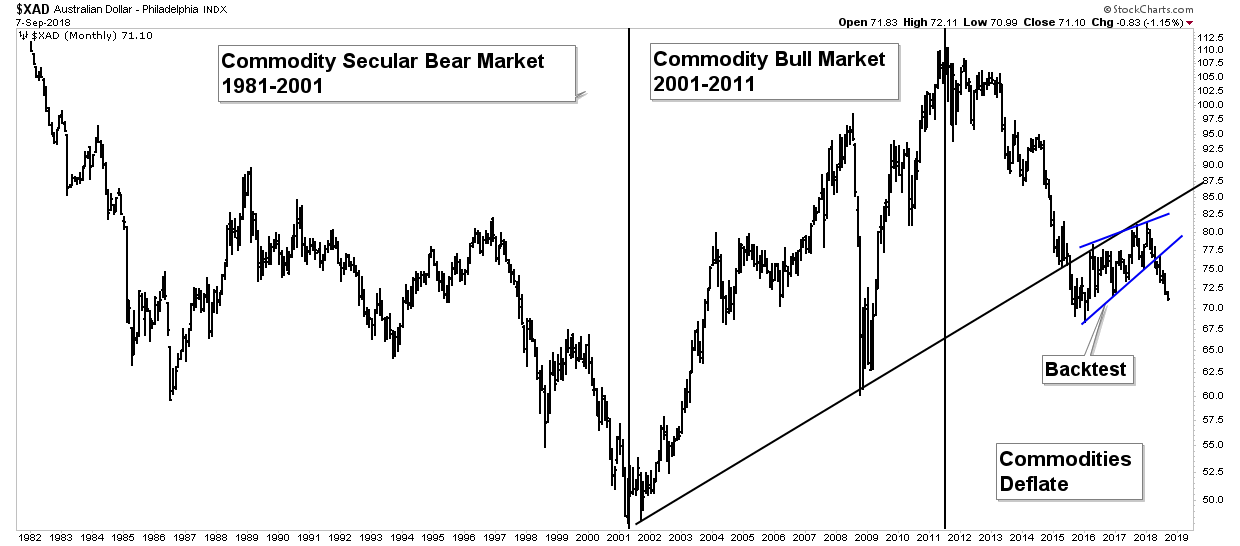
This decline is consistent with the PBC model and could occur during a GLC.
END OF PART 1– In part II I will cover the effect of the GLC on gold and oil and offer an investment strategy to navigate this mess….to be published later today.
EDITORS NOTE
Who is Plunger ?
http://www.talkmarkets.com/contributor/Plunger#