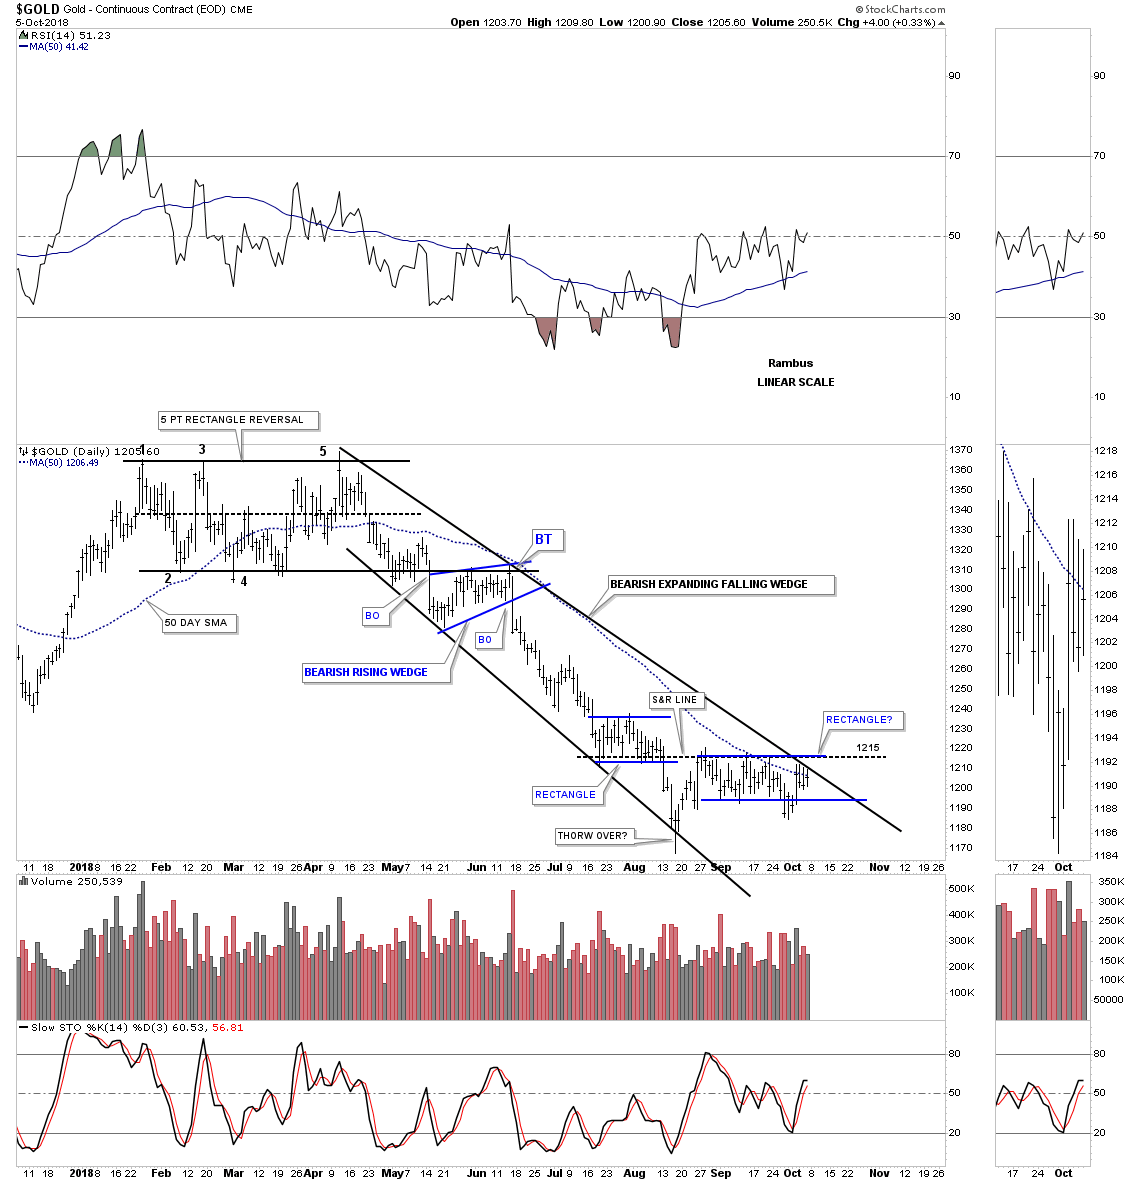
Several weeks ago we looked at some resistance points for gold and silver from the short to the longer term time perspective. Below is a daily chart for gold which starts with the 2018 five point rectangle reversal pattern which broke down in May. The backtest to the underside of the five point rectangle took about five weeks to complete, forming a bearish rising wedge. From that point the impulse move down began in earnest stopping in mid July to form a small rectangle. After trading sideways for about three weeks gold broke down from that small rectangle and finally bottomed in mid August where it began a countertrend rally.
The countertrend rally stopped at the bottom of the small July rectangle where support turned into resistance as shown by the black dashed S&R line at 1215 which is our first line in the sand. There is also the top rail of the expanding downtrend channel and the 50 day sma which are also offering resistance.
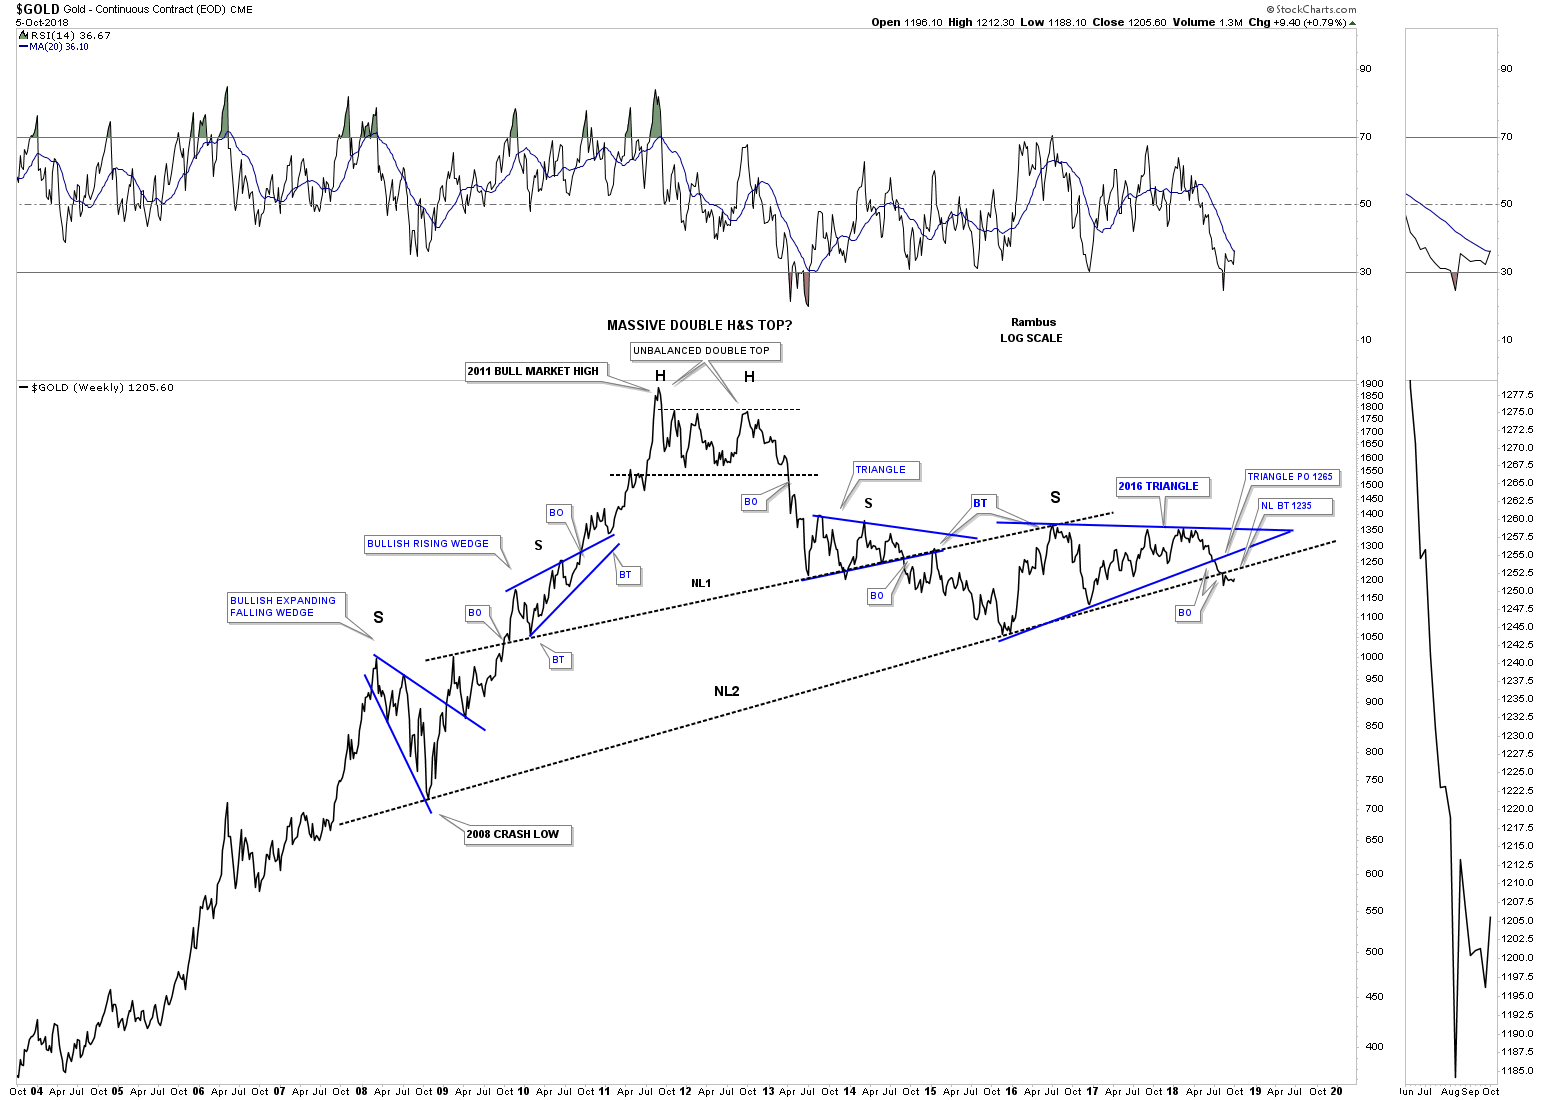
In order to find the next important area of overhead resistance we need to look at a long term weekly chart going back 15 years which shows the possible massive H&S top. The backtest to the neckline comes into play around the 1235 area and if the backtest fails to hold resistance then the last important line in the sand is the bottom rail of the 2016 triangle which is around the 1265 area. As we’ve discussed so many times in the past, it’s now up to the bulls to show us they mean business by first taking out the 1215 area followed by the 1235 area with the last important line in the sand at 1265.
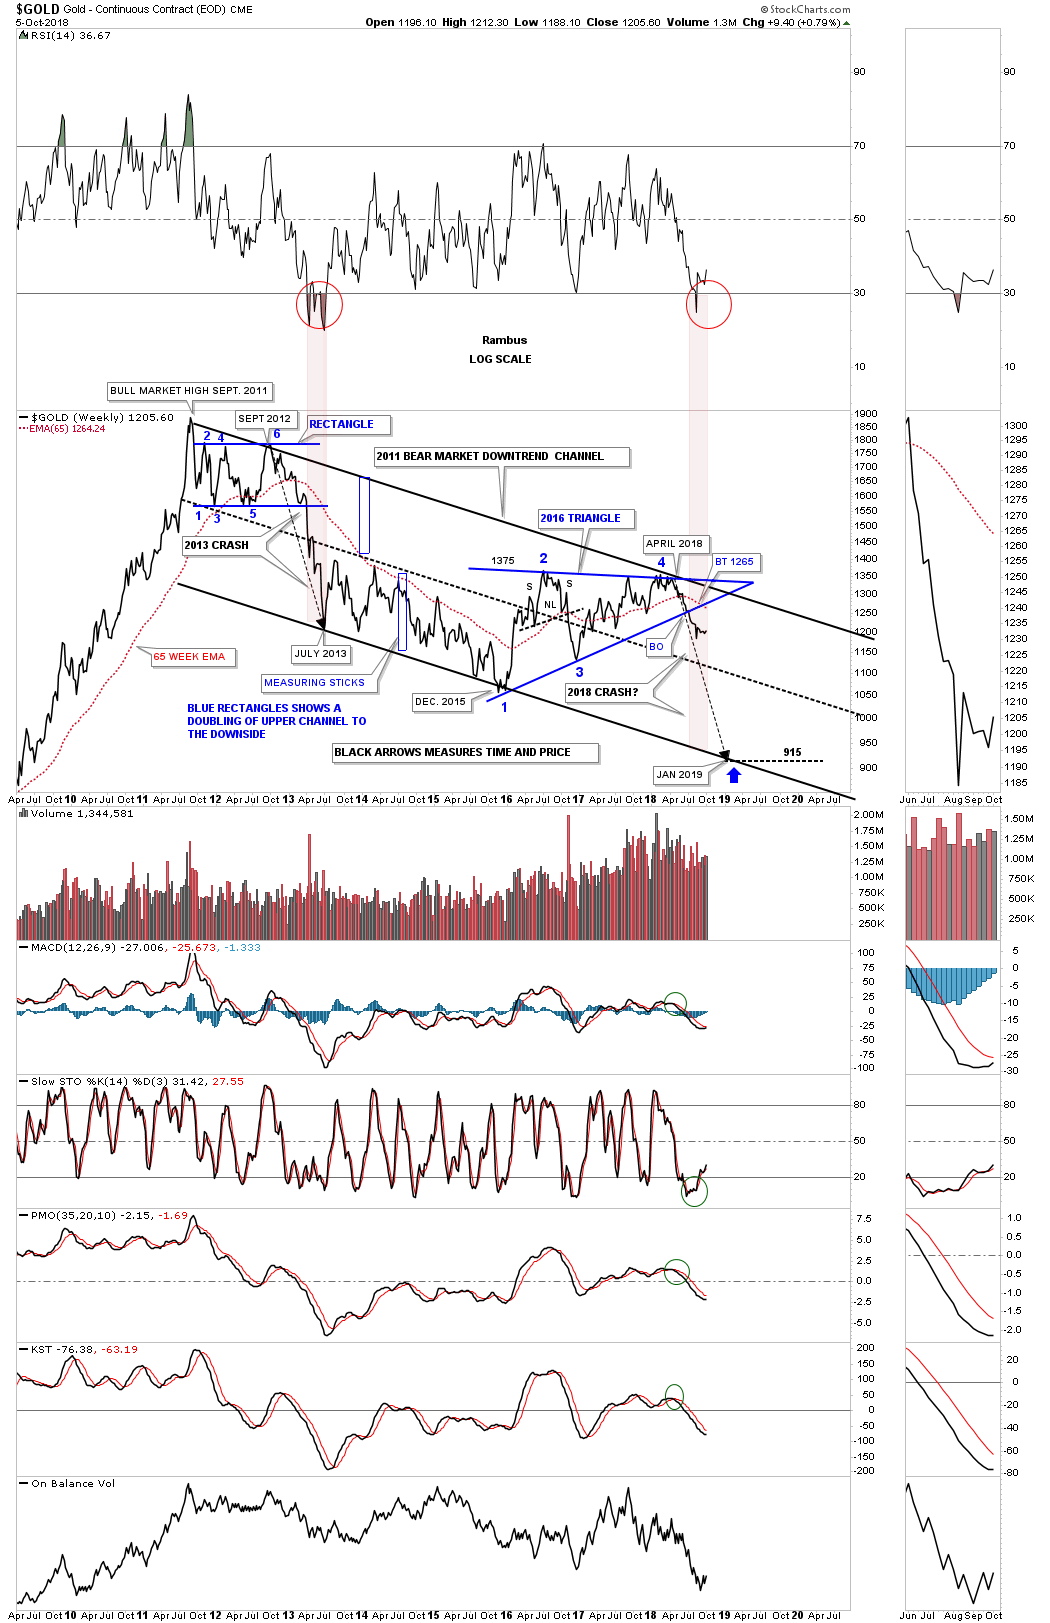
This last chart for gold shows the 2011 parallel bear market downtrend channel with the 65 week ema at 1265 that does a good job of holding support during a bull market and resistance during a bear market impulse move.
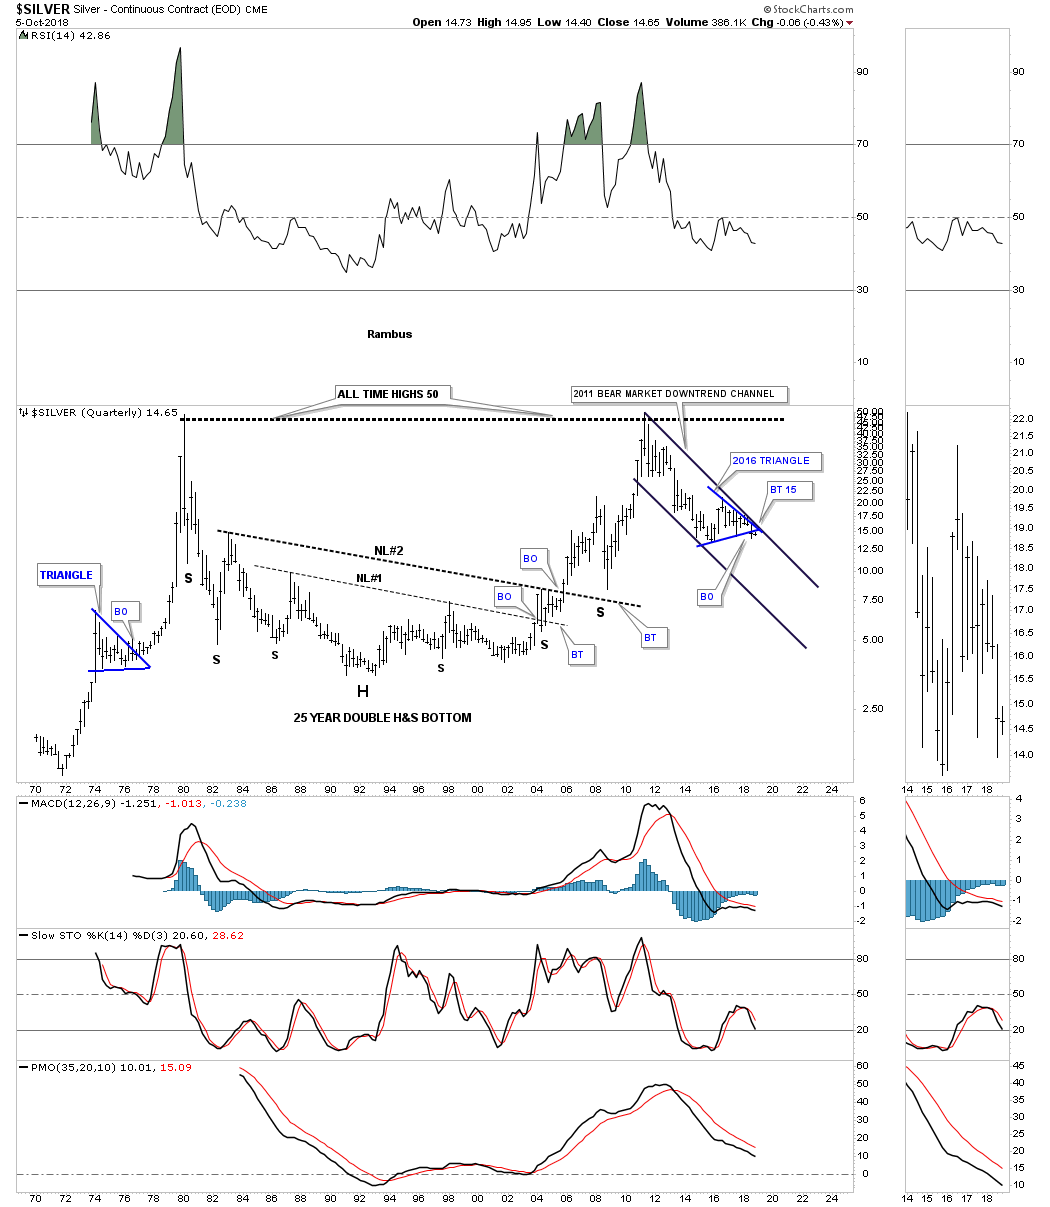
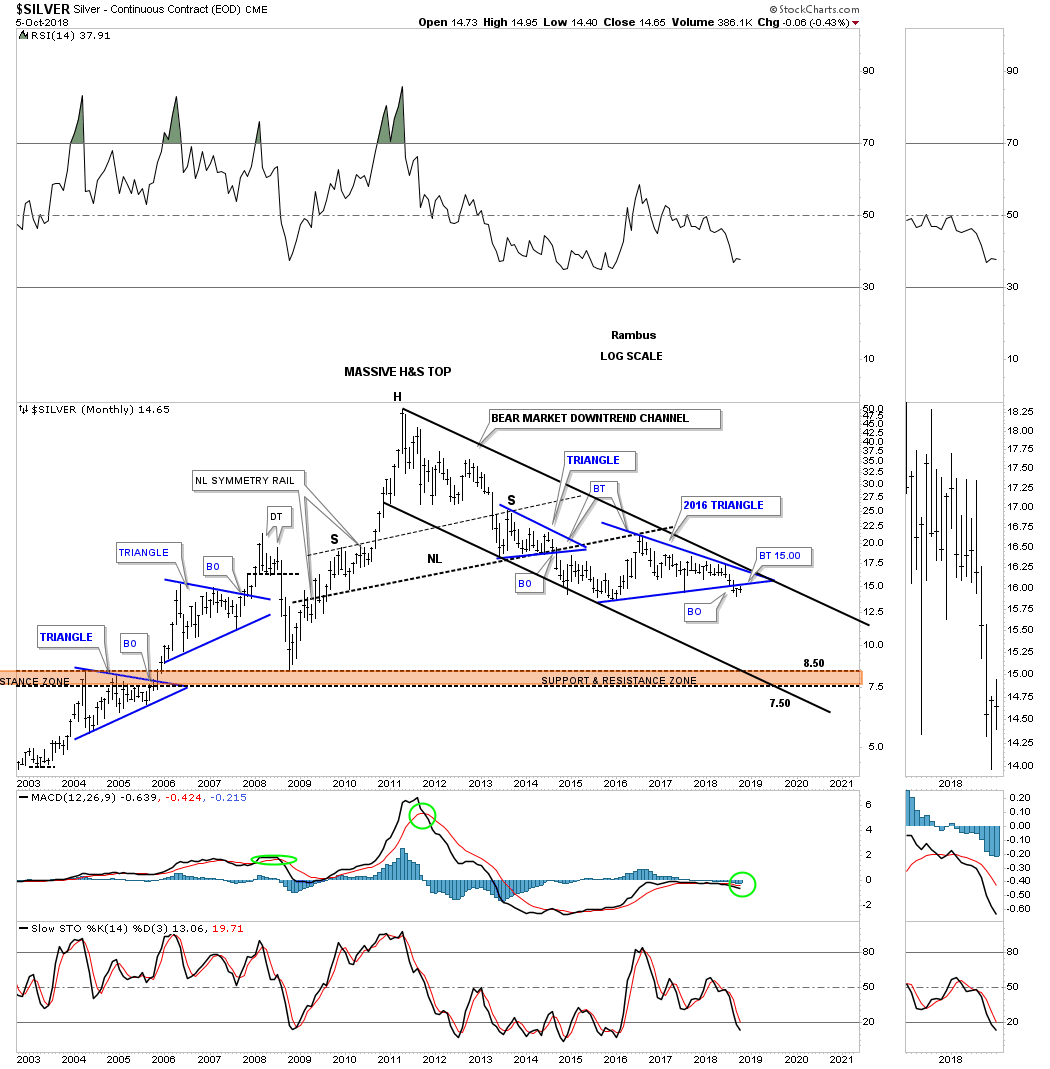
Just like gold, silver also built out a 2016 triangle and backtested the bottom rail this week at 15 which marks our first area of overhead resistance. As you can see on this long term monthly chart, silver like gold, also has a massive H&S top in place along with its 2011 bear market downtrend channel.
This last chart for silver is a 50 year look which shows its massive 25 year double H&S bottom along with its 2011 bear market downtrend channel and its 2016 triangle. Note the blue triangle that formed way back in 1974 which separated the first impulse leg up from the second leg.
As the charts above show there is some near term resistance at 1215 for gold and 15 for silver which are basically being tested right now. Patience is the key going forward until they either begin their next impulse leg down or breakout above overhead resistance. Have a great weekend and all the best…Rambus