
I would like to take a look at the recent action in the GDX and consider whether the gold stocks have now completed the correction which began in early August 2020. It appears to me that the internal action demonstrated by the GDX indicates there is a decent chance the bottom is now in and the index is now set to advance.
I am certainly NOT declaring a bottom because the chart has not traded above its last high and until then we just won’t know for sure. The trading action in the GDX over the past two weeks however, is indicating that a bottom may be at hand. This trading action is occurring just above the low put in at the end of November. It appears we are witnessing a successful double bottom retest.
Rambus has been charting 2 scenarios simultaneously in this index. The broad up-sloping H&S pattern appears quite menacing and I acknowledge it remains a distinct possibility therefore I do not recommend going in whole hog due to my bullish positive analysis that I am about to outline.
The 6 Month Correction
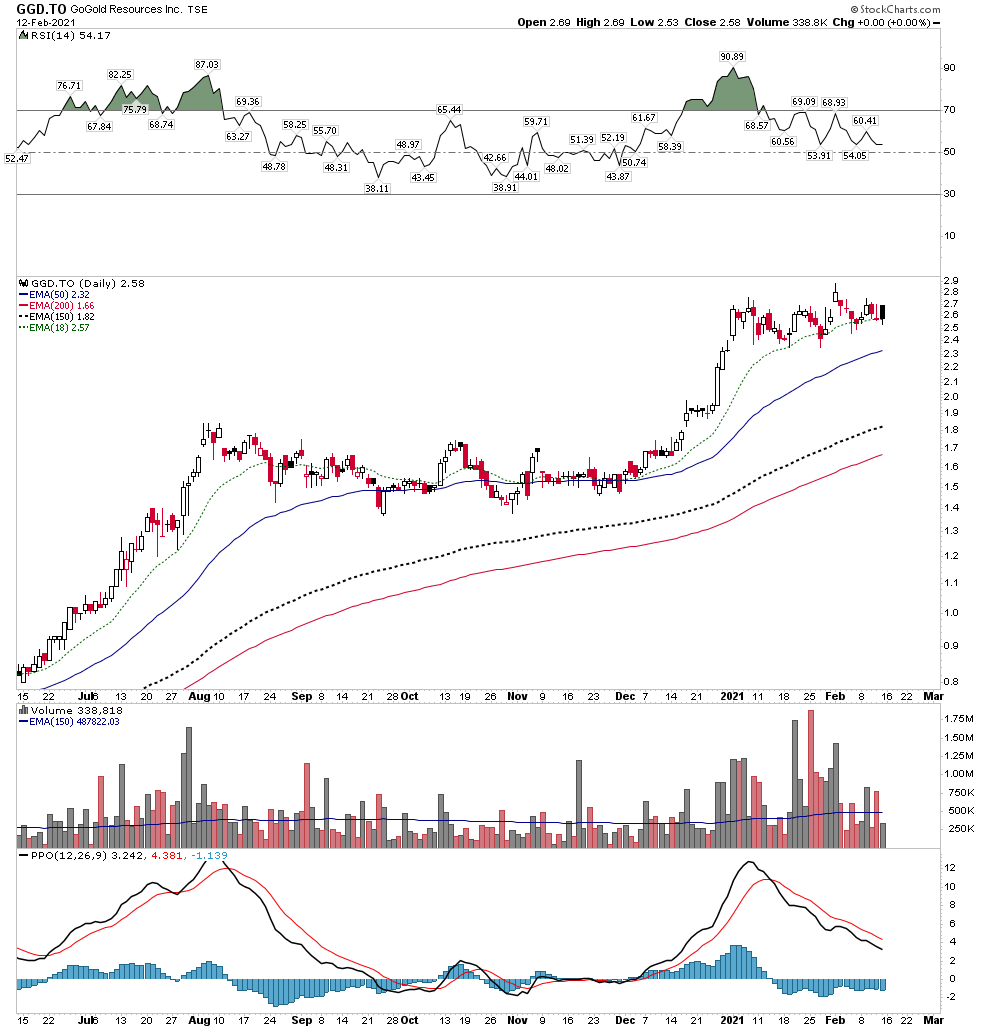
Most stocks in the sector topped out in early August. Some such as Sandstorm and Franco topped in late July. It has been a slow grinding style correction. Surprisingly some high quality stocks have taken the biggest beatings. Barrick -31%, Franco Nevada -29%, Sandstorm – 42%. Silver and the silver stocks have generally fared better. My favorite GoGold (GGD.to) during this period has been a monster, it declined slightly for 6 weeks then resumed its advance to now being 41% above its peak August high.
But those holding most stocks through this correction are beginning to get quite tired of it all. The grinding has now become quite painful. This particularly in light of all the fireworks going on all around us. Bitcoin, Cannabis, Oil, have stolen the show and drawn money away from the PM sector to the point that it feels dead… the psychology has now changed to who needs this stuff!
May I suggest that this is indeed the back drop we needed before the next leg up can resume. From a psychological perspective I think the table has been reset and now the bull may resume.
So how long are these things supposed to last? Looking back over the past 25 years one can see that gold stock corrections last typically from 6 weeks to one year. That’s a wide interval to use as a reference. Some may recall I wrote that the end of the correction was upon us back in late November. I based this on a typical 3-4 month correction and the typical seasonality of the PM market which often has a top in mid-summer and a bottom in late November/early December. Well the actual bottom (so far) was indeed late November (Nov 24). I am suggesting that the action of the past 2 months appears to be the test of those lows put in on Nov 24th. Might we even say a “typical correction”.
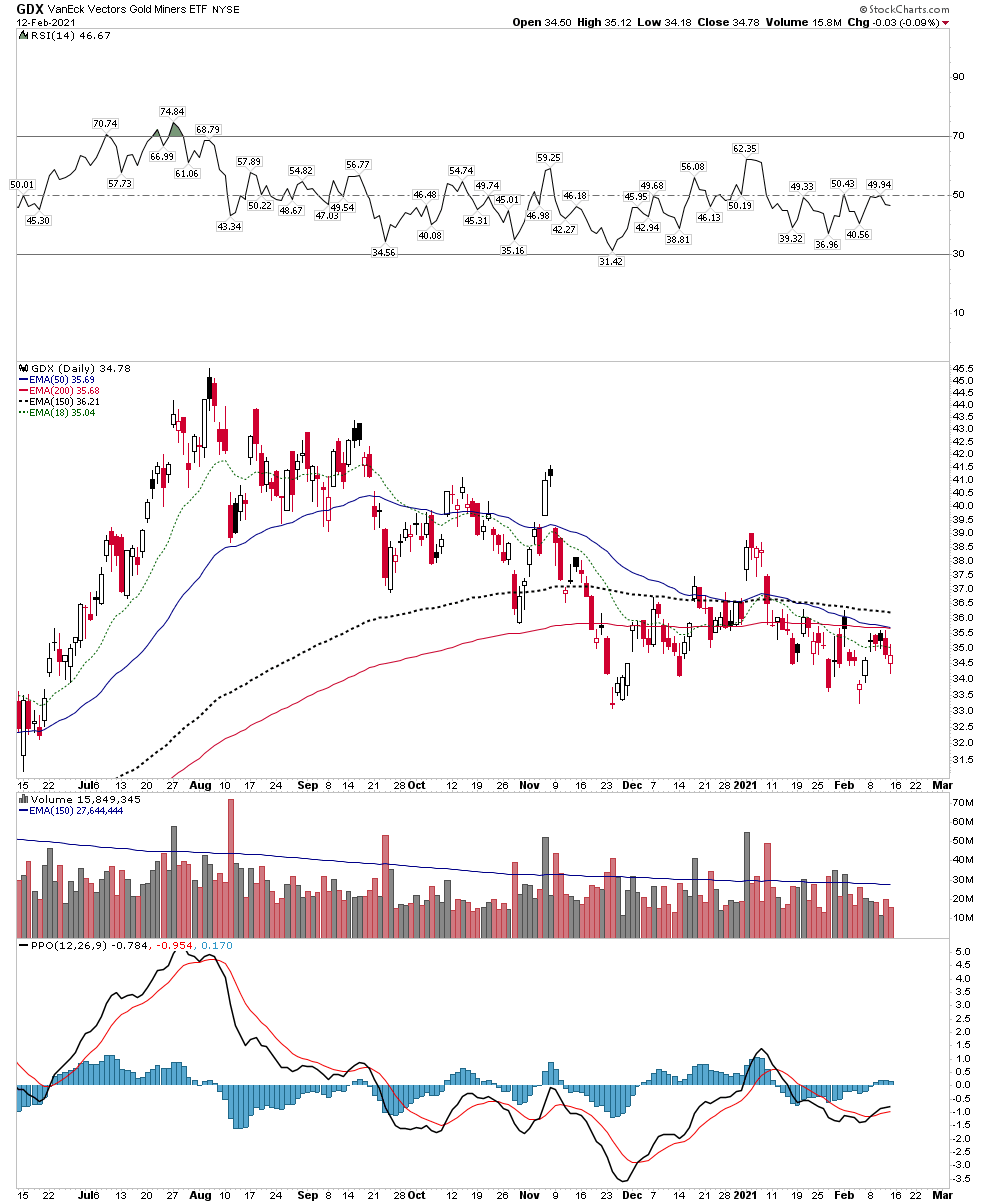
GDX 6-7 Month Correction
Below charts the duration of the correction from the August highs. I am suggesting the action over the past 2 weeks will turn out to be a successful test of the November lows.
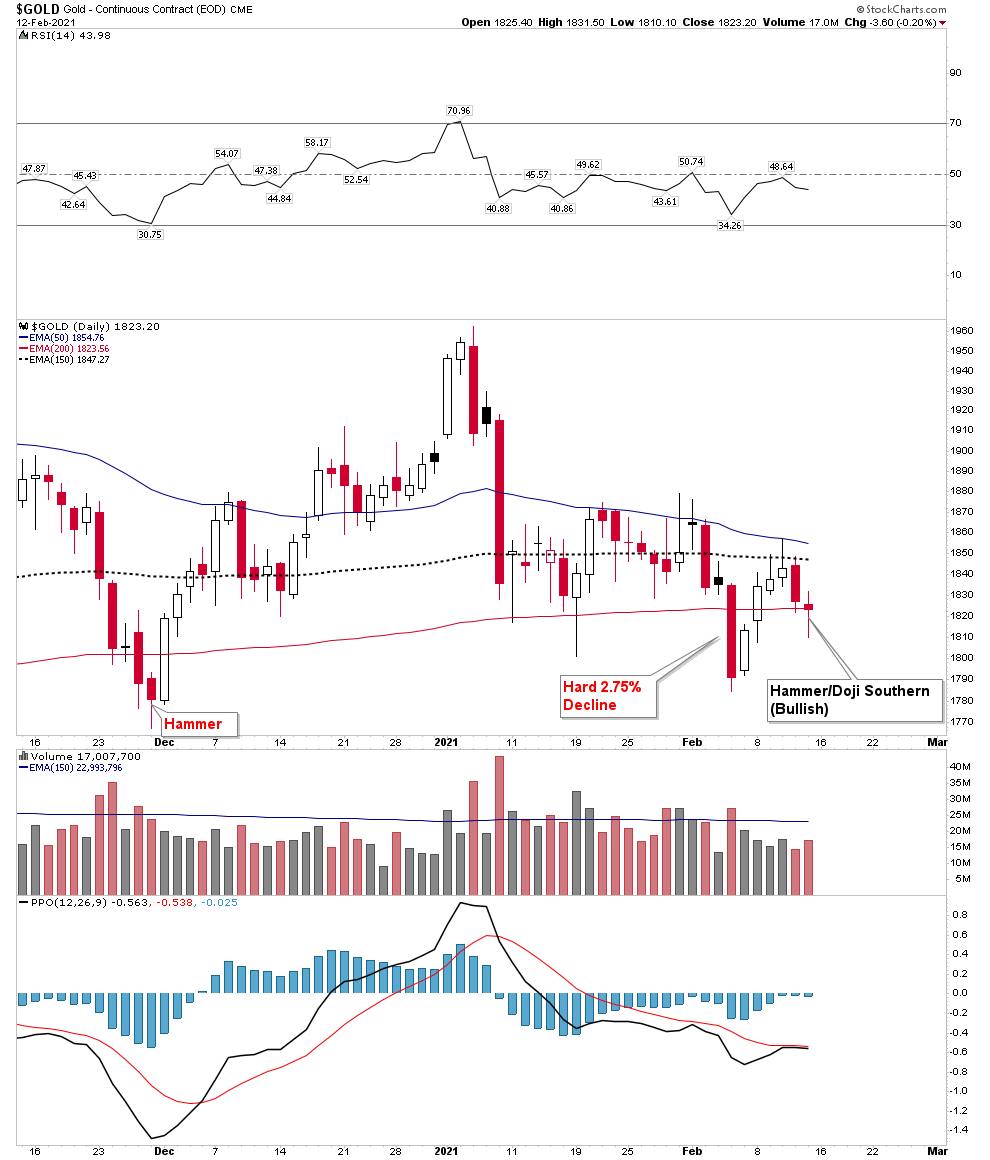
Gold- Candlesticks indicating bottoming action
Let’s first look at gold before moving onto GDX. The November bottom was put in with a hammer candle. Think of a hammer as holding a beachball under water. You can push it down there, but it wants to come up and this is what we saw on that bottom day. Gold then rallied 2 months and retested with a final hard down day where it declined 2.75%. It sliced down through the 200 EMA, but couldn’t find any follow through and rallied right back up above it.
If gold can’t sustain itself above the 200 EMA that’s obviously bearish, however note the volume of the past two days was less than that 2.75% retest day and the candle on Friday was a bullish Hammer holding on the 200 EMA. So far so good. (but still at a critical juncture)
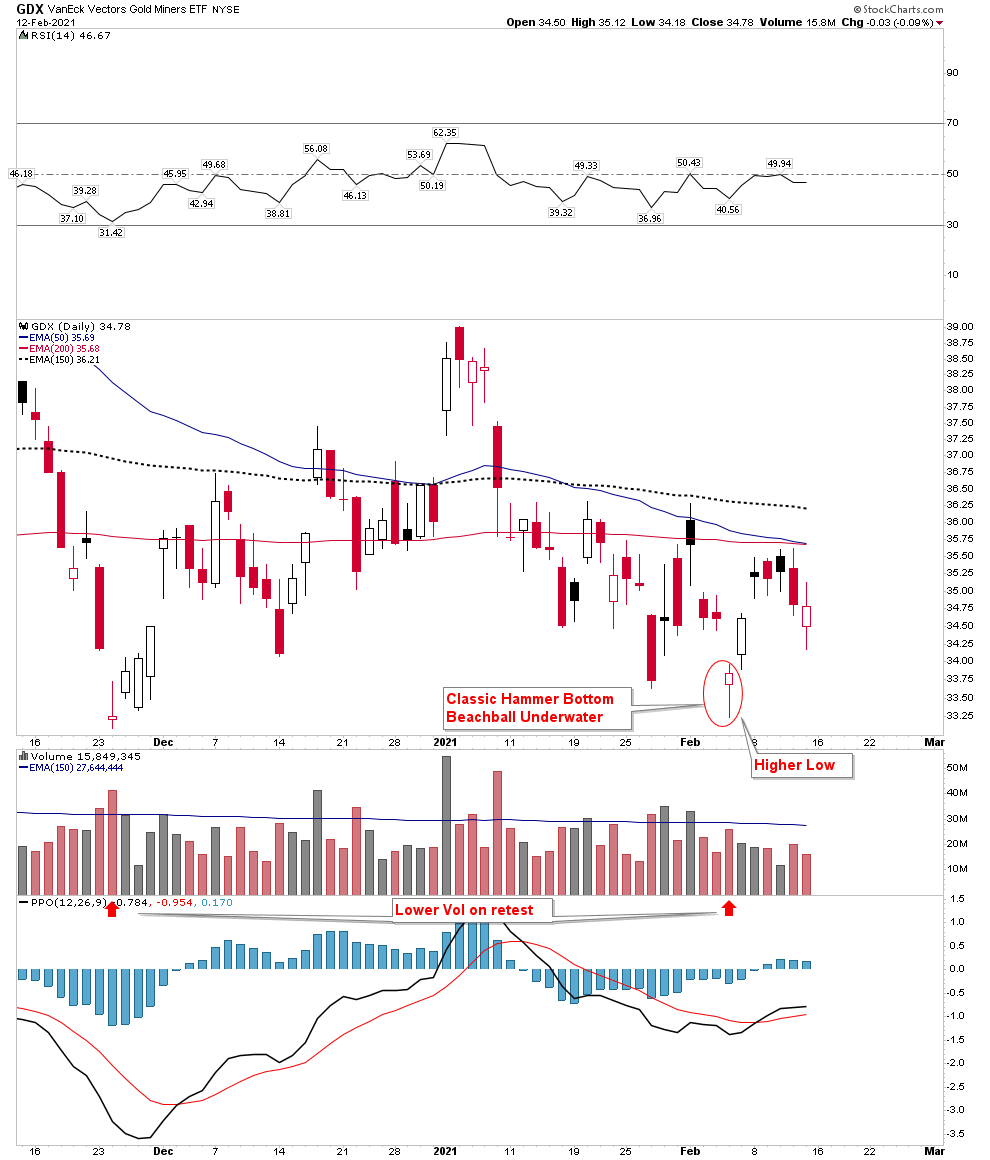
GDX– With the GDX I believe the market begins to reveal itself. Note on November 24th we see a capitulation volume spike at the low. That appears to be the bottom. On the retest in early Feb we see a perfect classic bottom hammer… again think beachball under water. It’s telling us it doesn’t want to go down there anymore. Also keep in mind that was the same day that gold got blasted for 2.75%, yet the stocks showed resilience in the face of a gold pasting. This is the market revealing its hand IMO. The hammer survived the test of the November bottom. Also note that the volume bar on this day was significantly smaller than that capitulation day back in November indicating the market had become washed out.
GDX- Where to from here?
Below is a GDX chart with 2 indicators below. Note the Bollinger Bands are in a narrowed configuration. When they cinch up like this it’s typically a precursor to a powerful move in either direction, it just doesn’t tell which way. The BB width indicator below the chart shows just how extreme the condition presently is. Any reading below 10 is considered a tight narrowing. The message is standby for a big break-out either above or below.
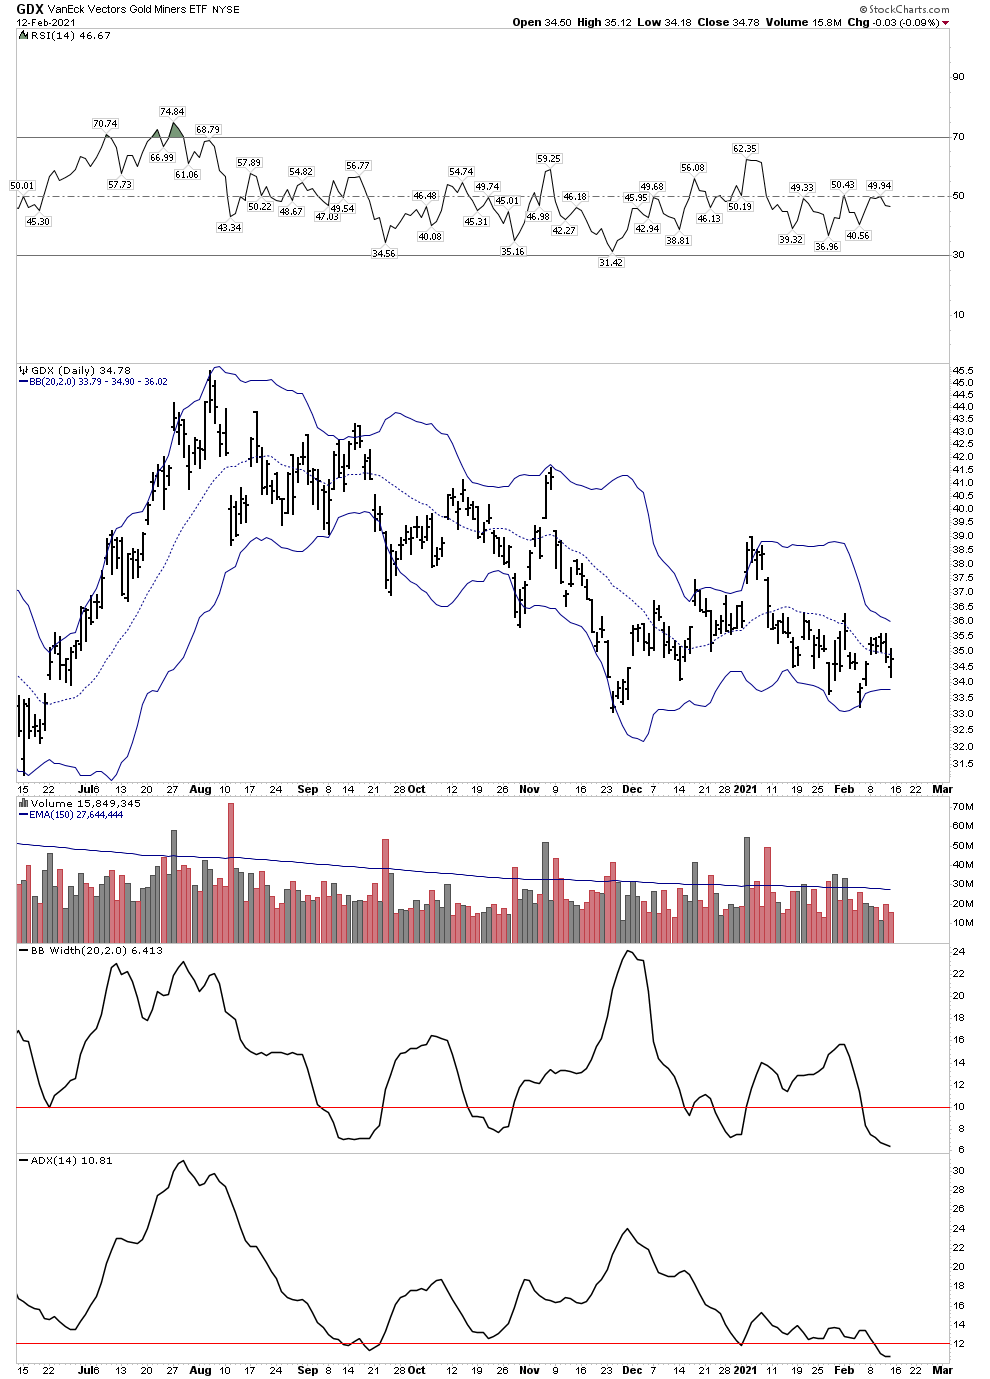
The lower indicator in the above chart is the ADX. This is a measure of trending action. When it pushes down below 12 then turns up a price is set to trend for a long period of time. Pushing it below the 12 level is somewhat like the beachball analogy, it doesn’t stay down there, therefore we are likely to witness a reversal in the near term. This argues for an upside break of the BB and then a long trending period.
This is my current view of the gold market. I realize there is plenty of well supported opinion out there calling for lower gold prices. These calls typically look for $1750 in gold and a correction that will extend for possibly another 6 months. I am not saying they are wrong, but I am saying that the action in the GDX over the past 2 weeks may be broadcasting that the correction is in fact over. This is what I refer to as reading the language of the market. Furthermore, over the past 25 years I have never seen a bottom in the PM sector where the preponderance of opinion was NOT for lower prices at the point of the low. If you think this through you should realize that this is the way it has to be. But I am also aware that all of this action is taking place below a now declining 200 EMA (in GDX not Gold) which means it need serious technical repair before a resumption of the uptrend. Also the advice of market masters such as Stan Weinstein when price is below a declining 150 EMA is to avoid and wait until it rallies back up above the 150 EMA.
Silver- What’s it telling us?
Silver and the silver stocks have been stronger than gold during this correction. Frankly we are told it’s not supposed to be this way. Gold is supposed to lead and silver only comes on strong at the end of the bull market. That’s how it’s always been! So look at this ratio chart below and ask yourself What’s Up?
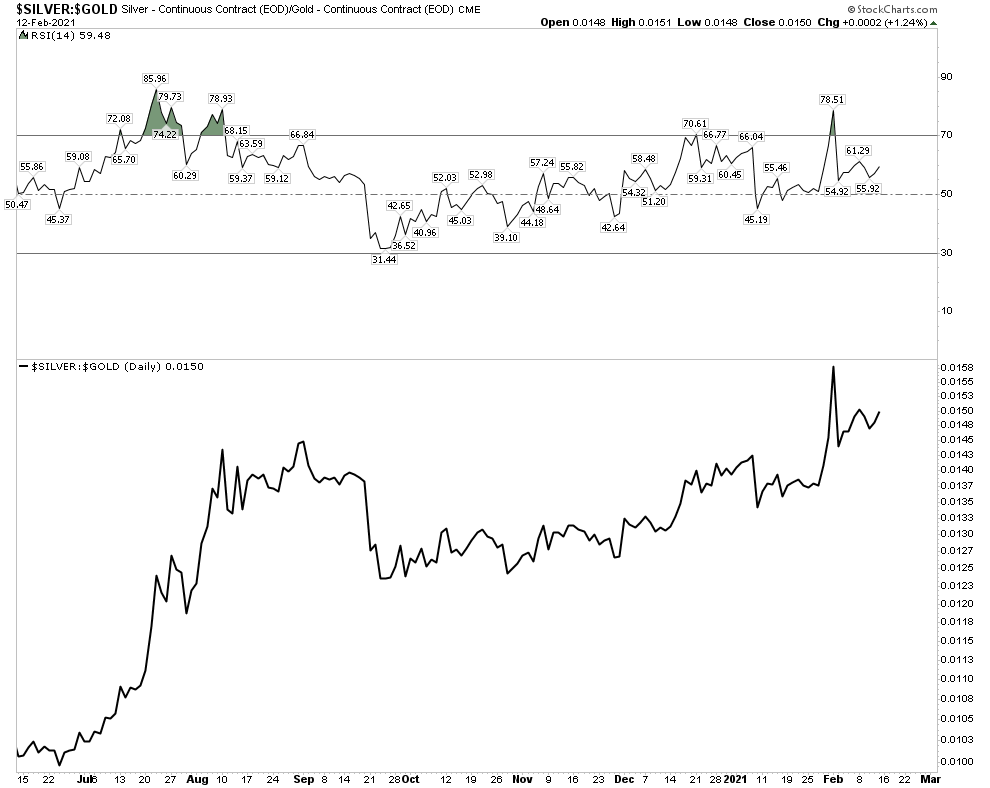
And look at the stocks, junior silvers vs junior golds
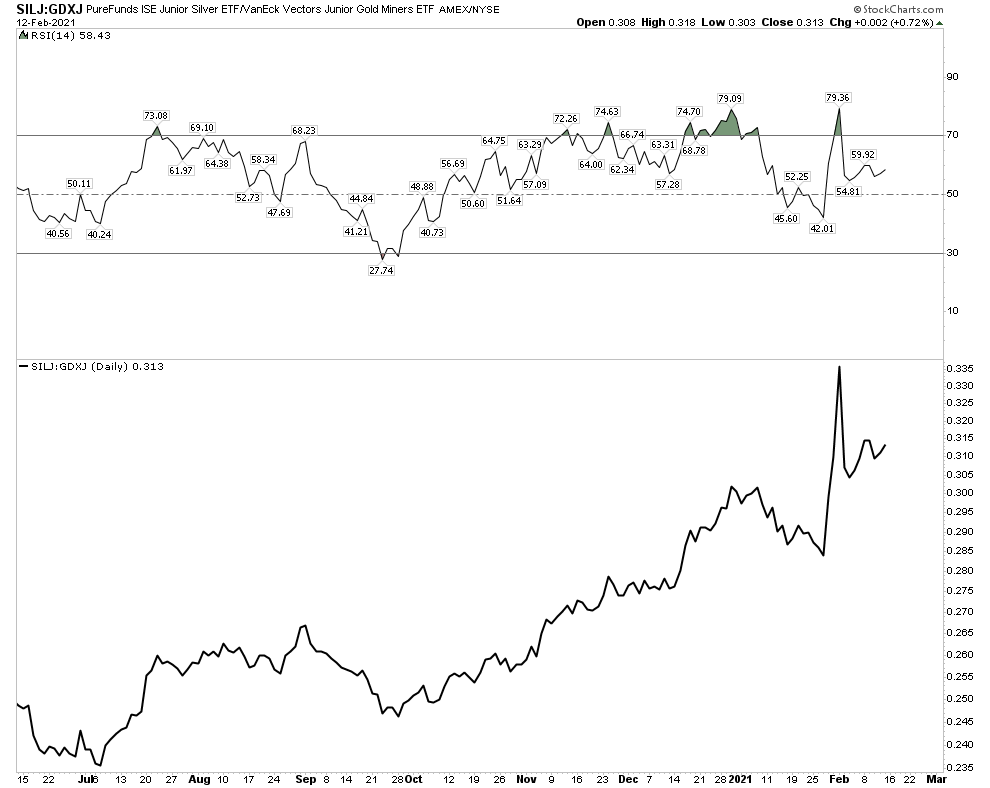
Again, it’s not supposed to be this way. So here is my take on it, I believe this is signaling that this is going to be a raucous bull market which breaks all the past rules. Silver is simply transmitting massive strength. It’s supposed to be a painful crushing correction, if one has held only silver stocks he’s not feeling much pain. I think this has extremely bullish implications for this bull market.
So why the strength in silver? I think it’s because the bullion bank silver cartel is in the process of unraveling and its ability to maintain its concentrated short position is entering into its last days. This is the subject for another posting, but despite the army of silver detractors out there the charts signal to me that silver is on the verge of a break out. A classic case of the financial establishment insisting that you don’t believe your lying eyes when you look at a silver chart.
Last Word- Be careful out there!
I am trying to be objective, but you can see this is a bullish interpretation of the charts. There is no guarantee that the correction is over. What I have outlined here is that I interpret the charts as issuing positive internal action signals indicating the bottom is in. All of this analysis could be proven flawed with only one hard down day. Do not go all in and plunge. Do not use margin as it can destroy your portfolio, the gold stocks have enough leverage without using margin… Good Luck.
Plunger