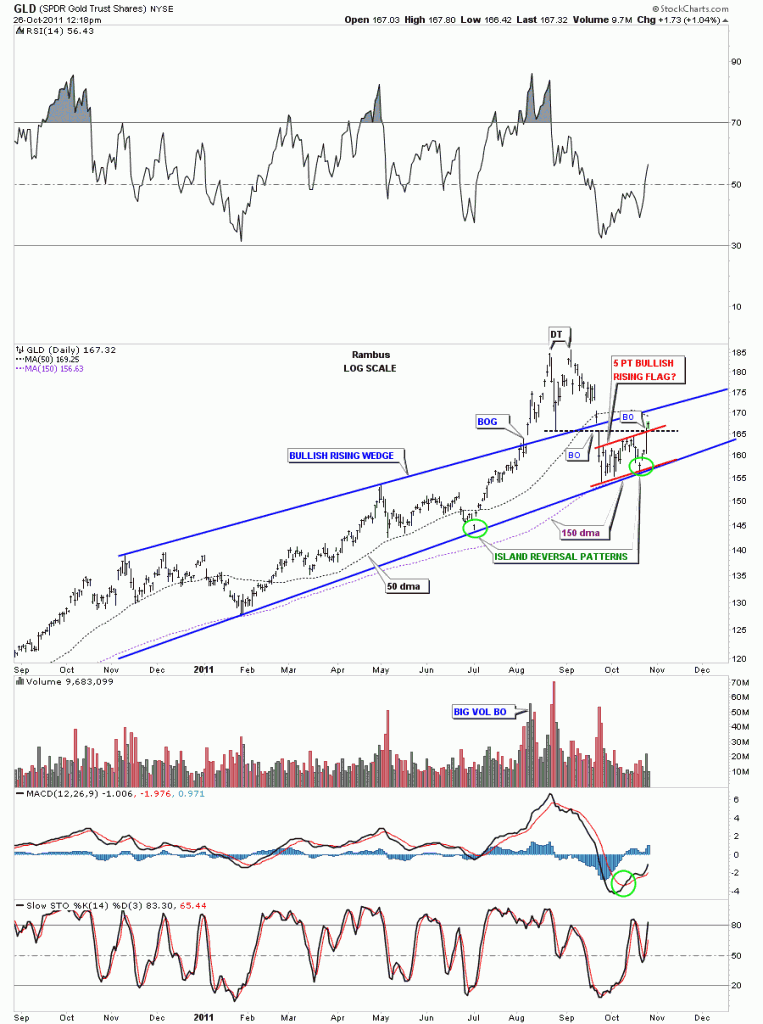
Yesterday we looked at alot of short term, 60 minute charts, to see how our month long consolidation patterns have been progressing. Today I want to put our little 5 point bullish rising flag into perspective on the daily look for GLD. So far GLD is doing everything right for a positive resolution to the upside. This morning we took out two critical resistance rails, one being the black dashed horizontal rail that marked the breakout from the double top. We also took out the top rail of the 5 point bullish rising flag. As you can see the two rails intersected right at today’s price action. If GLD was weak it probably would have failed at that critical resistance point. The fact that we are trading above that resistance is a good sign. I have circled in green two little Island reversal patterns that formed right on the bottom rail of the bullish rising wedge. This is also a positive. The next positive thing about the daily GLD chart is we once again have bounce off the 150 dma which has held any correction for the last two years or so. One more positive sign is how the bottom rail of the bullish rising wedge has held support during this correction. That takes care of the positive stuff. As you can see on the chart below we have 2 more resistance rails just above today’s action. One is the 50 dma and the other is the top rail of the bullish rising wedge. If we can get thru those last 2 resistance points then GLD should be go to go for awhile. Stay tuned as these are interesting times in the precious metals complex.
GLD daily look.

