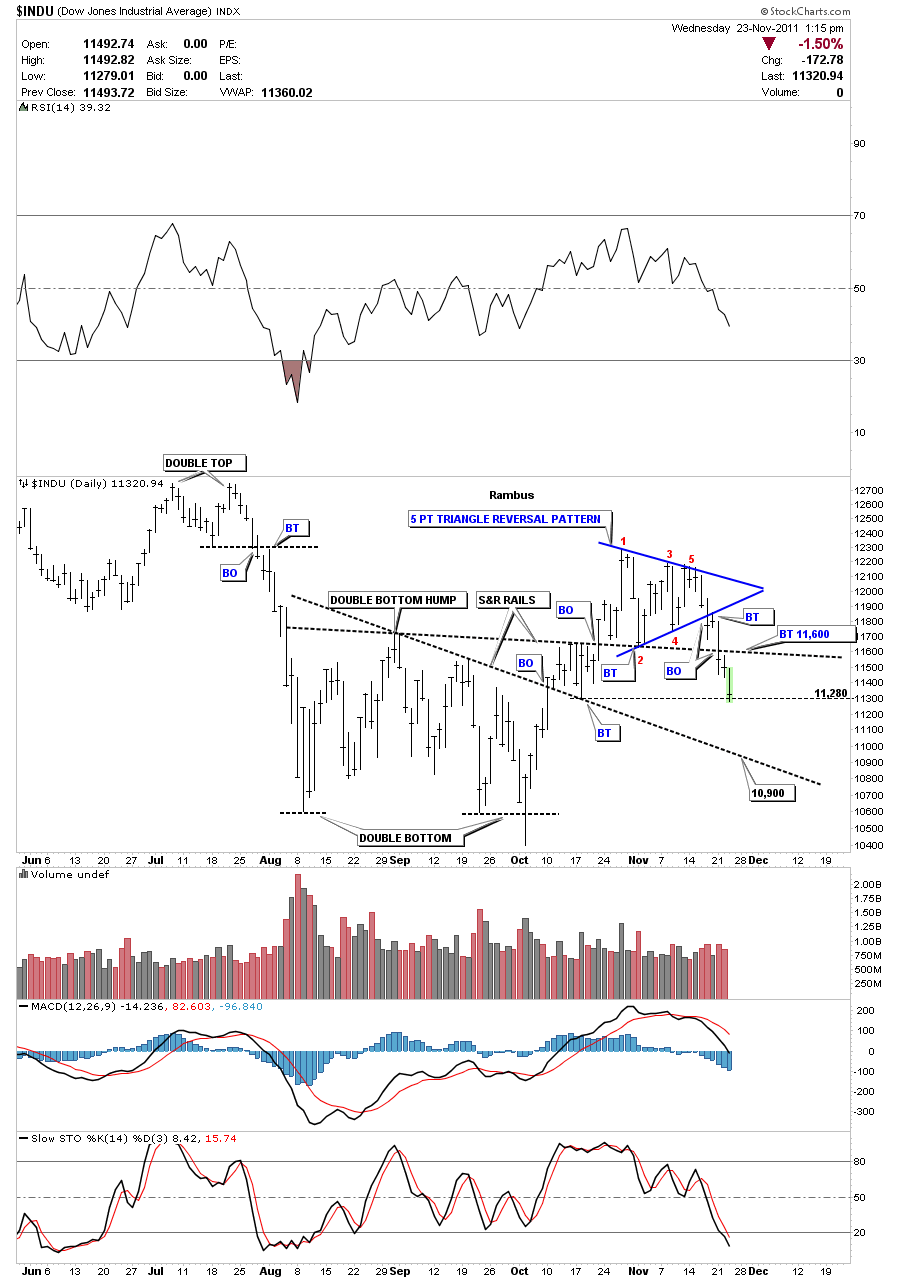
Below is the 6 month daily chart of the Dow that I’ve been showing with the 5 point triangle reversal pattern. You can see the little backtest to the bottom blue rail last Friday that strongly suggested the triangle was indeed a reversal pattern. Its always important to observe how we interact with an important trendline such as the bottom rail of the triangle reversal pattern for clues. If we were able to trade back inside the triangle that would have put me back to neutral, but as you can see the backtest was successful and the Dow has dropped about 460 points so far this week. This Thanksgiving week is usually a positive week for the stock markets. I’ve marked 10,900 as a possible place for a counter trend rally to occur. I also drew in a thin dashed black horizontal rail that was the low of the backtest of the lower S&R rail that could offer alittle support. As you can see there isn’t much in the way of support until we get to that lower S&R rail at 10,900.
Dow 6 month dail look.

